Gold (XAU/USD) 15-Minute Technical Analysis
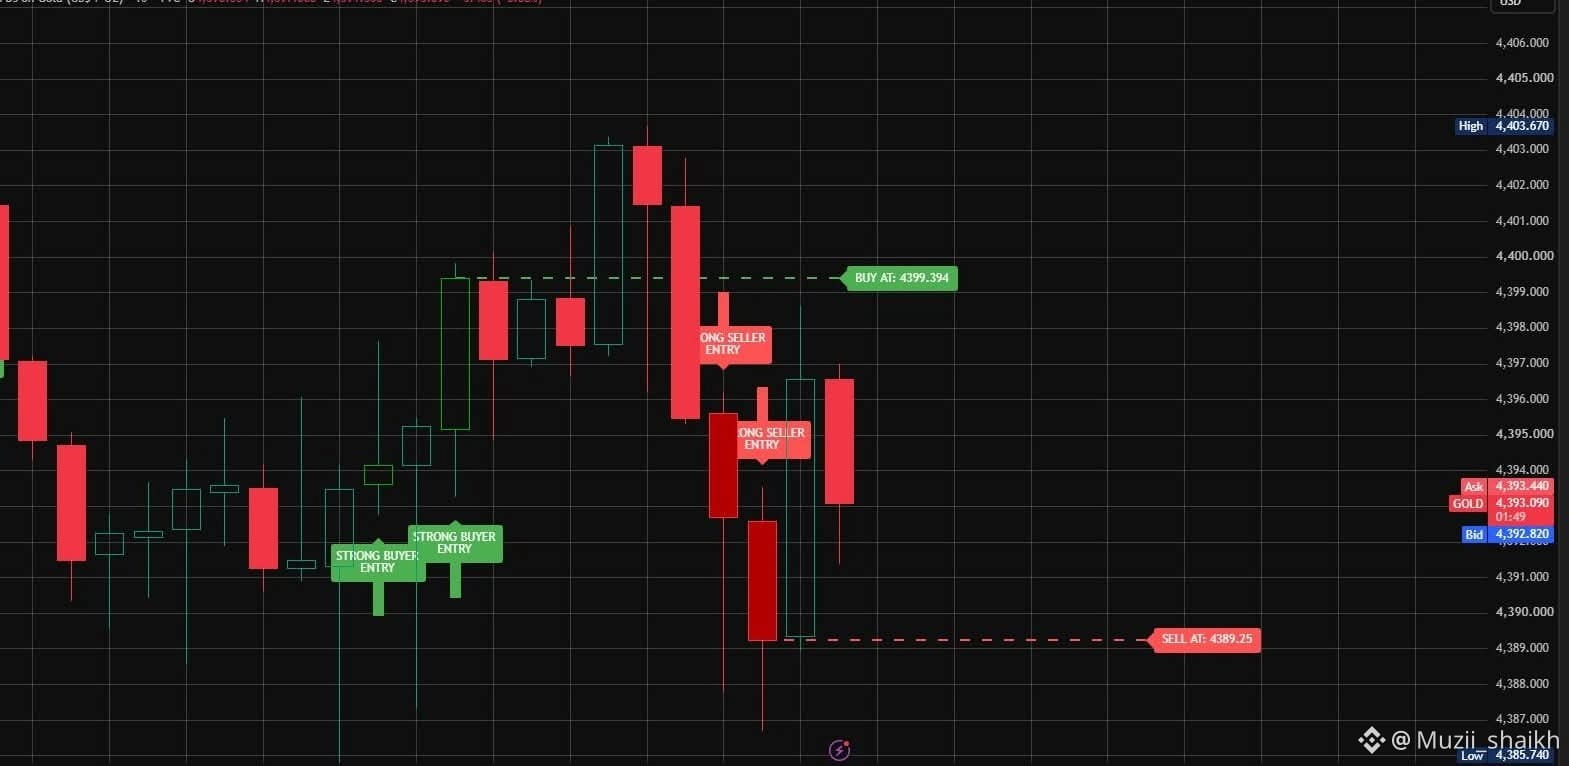
The 15-minute Gold chart displays a period of sharp volatility with distinct buyer and seller rejection zones:
Bullish Momentum: Strong buyer entries pushed price action upward to hit a local high near 4,403.67.
Bearish Reversal: High-volume seller entries triggered a rapid sell-off, pulling prices down toward key support near the session low of 4,385.74.
Key Levels to Watch:
Buy Signal / Resistance: Breakout above 4,399.39 signals potential continuation toward the 4,403.67 high.
Sell Signal / Support: Breakdown below 4,389.25 confirms continued bearish pressure targeting key low levels.
Current Price: Consolidating around 4,393.09.
#GoldAnalysis #XAUUSD #TechnicalAnalysis #TradingView #ForexTrading #CryptoTrading #DayTrading #GoldPrice #PriceAction #ChartAnalysis
The 15-minute Gold chart displays a period of sharp volatility with distinct buyer and seller rejection zones:
Bullish Momentum: Strong buyer entries pushed price action upward to hit a local high near 4,403.67.
Bearish Reversal: High-volume seller entries triggered a rapid sell-off, pulling prices down toward key support near the session low of 4,385.74.
Key Levels to Watch:
Buy Signal / Resistance: Breakout above 4,399.39 signals potential continuation toward the 4,403.67 high.
Sell Signal / Support: Breakdown below 4,389.25 confirms continued bearish pressure targeting key low levels.
Current Price: Consolidating around 4,393.09.
#GoldAnalysis #XAUUSD #TechnicalAnalysis #TradingView #ForexTrading #CryptoTrading #DayTrading #GoldPrice #PriceAction #ChartAnalysis