### *@Bitcoi 最新分析 - 2026年8月15日* 📊
*現在価格: $62,961* ~ *$63,000*
*24時間の変化: -0.02%* ~ *+0.16%* 94e9f722
---
#### *1. テクニカル見取り図*
水準 価格 注記
**レジスタンス** $63,540 / $64,151 / $64,654 $65,000 は重要なレジスタンス
**サポート** $62,427 / $61,924 / $61,314 $61,000 は重要なサポート
**日中レンジ** $62,856 - $63,086 レンジ圧縮
**7日間の値動き** -2.99% やや下方向の圧力
**30日間の値動き** -1.30% 下落トレンドの継続
**RSI 14** 45.96 ニュートラル 明確なモメンタムなし
**マーケットバイアス** "下方向に傾く圧力" 30日平均との差 $64,217 を下回る
7d0828c994e945cc
*ストーリー*: @BTC - は *$61K - $65K のレンジ* に張り付いた状態です。 流動性が低く、マクロデータ+ETFフローが短期の値動きを左右しています。 28c9
#### *2. 大局観 2026*
- *YTD*: -26%。10月の高値 $126,132 から -48.49%
- *理由*: 金利上昇(リスクフリー金利が上がる)+タカ派なFRB姿勢=利回りのない @BTC - にとって機会費用が高まる
- スポット・ビットコインETFは6週間で$6Bの流出
- *長期*: 大手がオンチェーン保有を増やしていること+規制面の楽観が、構造的な底の形成を支える 6af30672b51128c9
#### *3. 次に何が起きる?*
*強気シナリオ 🟢*: $65,000 を上抜ければ、新たなトレンド相場が始まる可能性
*弱気シナリオ 🔴*: $61,000 を下抜ければ、ストップロス連鎖が発動する可能性 28c9
アナリストはこう言っています: "レンジ下限付近で分割して買い増し、そしてリスク管理を厳格に実行すること" 28c9
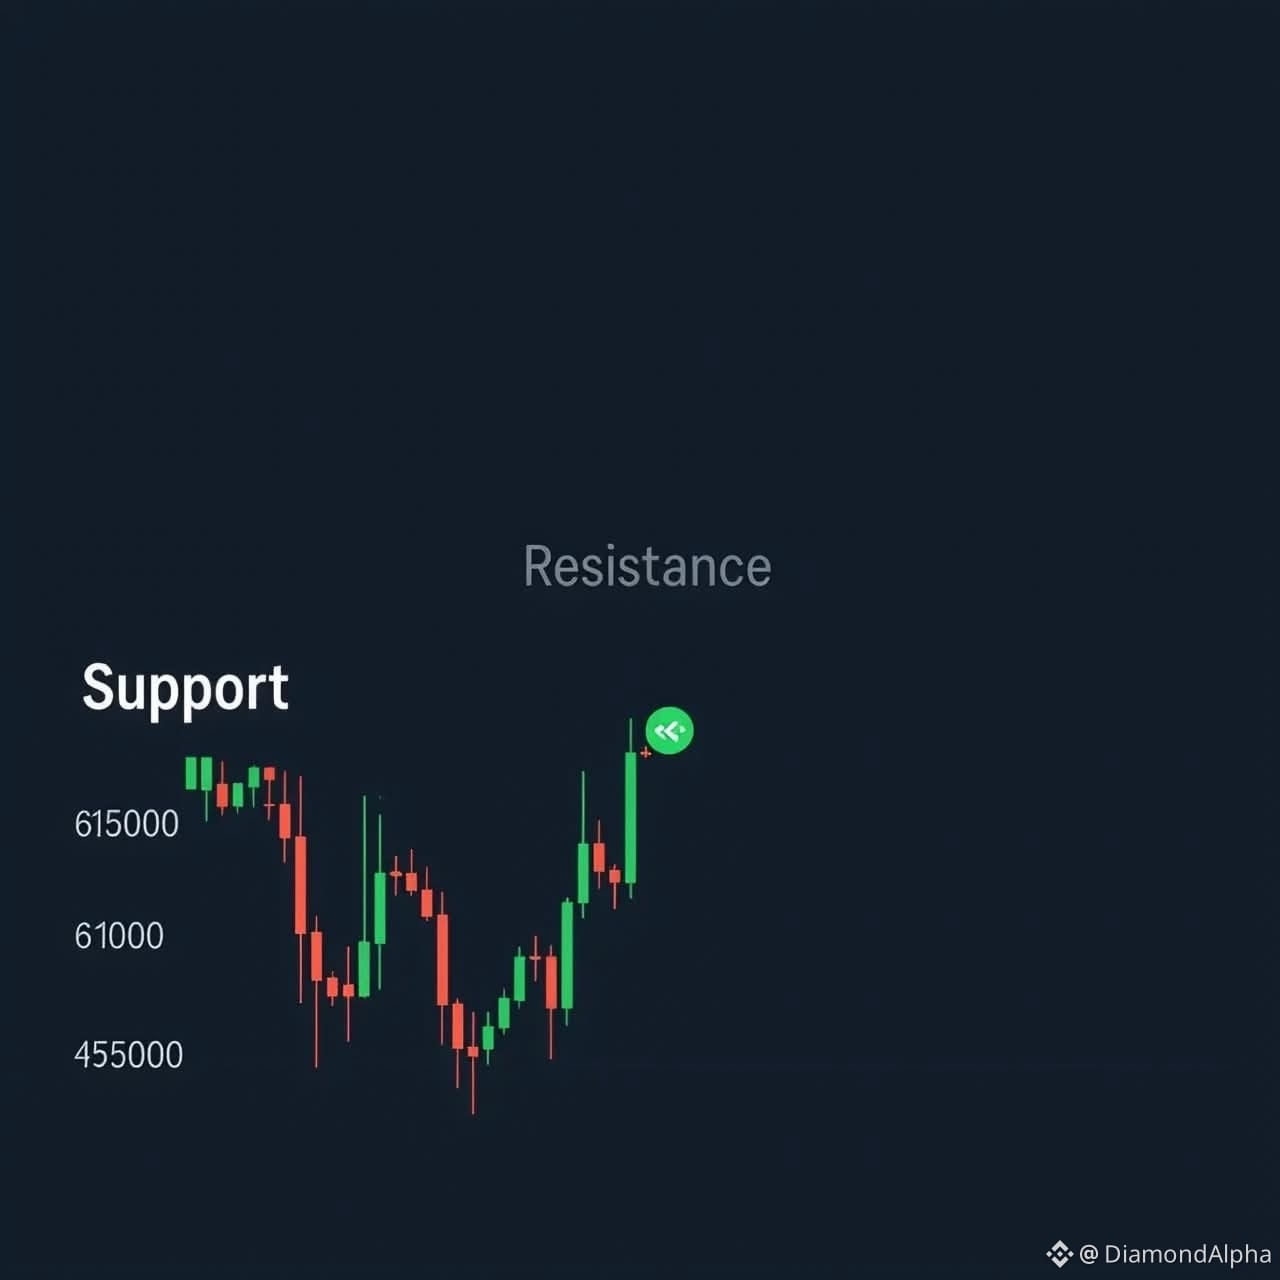
#### *4. 参照図*
以下は現在のBTCUSDTチャート構造です:
- 価格 ∼$62,960
- 第1サポート $62,427 と 第1レジスタンス $63,540 の間で推移
- ボリューム・パルス -19.74%(30日平均比)=確信度が弱い 7d0894e9
---
*まとめ*: ビットコインは「様子見ゾーン」にあります。 $61K が下抜けるか、$65K が上抜けるまで明確なトレンドは出ていません。小口口座なら、無理に取引を押し付けるよりサイドラインで見守るのがよいでしょう。 28c9
チャート画像に $61K のサポートと $65K のレジスタンスを私がマークしておきましょうか?
#BTC
#bitcoin
#Binance
*現在価格: $62,961* ~ *$63,000*
*24時間の変化: -0.02%* ~ *+0.16%* 94e9f722
---
#### *1. テクニカル見取り図*
水準 価格 注記
**レジスタンス** $63,540 / $64,151 / $64,654 $65,000 は重要なレジスタンス
**サポート** $62,427 / $61,924 / $61,314 $61,000 は重要なサポート
**日中レンジ** $62,856 - $63,086 レンジ圧縮
**7日間の値動き** -2.99% やや下方向の圧力
**30日間の値動き** -1.30% 下落トレンドの継続
**RSI 14** 45.96 ニュートラル 明確なモメンタムなし
**マーケットバイアス** "下方向に傾く圧力" 30日平均との差 $64,217 を下回る
7d0828c994e945cc
*ストーリー*: @BTC - は *$61K - $65K のレンジ* に張り付いた状態です。 流動性が低く、マクロデータ+ETFフローが短期の値動きを左右しています。 28c9
#### *2. 大局観 2026*
- *YTD*: -26%。10月の高値 $126,132 から -48.49%
- *理由*: 金利上昇(リスクフリー金利が上がる)+タカ派なFRB姿勢=利回りのない @BTC - にとって機会費用が高まる
- スポット・ビットコインETFは6週間で$6Bの流出
- *長期*: 大手がオンチェーン保有を増やしていること+規制面の楽観が、構造的な底の形成を支える 6af30672b51128c9
#### *3. 次に何が起きる?*
*強気シナリオ 🟢*: $65,000 を上抜ければ、新たなトレンド相場が始まる可能性
*弱気シナリオ 🔴*: $61,000 を下抜ければ、ストップロス連鎖が発動する可能性 28c9
アナリストはこう言っています: "レンジ下限付近で分割して買い増し、そしてリスク管理を厳格に実行すること" 28c9
#### *4. 参照図*
以下は現在のBTCUSDTチャート構造です:
- 価格 ∼$62,960
- 第1サポート $62,427 と 第1レジスタンス $63,540 の間で推移
- ボリューム・パルス -19.74%(30日平均比)=確信度が弱い 7d0894e9
---
*まとめ*: ビットコインは「様子見ゾーン」にあります。 $61K が下抜けるか、$65K が上抜けるまで明確なトレンドは出ていません。小口口座なら、無理に取引を押し付けるよりサイドラインで見守るのがよいでしょう。 28c9
チャート画像に $61K のサポートと $65K のレジスタンスを私がマークしておきましょうか?
#BTC
#bitcoin
#Binance