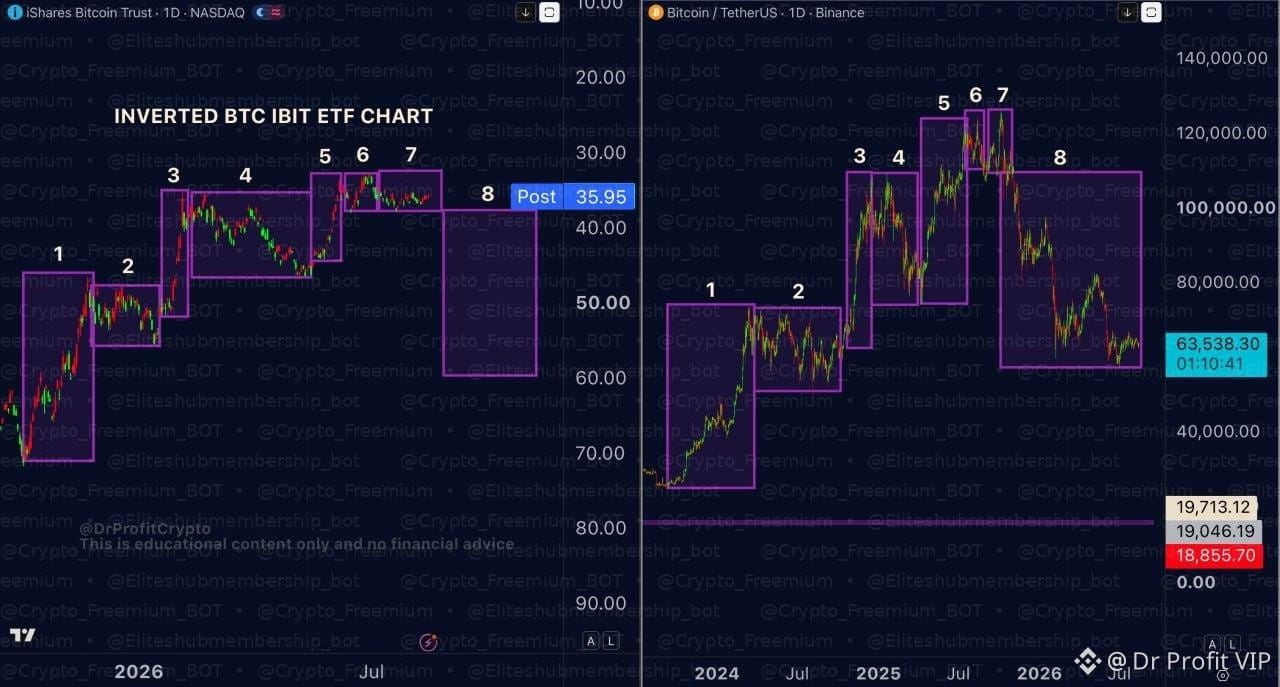
非常に興味深いチャート:
左:IBIT、INVERTED、ブラックロックの$BTC ETF。日足チャートです。2025年以降、2023年から2025年の高値までのビットコインの強気相場とまったく同じパターンに従っています。パターンは同じで、違うのは時間軸だけです。つまり、2025年の高値のパターンに従うなら、IBITチャートでは下落が見られるはずです。そしてこれは反転(インバース)チャートなので、IBITの価格は上昇方向に進むことになります!
重要なのは、両チャートの間に相関関係が一切なかったことです。片方は2023〜2025/2026をカバーしているのに対し、もう片方は2025〜2026だけをカバーしているからです。それでも、ブラックロックのチャートで見られるパターンの繰り返しは、2023年以降のビットコインの動きとほぼそのまま同じように確認できます。
右:2023年から今日までのビットコインの強気相場チャート。
左:IBIT、INVERTED、ブラックロックの$BTC ETF。日足チャートです。2025年以降、2023年から2025年の高値までのビットコインの強気相場とまったく同じパターンに従っています。パターンは同じで、違うのは時間軸だけです。つまり、2025年の高値のパターンに従うなら、IBITチャートでは下落が見られるはずです。そしてこれは反転(インバース)チャートなので、IBITの価格は上昇方向に進むことになります!
重要なのは、両チャートの間に相関関係が一切なかったことです。片方は2023〜2025/2026をカバーしているのに対し、もう片方は2025〜2026だけをカバーしているからです。それでも、ブラックロックのチャートで見られるパターンの繰り返しは、2023年以降のビットコインの動きとほぼそのまま同じように確認できます。
右:2023年から今日までのビットコインの強気相場チャート。