🚀 SpaceX(SPCX)ロケット +9.63%! 技術的な反転が進行中 – 200ドル超へ戻るのか?
SpaceX(SPCX)は、長い冷却フェーズを経た後に活発な兆候を見せています。1回の取引で +9.63% を記録し、$SPCXXwith プレマーケットの勢いがさらに $147.49 まで押し上げ、買い手が力強く戻ってきています!
では、注目すべきテクニカルのセットアップと重要な価格水準を整理しましょう。👇
📊 市場サマリー
指標 現在の値
現在の価格 $146.20(+9.63%)
寄り前 $147.49(+0.88%)
24時間のレンジ $134.01– $149.60時価総額 $1,927.17B(約$1.92兆)
直近の底 $104.84(8月7日)
📈 テクニカル分析:重要ポイント
1. $104.84 底値からの堅いリバーサル
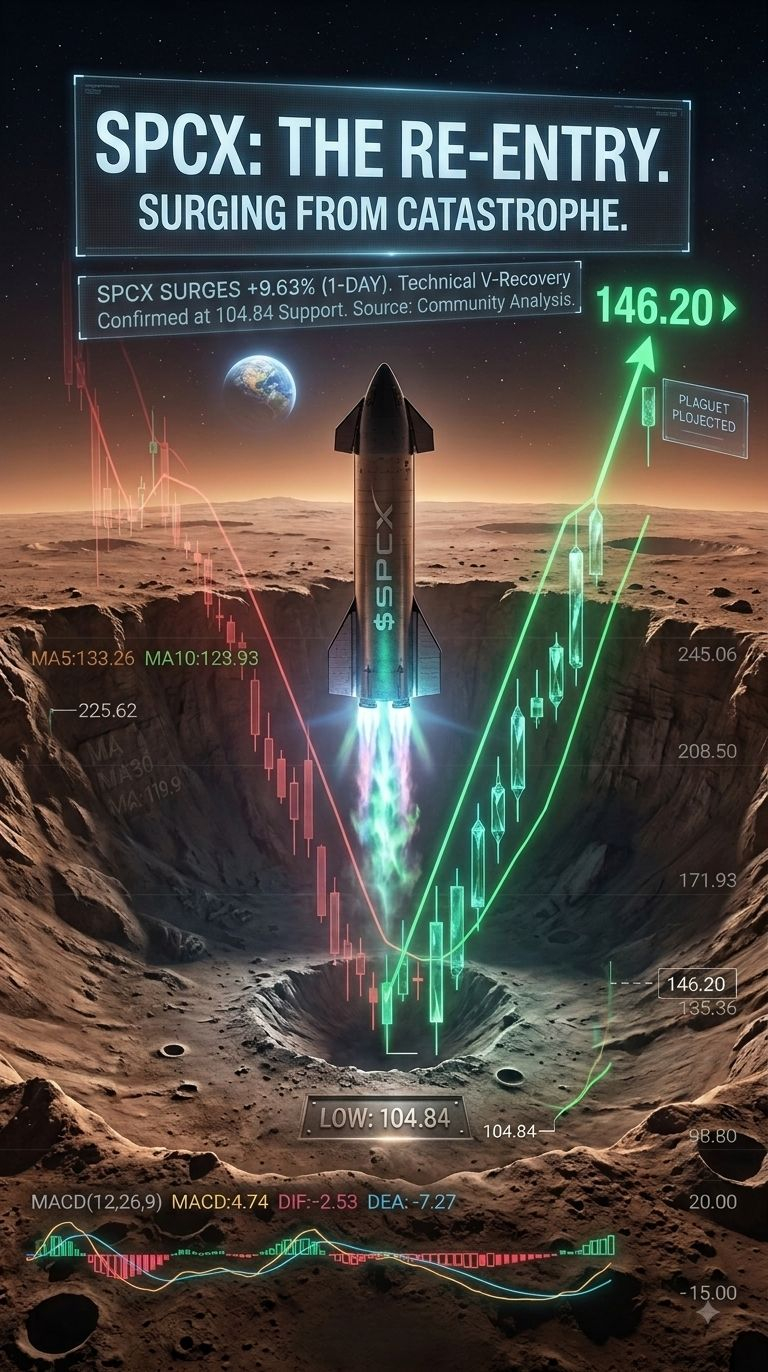
$225.62の高値から下げた後、SPCXは $104.84 に強い底を形成しました。この鋭いV字回復は、低い水準での機関投資家による強い積み上がりを示唆しています。
2. 強気の移動平均(MA)アライメント
4時間足:短期トレンドは攻撃的に強気へ転じています。MA5($139.23)とMA10($131.56)が、MA30($119.93)を決定的に上抜けました。
1日足:価格は5日線($133.26)と10日線($123.59)の両方を取り戻し、30日線($130.38)へのギャップを急速に縮めています。
3. MACDのモメンタム拡大
4HのMACD(12, 26, 9)指標は、強い緑のヒストグラム拡大で、プラス圏にしっかり入り込んでいます(DIF 5.13 / DEA 1.45)。
日足MACDは6月の上昇以来初めて緑に切り替わり、トレンド継続の勢いを裏付けています。
🎯 注目すべき主要レベル
🛡️ 直近のサポート:
$135.00(前回のブレイク / 需給の空白エリア)
$119.90(4H MA30水準)
$104.84(主要な循環的サポート)
🎯 レジスタンス目標:
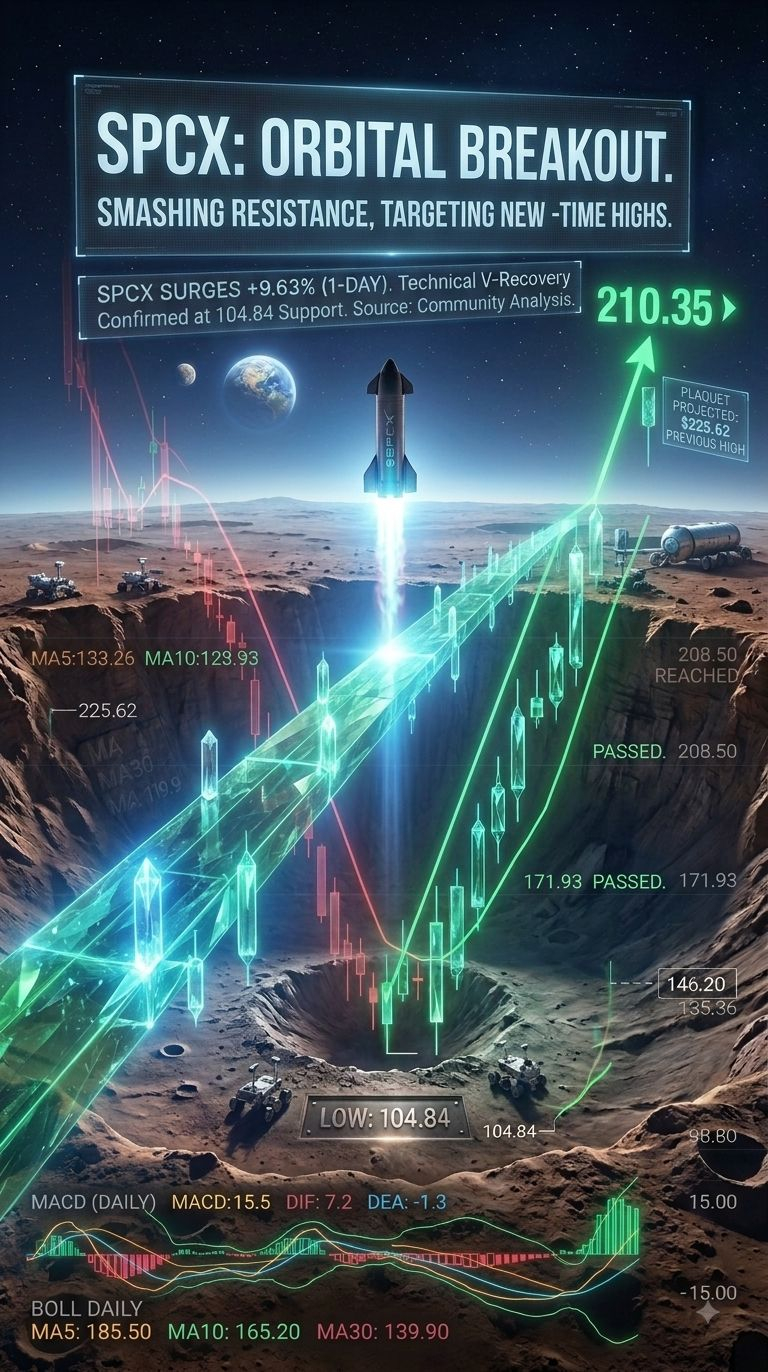
$171.93(最初の主要レジスタンス・バリア)
$208.50(心理的 / 中期のターゲット)
$225.62(直近の高値)
💡 まとめ & 戦略
SPCXは、高い出来高と拡大するモメンタム指標に支えられた、典型的なトレンド反転の動きを示しています。価格が小さな押し目で$135.00を維持できるなら、短期〜中期で$170〜$175のレジスタンス帯を再テストする可能性は非常に高いと見込まれます。
$SPCX
$SPCXB
#SPCX #SpaceX #spcxb
SpaceX(SPCX)は、長い冷却フェーズを経た後に活発な兆候を見せています。1回の取引で +9.63% を記録し、$SPCXXwith プレマーケットの勢いがさらに $147.49 まで押し上げ、買い手が力強く戻ってきています!
では、注目すべきテクニカルのセットアップと重要な価格水準を整理しましょう。👇
📊 市場サマリー
指標 現在の値
現在の価格 $146.20(+9.63%)
寄り前 $147.49(+0.88%)
24時間のレンジ $134.01– $149.60時価総額 $1,927.17B(約$1.92兆)
直近の底 $104.84(8月7日)
📈 テクニカル分析:重要ポイント
1. $104.84 底値からの堅いリバーサル
$225.62の高値から下げた後、SPCXは $104.84 に強い底を形成しました。この鋭いV字回復は、低い水準での機関投資家による強い積み上がりを示唆しています。
2. 強気の移動平均(MA)アライメント
4時間足:短期トレンドは攻撃的に強気へ転じています。MA5($139.23)とMA10($131.56)が、MA30($119.93)を決定的に上抜けました。
1日足:価格は5日線($133.26)と10日線($123.59)の両方を取り戻し、30日線($130.38)へのギャップを急速に縮めています。
3. MACDのモメンタム拡大
4HのMACD(12, 26, 9)指標は、強い緑のヒストグラム拡大で、プラス圏にしっかり入り込んでいます(DIF 5.13 / DEA 1.45)。
日足MACDは6月の上昇以来初めて緑に切り替わり、トレンド継続の勢いを裏付けています。
🎯 注目すべき主要レベル
🛡️ 直近のサポート:
$135.00(前回のブレイク / 需給の空白エリア)
$119.90(4H MA30水準)
$104.84(主要な循環的サポート)
🎯 レジスタンス目標:
$171.93(最初の主要レジスタンス・バリア)
$208.50(心理的 / 中期のターゲット)
$225.62(直近の高値)
💡 まとめ & 戦略
SPCXは、高い出来高と拡大するモメンタム指標に支えられた、典型的なトレンド反転の動きを示しています。価格が小さな押し目で$135.00を維持できるなら、短期〜中期で$170〜$175のレジスタンス帯を再テストする可能性は非常に高いと見込まれます。
$SPCX
$SPCXB
#SPCX #SpaceX #spcxb