
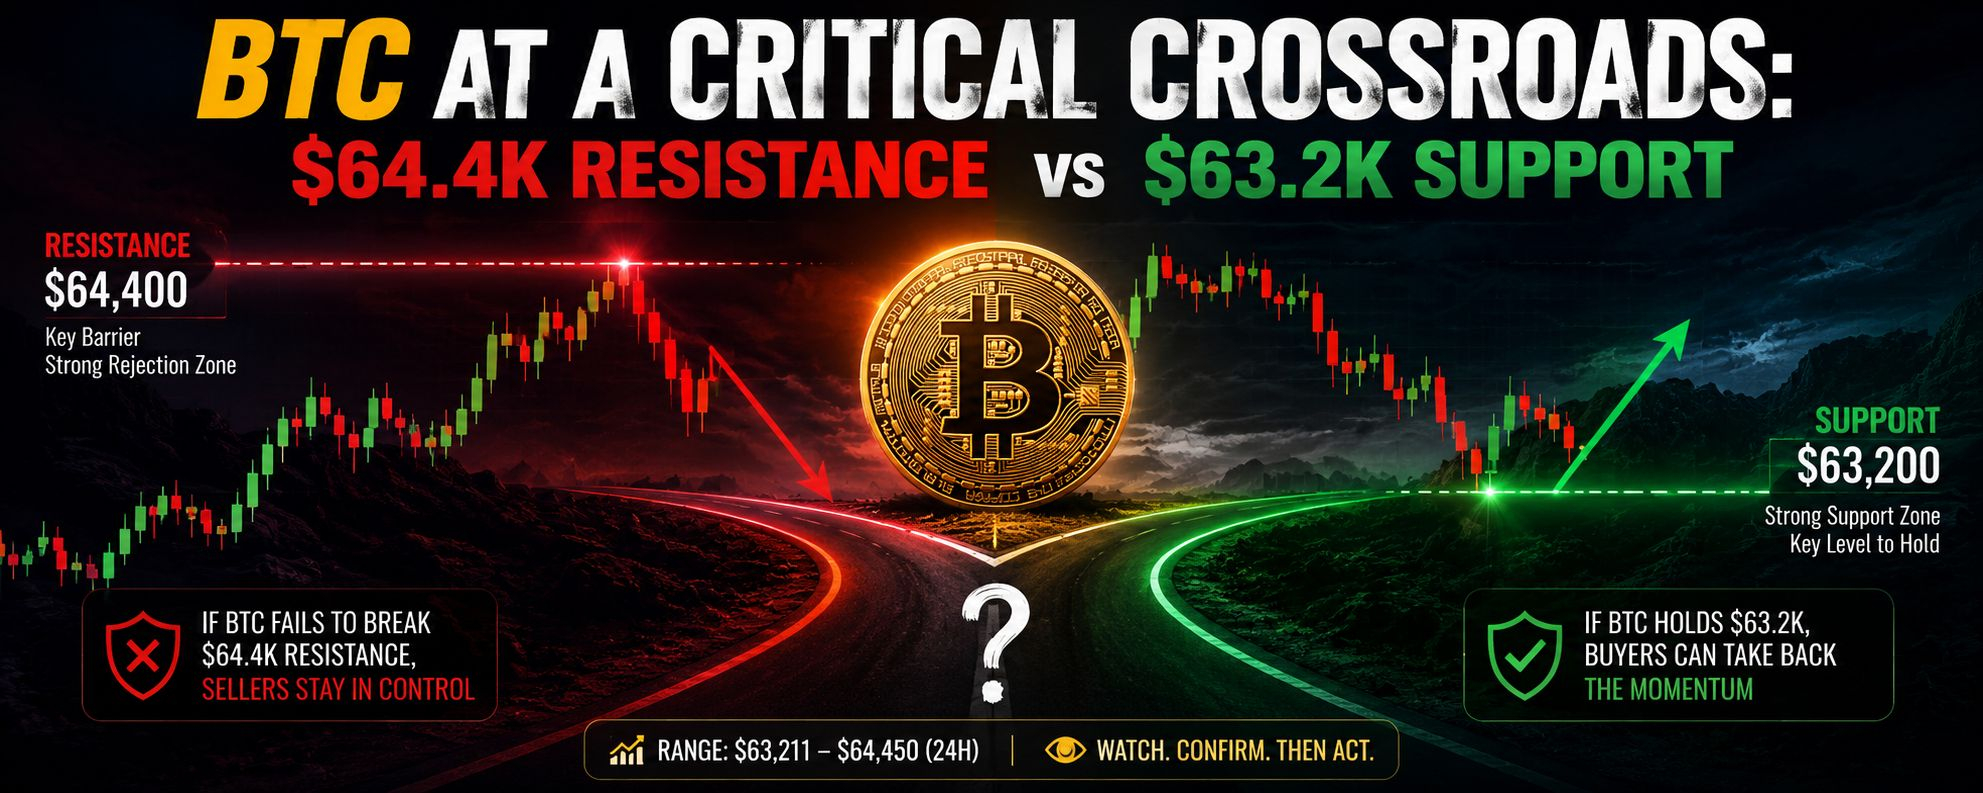

When I look at the current Bitcoin (BTC) chart, the first thing I notice is the sharp rejection from the $64,400 area. BTC initially showed strong momentum, moving from around $63,600 toward $64,400, but buyers failed to maintain control near the top of the move. After that rejection, I saw a strong series of selling candles that pushed the price back toward the $63,400 area.
For me, the $64,400–$64,450 zone is currently the most important resistance area on this 15-minute chart. Bitcoin tested this region but could not establish a sustained breakout above it. I would not consider a simple wick above resistance as a confirmed breakout. I want to see price hold above the level and show continued buying strength before calling it a genuine recovery.
On the other side, I’m closely watching the $63,200–$63,400 region. After the sharp decline, Bitcoin started consolidating around this area. I can see smaller candles forming, which tells me that the aggressive selling has temporarily slowed. However, I would still wait for confirmation because consolidation can eventually break in either direction.
According to the chart, Bitcoin’s 24-hour high is around $64,450, while the 24-hour low is near $63,211. I see this range as an important short-term battlefield between buyers and sellers. The closer BTC stays to the lower part of this range, the more important the $63,200 area becomes.
If I see Bitcoin reclaim $64,400 and hold above it, I would view that as a sign that buyers are becoming stronger again. But if I see BTC repeatedly rejected from that level, I would remain cautious about expecting an immediate bullish continuation.
At the same time, I’m paying close attention to what happens around $63,200. If sellers push Bitcoin below this level and price starts accepting below it, I would consider that a sign of increasing short-term weakness. A breakdown followed by a quick recovery, however, could tell a completely different story.
One thing I’ve learned from watching Bitcoin is that the first move after a sharp rejection is not always the final move. Markets can create fake breakouts, liquidity sweeps, and sudden reversals before choosing a clearer direction. That is why I prefer to watch confirmation instead of reacting emotionally to every candle.
Right now, I see Bitcoin in a decision zone rather than a confirmed trend. I’m watching how buyers react near support and how sellers behave near resistance. The reaction at these levels will tell me much more than a single green or red candle.
For me, the key levels are simple:
Resistance: $64,400–$64,450
Support: $63,200–$63,400
Current focus: Confirmation before the next major move
I’m not trying to predict every small movement. I’m watching the structure, the reaction at key levels, and whether Bitcoin can actually sustain a breakout or breakdown.
The big question I’m watching now is simple: Will BTC reclaim $64,400, or will sellers push it back toward the $63,200 support zone?
@Bitcoin #BTC #bitcoin #Binance #crypto
