BTC . このチャートをわかりやすくしよう
(デイトレードのセットアップ)
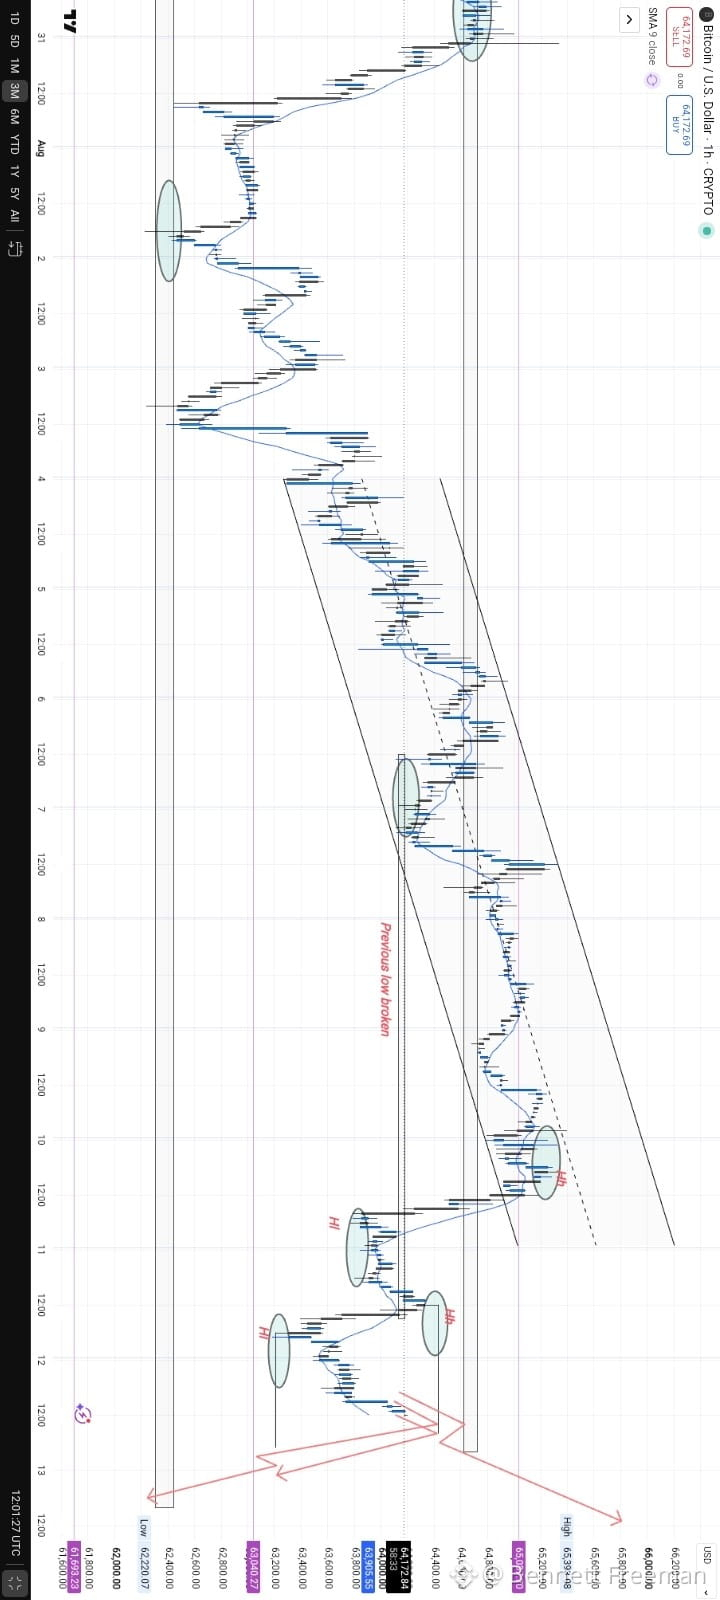
市場を階段だと思ってください。BTCは上昇トレンド・チャネルの中で、1段ずつ着実に上がっていました。高値は切り上げ、安値も切り上げ。
そして、重要なことが起きました。前の安値がブレイクされたのです。 ⛓️💥
それは、階段が崩れ始めているサインでした。
ブレイクダウン後、BTCは新しい構造を作り始めます:
安値切り下げ(Lower High)– 安値切り下げ(Lower Low)– 安値切り下げ(Lower High)– 安値切り下げ(Lower Low)
今のところ、価格は64,300〜64,500のあたりまで上に戻ろうとしています。
🟢 もしBTCがそのレジスタンスをブレイクして定着するなら、次に重要になり得るのは65,000〜65,400付近で、さらに上を目指す可能性があります。
🔴 しかし、64,300〜64,500あたりで価格が跳ね返される(リジェクトされる)なら、弱気の構造が続くかもしれません。63,400 → 63,000 → 62,200が重要な下方向のエリアになり得ます。
シンプルな学び:
価格が上がるか下がるかだけに注目しないでください。高値(HIGH)と安値(LOW)を見てください。
高値切り上げ + 安値切り上げ = 買い手が主導権を獲得 📈
安値切り下げ + 安値切り下げ = 売り手が主導権を獲得 📉
現時点では、私はこのようにセットアップを読み取っています。取引する前に必ず確認(コンファーム)を待ちましょう。
#bitcoin #MoneyGramExpandsCashCryptoServiceToSolana
#TechnicalAnalysiss
#TechnicalAnalysisCrypto
(デイトレードのセットアップ)
市場を階段だと思ってください。BTCは上昇トレンド・チャネルの中で、1段ずつ着実に上がっていました。高値は切り上げ、安値も切り上げ。
そして、重要なことが起きました。前の安値がブレイクされたのです。 ⛓️💥
それは、階段が崩れ始めているサインでした。
ブレイクダウン後、BTCは新しい構造を作り始めます:
安値切り下げ(Lower High)– 安値切り下げ(Lower Low)– 安値切り下げ(Lower High)– 安値切り下げ(Lower Low)
今のところ、価格は64,300〜64,500のあたりまで上に戻ろうとしています。
🟢 もしBTCがそのレジスタンスをブレイクして定着するなら、次に重要になり得るのは65,000〜65,400付近で、さらに上を目指す可能性があります。
🔴 しかし、64,300〜64,500あたりで価格が跳ね返される(リジェクトされる)なら、弱気の構造が続くかもしれません。63,400 → 63,000 → 62,200が重要な下方向のエリアになり得ます。
シンプルな学び:
価格が上がるか下がるかだけに注目しないでください。高値(HIGH)と安値(LOW)を見てください。
高値切り上げ + 安値切り上げ = 買い手が主導権を獲得 📈
安値切り下げ + 安値切り下げ = 売り手が主導権を獲得 📉
現時点では、私はこのようにセットアップを読み取っています。取引する前に必ず確認(コンファーム)を待ちましょう。
#bitcoin #MoneyGramExpandsCashCryptoServiceToSolana
#TechnicalAnalysiss
#TechnicalAnalysisCrypto