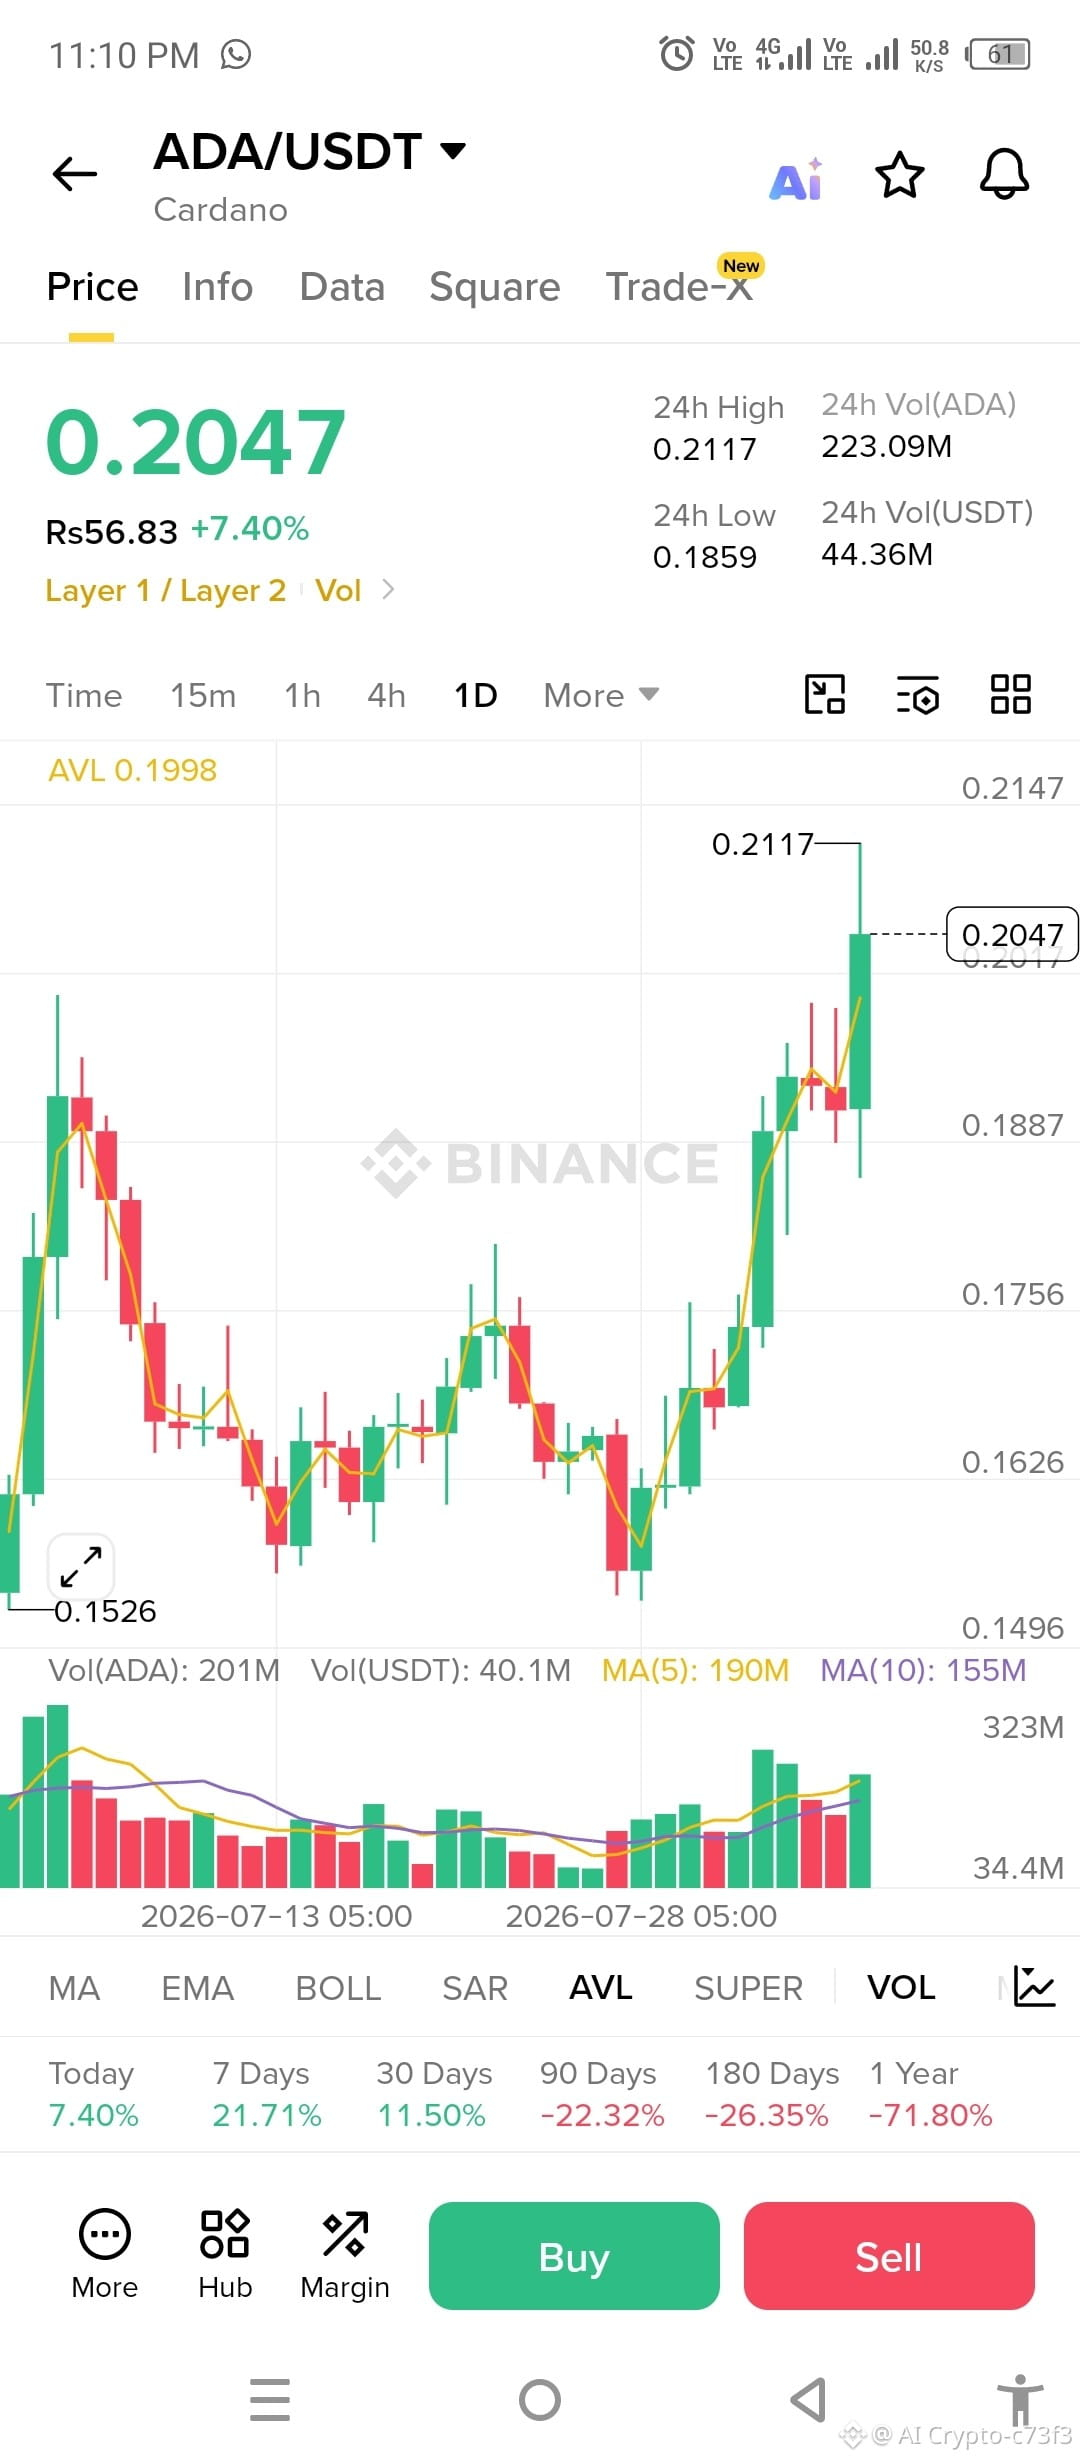
$ADA /USDTチャート分析(現物買い目的)
強気
強いブレイクアウト:ADAは約0.15から0.20へと動いており、複数の強い緑のローソク足が見られます。
高値の更新&安値の切り上げ:これは典型的な短期の上昇トレンドです。
出来高が多い:直近の緑のローソク足は相対的に出来高が強く、買い手が活発であることを示唆しています。
移動平均線より上の価格:これは一般的に、モメンタムがなお強気であることの良いサインです。
私が慎重になる理由
直近のレジスタンス付近:チャートには最近の高値が約0.2117に見えます。現在価格は0.2047なので、レジスタンスに近いです。
すでに出尽くし気味:急騰(およそ30%超)の後、大きな緑のローソク足の直後にすぐ買うと、押し戻し(調整)に巻き込まれる可能性があります。
利益確定のリスク:より安い価格で買ったトレーダーは、直前の高値付近で売るかもしれません。
現物の買い方(プラン)
オプション1(低リスク):
0.192〜0.198のあたりまで押し込むのを待ちます。
そこで価格が支えられ、買い手が戻ってきたなら、より良いリスク/リワードのエントリーになります。
オプション2(モメンタム買い):
日足チャートで、強い出来高を伴って0.212を上抜けて終値が確定するなら、ブレイクアウトが確認できます。
その場合、分割してポジションの一部を買うのは理にかなっています。
今すぐ買いたい場合
0.2047で全資金を投資するのではなく、以下を検討してください:
いま25〜40%を買う。
残りの資金は、価格が0.195〜0.190付近まで下がったら買うために残しておく。
サポートとレジスタンス
レジスタンス:0.212、その次に0.225〜0.235。
サポート:0.198、その次に0.188、そして0.175。
全体の見立て
短期では中程度に強気(およそ7.5/10)と評価します。トレンドは良好ですが、強い上昇の後で価格がレジスタンスへ近づいているため、私はどちらかを好みます:
今は小さめのポジションだけ買うか、
押し目を待つか、確認されたブレイクアウトまで待ってから、より多くの資本を投入するか。
注:自己調査(DYOR)
上記の分析は私自身の取り組みによるものです。これは投資助言ではありません。投資前に必ずご自身で調査してください。$ADA
強気
強いブレイクアウト:ADAは約0.15から0.20へと動いており、複数の強い緑のローソク足が見られます。
高値の更新&安値の切り上げ:これは典型的な短期の上昇トレンドです。
出来高が多い:直近の緑のローソク足は相対的に出来高が強く、買い手が活発であることを示唆しています。
移動平均線より上の価格:これは一般的に、モメンタムがなお強気であることの良いサインです。
私が慎重になる理由
直近のレジスタンス付近:チャートには最近の高値が約0.2117に見えます。現在価格は0.2047なので、レジスタンスに近いです。
すでに出尽くし気味:急騰(およそ30%超)の後、大きな緑のローソク足の直後にすぐ買うと、押し戻し(調整)に巻き込まれる可能性があります。
利益確定のリスク:より安い価格で買ったトレーダーは、直前の高値付近で売るかもしれません。
現物の買い方(プラン)
オプション1(低リスク):
0.192〜0.198のあたりまで押し込むのを待ちます。
そこで価格が支えられ、買い手が戻ってきたなら、より良いリスク/リワードのエントリーになります。
オプション2(モメンタム買い):
日足チャートで、強い出来高を伴って0.212を上抜けて終値が確定するなら、ブレイクアウトが確認できます。
その場合、分割してポジションの一部を買うのは理にかなっています。
今すぐ買いたい場合
0.2047で全資金を投資するのではなく、以下を検討してください:
いま25〜40%を買う。
残りの資金は、価格が0.195〜0.190付近まで下がったら買うために残しておく。
サポートとレジスタンス
レジスタンス:0.212、その次に0.225〜0.235。
サポート:0.198、その次に0.188、そして0.175。
全体の見立て
短期では中程度に強気(およそ7.5/10)と評価します。トレンドは良好ですが、強い上昇の後で価格がレジスタンスへ近づいているため、私はどちらかを好みます:
今は小さめのポジションだけ買うか、
押し目を待つか、確認されたブレイクアウトまで待ってから、より多くの資本を投入するか。
注:自己調査(DYOR)
上記の分析は私自身の取り組みによるものです。これは投資助言ではありません。投資前に必ずご自身で調査してください。$ADA