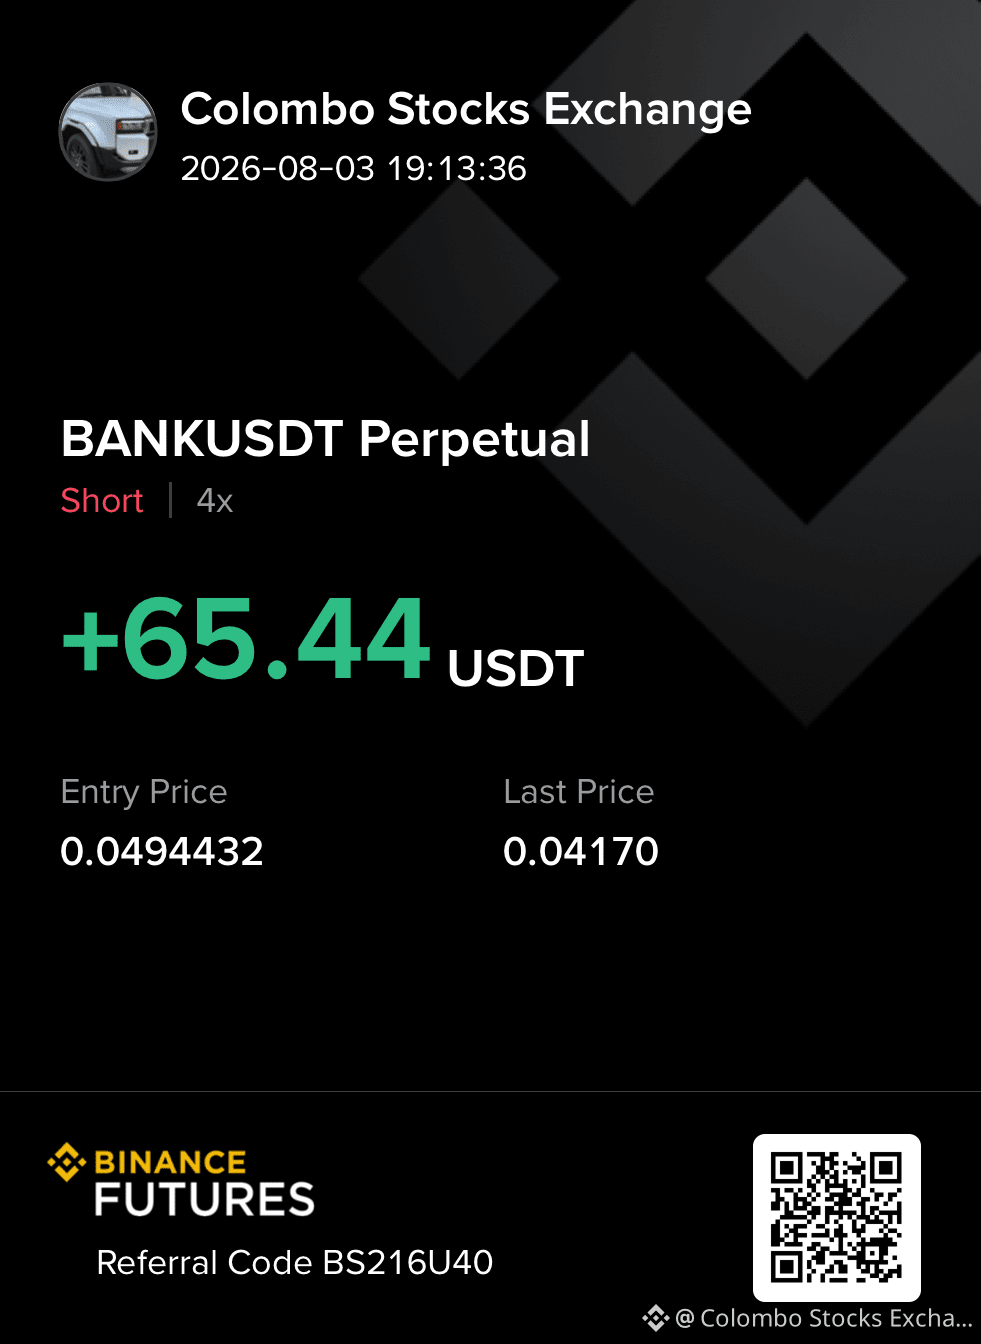
BANK/USDT target 0.029$BANK
Opening SHORT🤮🤮🤮
BANK/USDT Perpetual chart, the short-term trend is still bearish, although there are early signs that selling pressure is slowing.
Price Action
• Current price: 0.04187 USDT
• 24h low: 0.04118 USDT
• Price is trading very close to today’s low, which means buyers have not yet taken control.
• After the sharp drop from around 0.0465, the market has been making lower highs and lower lows, confirming a downtrend.
Indicators
1. Moving Averages (Bearish)
• MA(7): 0.04207
• MA(25): 0.04281
• MA(99): 0.04512
The price is below all three moving averages, which is generally bearish. The MA(25) and MA(99) may act as resistance if the price bounces.
2. Bollinger Bands
• Lower Band: 0.04159
• Middle Band: 0.04268
• Upper Band: 0.04377
Price is hugging the lower Bollinger Band, indicating strong selling pressure. Sometimes this also precedes a short-term bounce if buyers step in.
3. RSI
• RSI(6): 28.6 (oversold)
• RSI(12): 35.3
• RSI(24): 39.0
The short RSI is below 30, suggesting the market is oversold. This increases the chance of a relief rally, but it is not a buy signal by itself.
4. KDJ
• K has crossed slightly above D from an oversold area.
• This is an early bullish signal, but it needs confirmation from price moving above resistance.
Important Levels
Support
• 0.04118 (today’s low)
• If this breaks, the next area could be around 0.0405–0.0400.
Resistance
• 0.0422–0.0428 (first resistance)
• 0.0437–0.0440 (strong resistance)
Trading View
For Long positions
• Entering immediately is risky because the overall trend remains bearish.
• A safer confirmation would be a 15-minute candle closing above 0.0428 with increasing volume.
For Short positions
• Bears still have the advantage while the price stays below 0.0428.
• However, opening a new short after such a large drop carries the risk of a short-term bounce.
My Overall Outlook
• Short-term (next few hours): Slightly bearish,
•
Opening SHORT🤮🤮🤮
BANK/USDT Perpetual chart, the short-term trend is still bearish, although there are early signs that selling pressure is slowing.
Price Action
• Current price: 0.04187 USDT
• 24h low: 0.04118 USDT
• Price is trading very close to today’s low, which means buyers have not yet taken control.
• After the sharp drop from around 0.0465, the market has been making lower highs and lower lows, confirming a downtrend.
Indicators
1. Moving Averages (Bearish)
• MA(7): 0.04207
• MA(25): 0.04281
• MA(99): 0.04512
The price is below all three moving averages, which is generally bearish. The MA(25) and MA(99) may act as resistance if the price bounces.
2. Bollinger Bands
• Lower Band: 0.04159
• Middle Band: 0.04268
• Upper Band: 0.04377
Price is hugging the lower Bollinger Band, indicating strong selling pressure. Sometimes this also precedes a short-term bounce if buyers step in.
3. RSI
• RSI(6): 28.6 (oversold)
• RSI(12): 35.3
• RSI(24): 39.0
The short RSI is below 30, suggesting the market is oversold. This increases the chance of a relief rally, but it is not a buy signal by itself.
4. KDJ
• K has crossed slightly above D from an oversold area.
• This is an early bullish signal, but it needs confirmation from price moving above resistance.
Important Levels
Support
• 0.04118 (today’s low)
• If this breaks, the next area could be around 0.0405–0.0400.
Resistance
• 0.0422–0.0428 (first resistance)
• 0.0437–0.0440 (strong resistance)
Trading View
For Long positions
• Entering immediately is risky because the overall trend remains bearish.
• A safer confirmation would be a 15-minute candle closing above 0.0428 with increasing volume.
For Short positions
• Bears still have the advantage while the price stays below 0.0428.
• However, opening a new short after such a large drop carries the risk of a short-term bounce.
My Overall Outlook
• Short-term (next few hours): Slightly bearish,
•