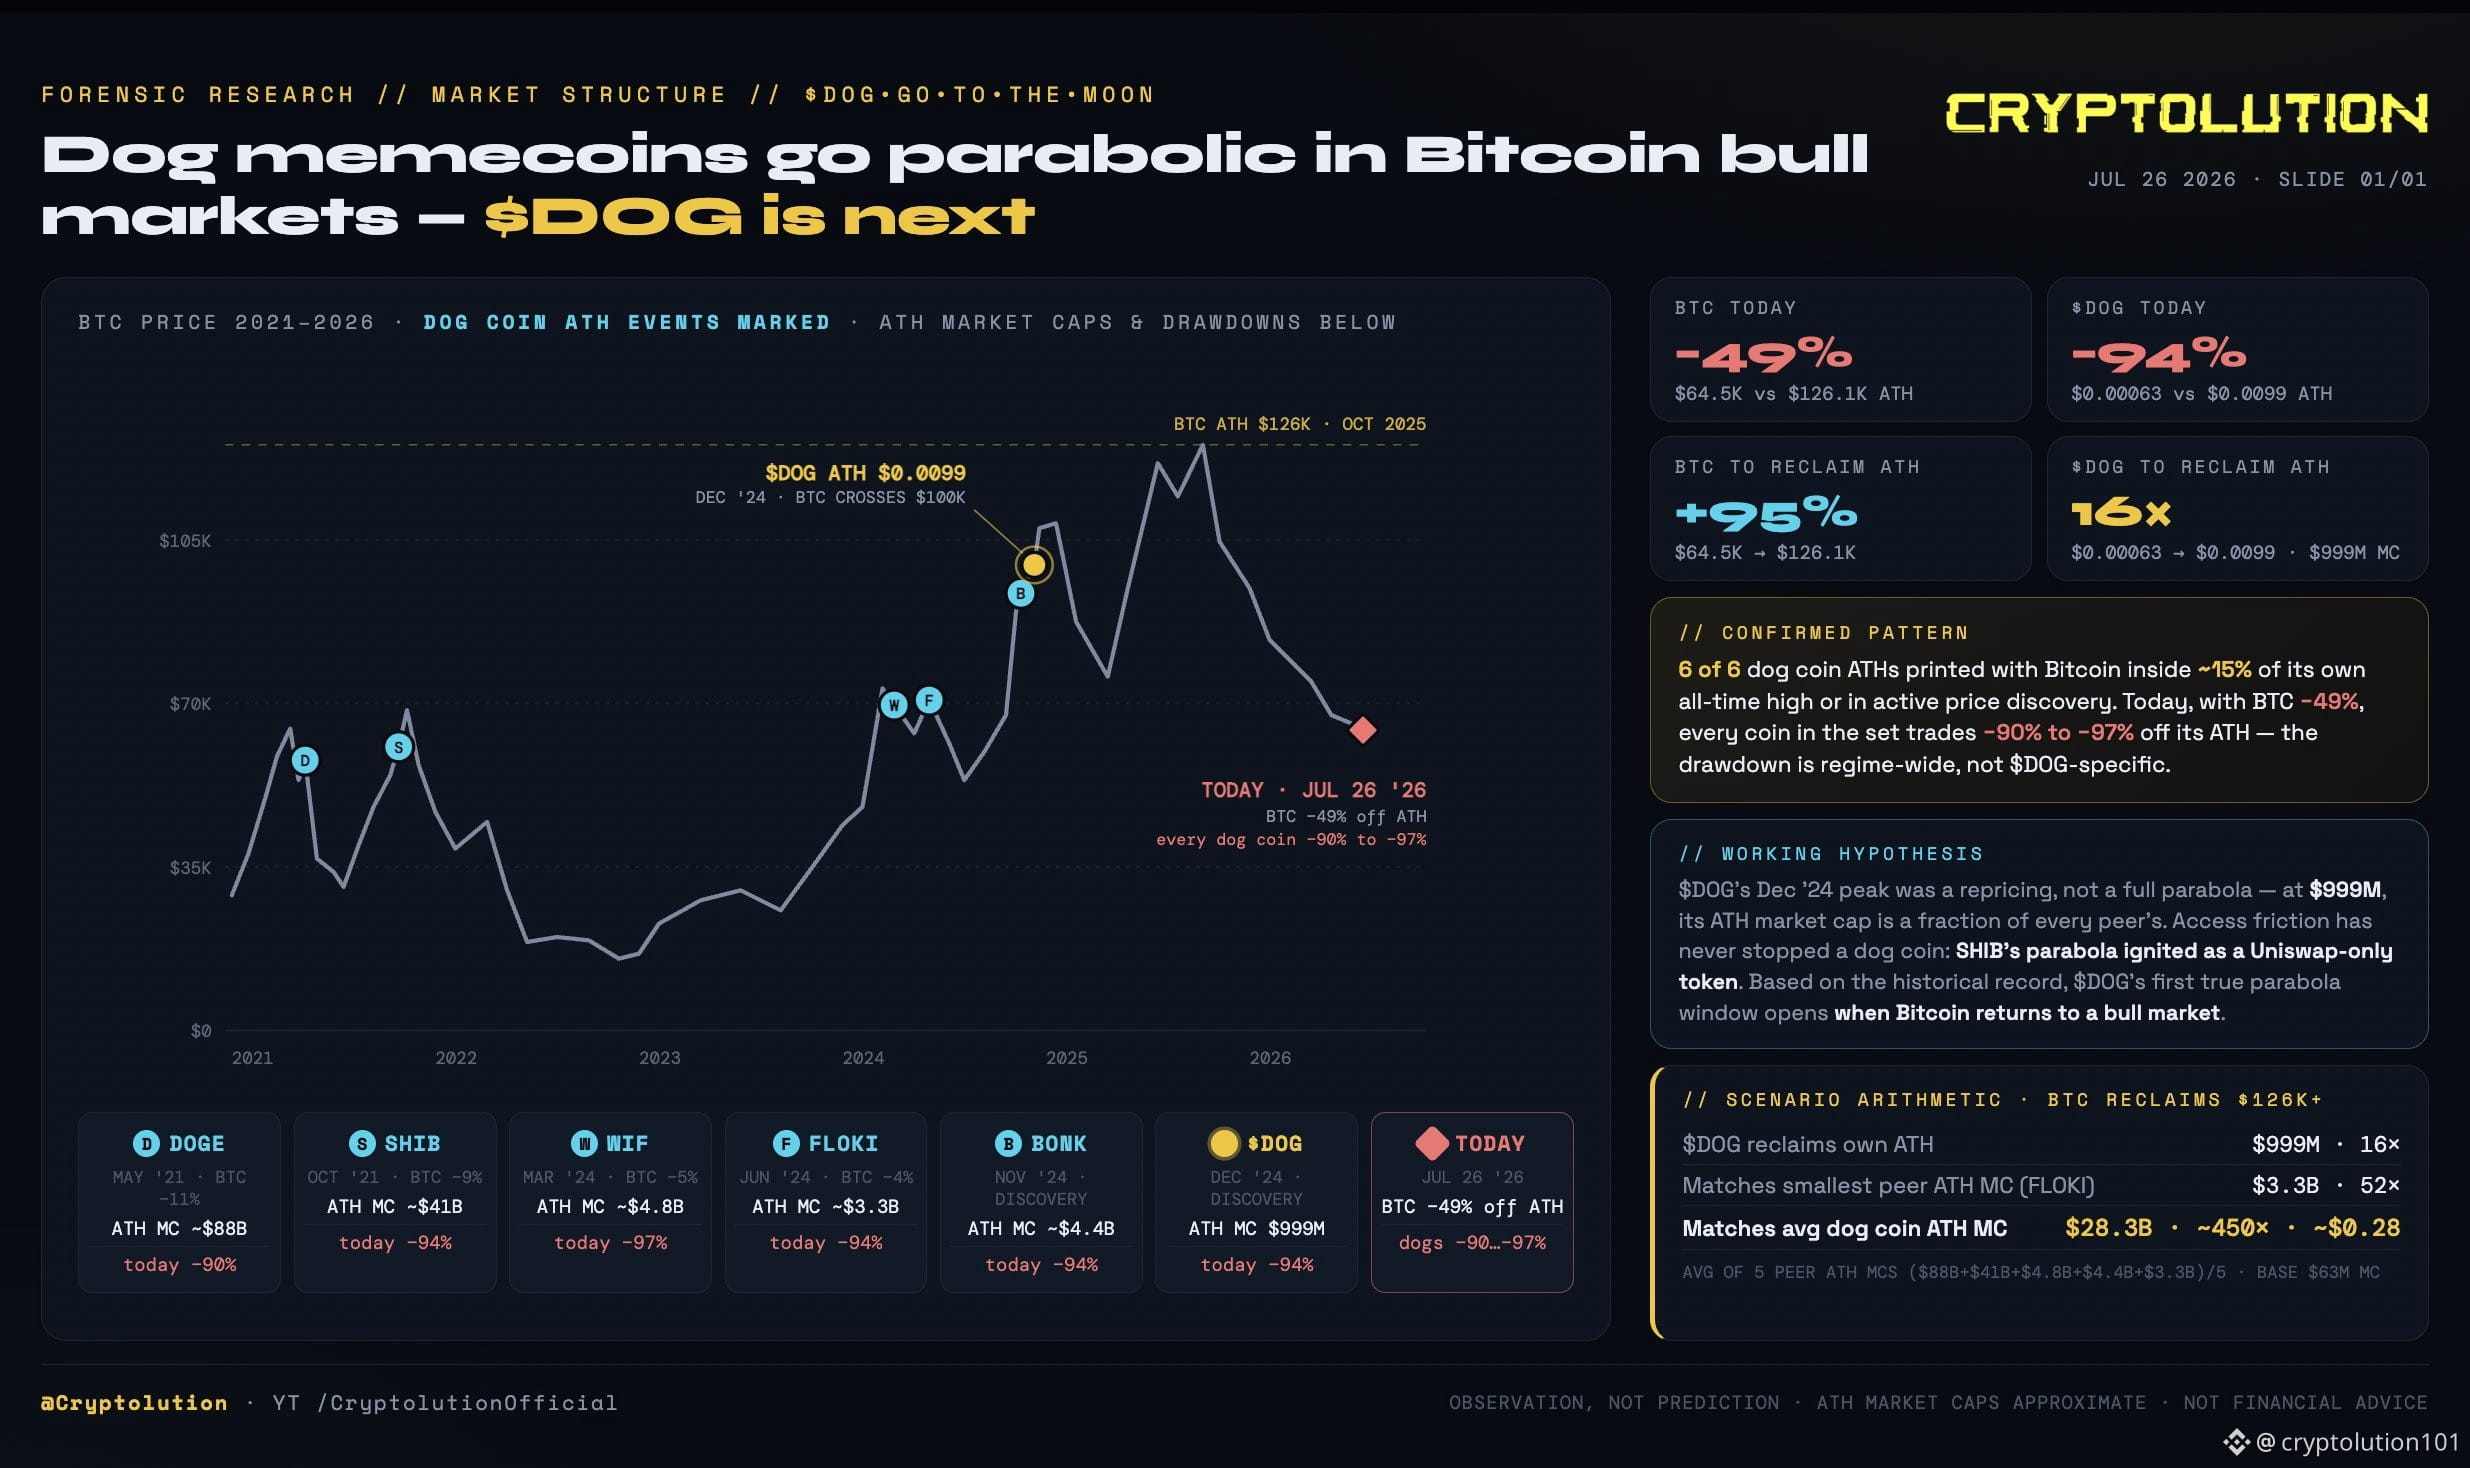
歴史上のすべてのドッグ・コインのパラボラは、同じ条件下で発射された。私は、BTC(ビットコイン)の価格に対してATH(史上最高値)6回のイベントをすべてマッピングした。 DOGE - 2021年5月 · BTC −ATHから−11% · 時価総額ピーク 約88B SHIB - 2021年10月 · BTC −ATHから−9% · 時価総額ピーク 約41B WIF - 2024年3月 · BTC −ATHから−5% · 時価総額ピーク 4.8B FLOKI - 2024年6月 · BTC −ATHから−4% · 時価総額ピーク 3.3B BONK - 2024年11月 · 価格発見フェーズ · 時価総額ピーク 4.4B $DOG - 2024年12月 · BTCが をまたぐ · 時価総額 999M 6/6は、自身のATHの約15%以内、あるいはアクティブな価格発見フェーズの間に発生した。 0/6は、BTCが大きく下落(ドローダウン)している最中に発生した。 今日? BTCは$126Kから−49%。そして、すべてのドッグ・コインもそれに連れて下落している:DOGE −90%、SHIB −94%、FLOKI −94%、BONK −94%、$DOG −94%、WIF −97%。 この下落はレジーム全体に及ぶ。ドッグ固有ではない。$DOGの−94%は、文字どおり同業者(ピア)の中央値だ。 次に計算: → $DOG が自身のATHを回復:$999M · 16× → $DOG が最小のピアATH時価総額に一致:$3.3B · 52× → $DOG がドッグ・コインATHの平均時価総額に一致:$28.3B · 約450× · 約$0.28 そして、チャートが明白に示しているのはここ:$DOG の2024年12月のピークはパラボラではなかった。DOGEとSHIBは、それぞれのピークに向けて100倍超で突っ走った。$DOGの$999Mピークは、すべてのピアのほんの一部にすぎない。最初の“本当のパラボラ”イベントは、まだ起きていない。 それ以前に登場したすべてのドッグ・コインは、ビットコインが強気相場(ブルマーケット)に入ったときに、そのパラボラを1回は得た。 だから問題はパターンが存在するかどうかではない。次にレジームが反転したとき、−94%のベースから何が起きるのか? 今こそ $DOG を蓄積する時間だ。 予測ではなく観察。 すべての数値は公開市場データによる。

投稿