$DYDX
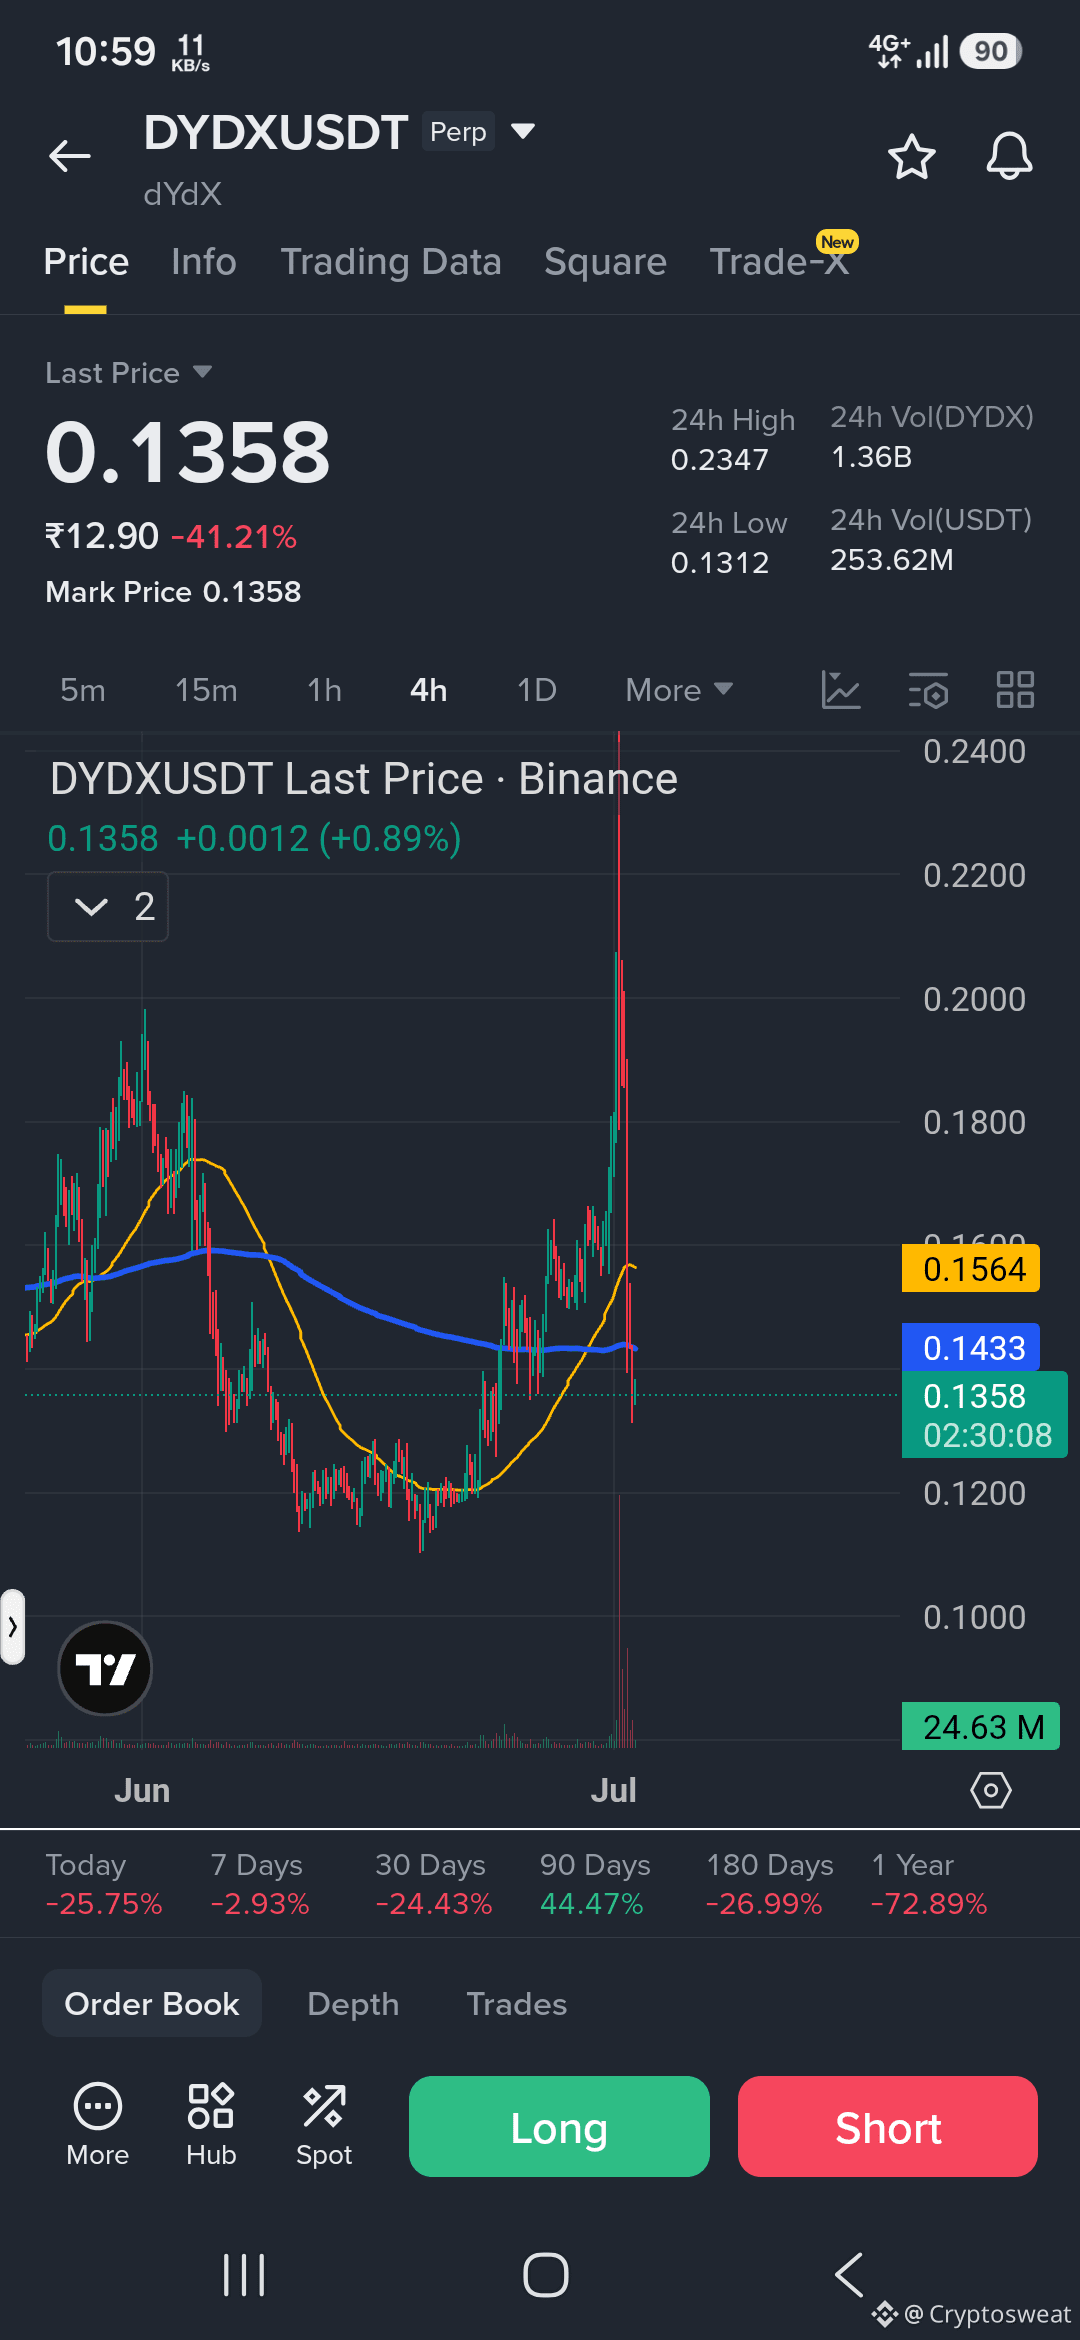
Based on the DYDXUSDT perpetual 4-hour chart provided, the price is currently experiencing high volatility following a massive spike up to a 24-hour high of 0.2347, followed by a sharp retracement back down to 0.1361 (a decline of over 41%).Technical BreakdownCurrent Price Action: The massive red candlestick demonstrates an aggressive liquidity grab and rejection at higher levels. The asset has completely erased its recent intraday gains, demonstrating strong overhead selling pressure.Moving Averages: The price has plunged violently straight through the short-term moving averages (yellow and blue lines) and is resting immediately on top of them.Key Levels to Watch:Resistance: 0.1564 (recent local consolidation flip) and 0.1433.Support: 0.1312 (24-hour low and immediate critical defense line) and 0.1000 (psychological floor).Suggested Scenarios & Trade Action PlansBecause trading immediately after a massive, high-volume crash carries extreme risk, the safest move is to wait for the current 4-hour candle to close and confirm stability. Here are the two primary setups to watch:1. The Short Strategy (Trend Continuation)If the price breaks below the 24-hour low, it confirms that the bearish momentum is continuing.Trigger: Wait for a clean 4-hour candle close below 0.1312.Target (Take Profit): Move toward the 0.1050 – 0.1000 range.Risk Management (Stop Loss): Set a strict stop loss just above 0.1435.