
Current Price: $77.19
Timeframes Analyzed: 1H, 4H & 1D
Exchange: Binance Spot
Market Overview
Solana has staged an impressive recovery from its recent low near $60, climbing more than 28% in just a few weeks. The rally has shifted market sentiment from bearish to cautiously bullish, with buyers regaining control across the lower timeframes while the daily chart shows signs of a larger trend reversal.
The current challenge for bulls is breaking through the strong resistance zone around $79–80.
1-Hour Chart Analysis
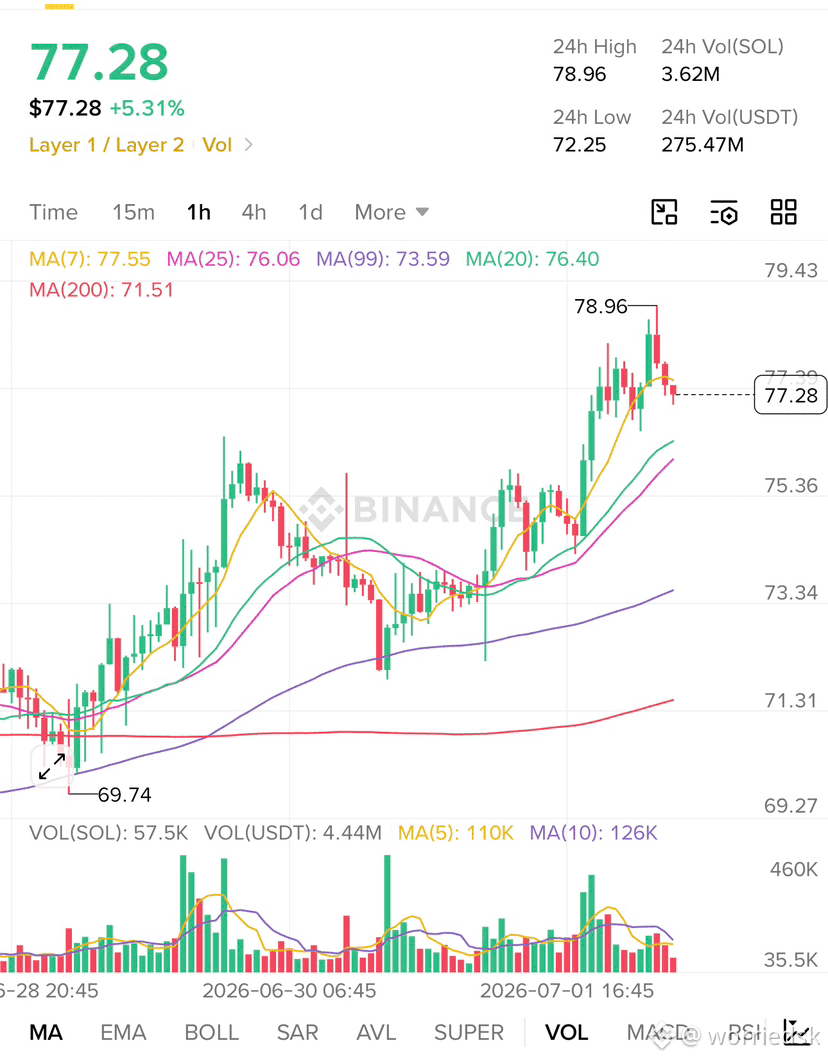
The 1-hour chart remains firmly bullish despite a small pullback after reaching $78.96.
Bullish Signals
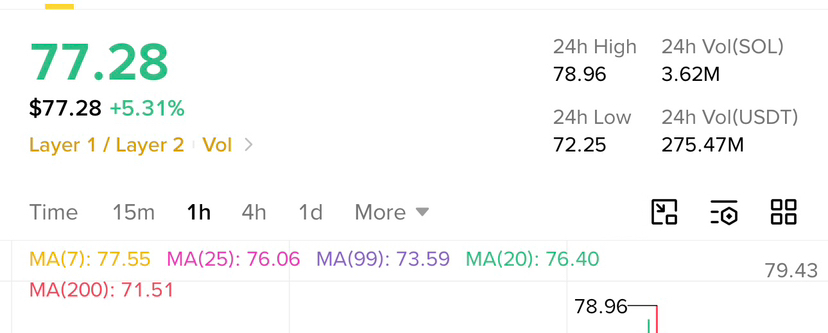
* Price remains above the 20, 25, 99 and 200 moving averages.
* Moving averages are aligned in bullish order.
* Pullback volume is decreasing, suggesting sellers lack conviction.
* No major bearish reversal pattern has formed.
The rejection from $78.96 appears to be profit-taking rather than the start of a larger correction.
Key Levels
Resistance
* $78.90–79.00
* $80.00
Support
* $76.40
* $75.80
* $73.60
As long as SOL holds above $76, the short-term trend remains positive.
4-Hour Chart Analysis
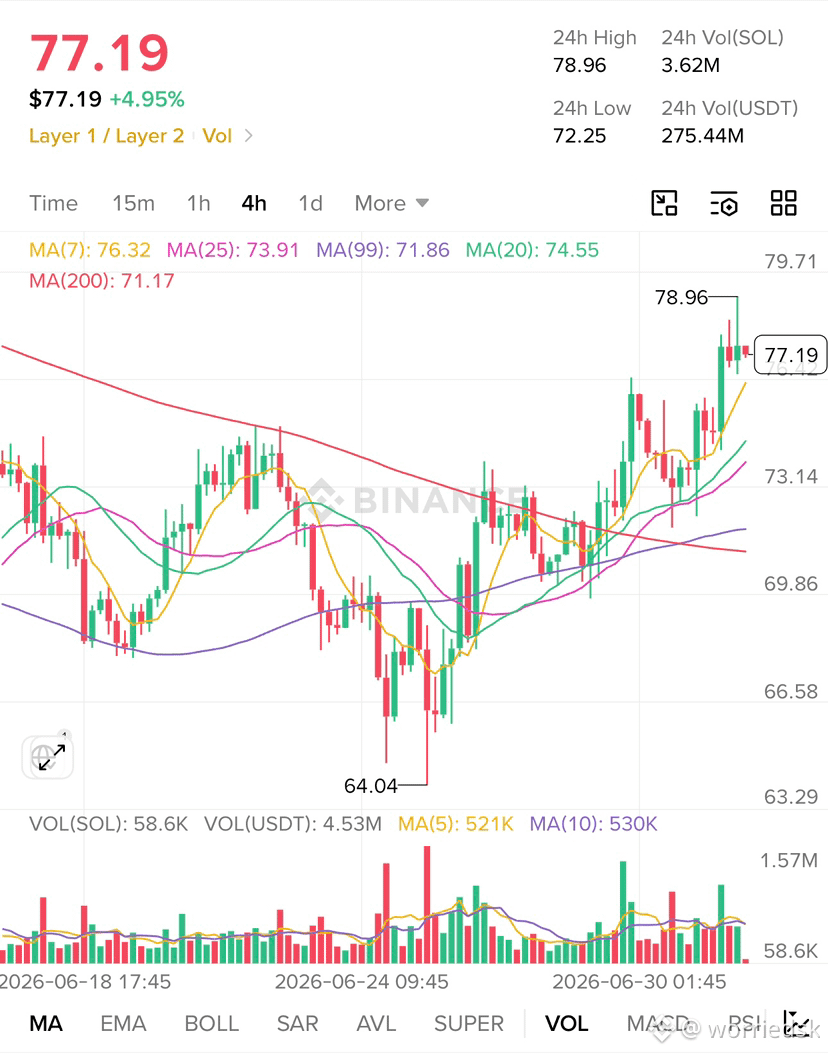
The 4-hour chart provides the strongest bullish evidence.
Several important developments have occurred:
* Price has reclaimed the 200 MA, which often acts as a major trend filter.
* The 7 MA has crossed above the 20 and 25 MA.
* Higher highs and higher lows are developing.
* Volume increased during the breakout.
This suggests institutional buyers may be accumulating positions.
However, SOL is now approaching an important resistance zone that rejected price previously.
Resistance
* $79
* $81
* $84
A clean 4-hour close above $79 would significantly strengthen the bullish case.
Daily Chart Analysis
The daily chart is still in recovery mode.
While the shorter moving averages (7, 20 and 25) have turned bullish, price remains below:
* Daily MA99 (~$80.6)
* Daily MA200 (~$94)
These longer-term moving averages continue to represent major resistance.
Nevertheless, Solana has successfully:
* Formed a higher low around $60
* Broken its short-term downtrend
* Crossed above the 20-day moving average
* Reclaimed the 25-day moving average
These are encouraging early signs that the broader trend may be shifting.
Bullish Scenario
If buyers push SOL above $79 with strong volume:
Targets
* $80.60 (Daily MA99)
* $83
* $86
* $90
* $94 (Daily MA200)
Breaking above the daily MA99 would likely attract additional momentum traders.
Bearish Scenario
Failure to break $79 could lead to a healthy pullback.
Important support levels include:
* $76
* $74.50
* $72
* $70
As long as SOL remains above the $72–73 region, the broader bullish structure would remain intact.
Volume Analysis
Volume expanded during the recent rally, confirming genuine buying interest.
The current consolidation is occurring on lighter volume, which is generally considered constructive. Ideally, bulls would like to see another surge in volume accompanying a breakout above $79.
Trading Outlook
Short-Term (1–3 Days)
Neutral to bullish. Expect consolidation between $76 and $79, followed by another breakout attempt.
Medium-Term (1–3 Weeks)
Bullish if SOL closes above $80.60 on the daily chart.
Long-Term
The daily trend will turn significantly stronger if price breaks above the 200-day moving average near $94.
Probability Assessment
Scenario Probability
Consolidation between $76–79 45%
Breakout above $79 toward $80–83 35%
Pullback to $74–75 before continuing higher 20%
Final Verdict
The technical picture across the 1-hour, 4-hour, and daily charts suggests that Solana is in a healthy recovery phase. Short-term momentum favors the bulls, supported by bullish moving-average alignment and improving market structure. The $79–80.60 area is the next major hurdle; a decisive break above it could open the door to $83–90. Until then, traders should expect some consolidation or minor pullbacks as the market digests recent gains.