🔭$LUNC 🔥📈0.01
グラフ📈は、燃焼量🔥と$LUNC の価格の関係を、10億ドルの固定市場キャップで示しています。燃焼量が増えるほど、価格は著しく上昇し、📍 3兆、📍 5兆、📍 5.9兆のLuncが燃焼される重要なポイントがあります。
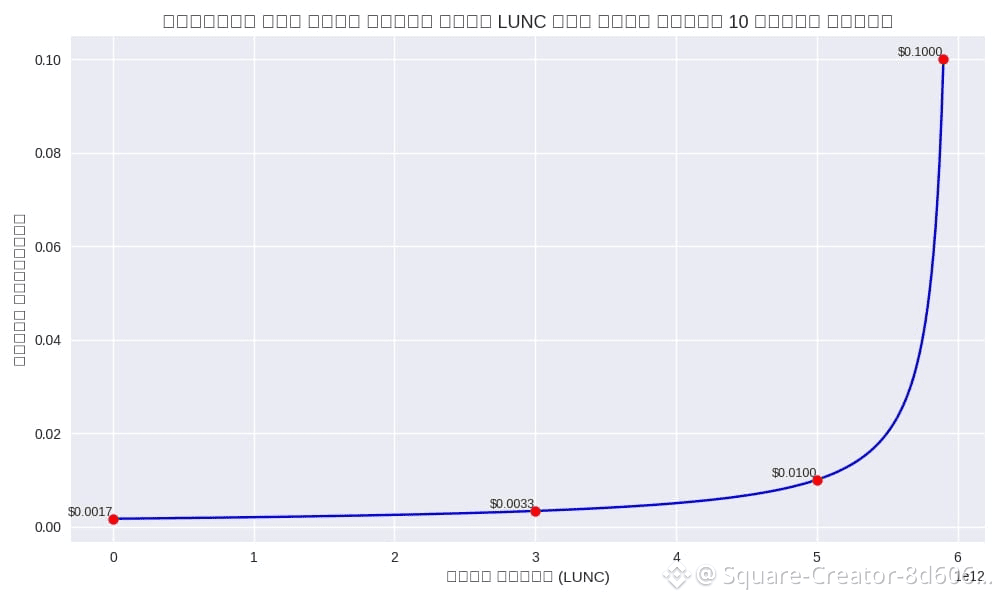
The chart 📈 shows the relationship between the burn amount 🔥 and the $lunc price at a fixed market cap of 10 billion dollars. The more tokens burned, the higher the price rises significantly, with key points at 📍 3 trillion, 📍 5 trillion, and 📍 5.9 trillion $LUNC burned.
🔎 グラフの読み方
- 燃焼がない場合 (0): 価格は非常に低いまま🌡️($0.0001未満)。
- 🔥 3兆が燃焼した場合: 価格は📤 約$0.0033に上昇します。
- 🔥 5兆が燃焼した場合: 価格は📤 $0.01に達します。
- 🔥 5.9兆が燃焼した場合: 価格は📤 $0.1に近づきます。
🔎 Reading the chart
- With no burn (0): the price remains very low 🌡️ (less than $0.0001).
- At 🔥 3 trillion burned: the price rises 📤 to about $0.0033.
- At 🔥 5 trillion burned: the price reaches 📤 $0.01.
- At 🔥 5.9 trillion burned: the price approaches 📤 $0.1.
🧩 まとめ
- $0.1に到達するには、供給量を約1000億LUNC$に減少させる必要があり、つまり🔥 5.9兆の燃焼が必要です。
- グラフ📈は明確に逆相関関係を示しています⛓️:
燃焼によって供給量が減るほど、同じ市場キャップを達成するために必要な価格は高くなります。
🧩 Conclusion
- To reach $0.1, the supply must drop to around 100 billion LUNC$, meaning a burn 🔥 of about 5.9 trillion.
- The chart 📈 clearly shows the inverse relationship ⛓️:
The lower the supply through burning the higher the price needed to achieve the same market cap.
グラフ📈は、燃焼量🔥と$LUNC の価格の関係を、10億ドルの固定市場キャップで示しています。燃焼量が増えるほど、価格は著しく上昇し、📍 3兆、📍 5兆、📍 5.9兆のLuncが燃焼される重要なポイントがあります。
The chart 📈 shows the relationship between the burn amount 🔥 and the $lunc price at a fixed market cap of 10 billion dollars. The more tokens burned, the higher the price rises significantly, with key points at 📍 3 trillion, 📍 5 trillion, and 📍 5.9 trillion $LUNC burned.
🔎 グラフの読み方
- 燃焼がない場合 (0): 価格は非常に低いまま🌡️($0.0001未満)。
- 🔥 3兆が燃焼した場合: 価格は📤 約$0.0033に上昇します。
- 🔥 5兆が燃焼した場合: 価格は📤 $0.01に達します。
- 🔥 5.9兆が燃焼した場合: 価格は📤 $0.1に近づきます。
🔎 Reading the chart
- With no burn (0): the price remains very low 🌡️ (less than $0.0001).
- At 🔥 3 trillion burned: the price rises 📤 to about $0.0033.
- At 🔥 5 trillion burned: the price reaches 📤 $0.01.
- At 🔥 5.9 trillion burned: the price approaches 📤 $0.1.
🧩 まとめ
- $0.1に到達するには、供給量を約1000億LUNC$に減少させる必要があり、つまり🔥 5.9兆の燃焼が必要です。
- グラフ📈は明確に逆相関関係を示しています⛓️:
燃焼によって供給量が減るほど、同じ市場キャップを達成するために必要な価格は高くなります。
🧩 Conclusion
- To reach $0.1, the supply must drop to around 100 billion LUNC$, meaning a burn 🔥 of about 5.9 trillion.
- The chart 📈 clearly shows the inverse relationship ⛓️:
The lower the supply through burning the higher the price needed to achieve the same market cap.