Bt$BTC
Based on the technical analysis indicators in the image, here's an assessment of Bitcoin's (BTC) potential next move:
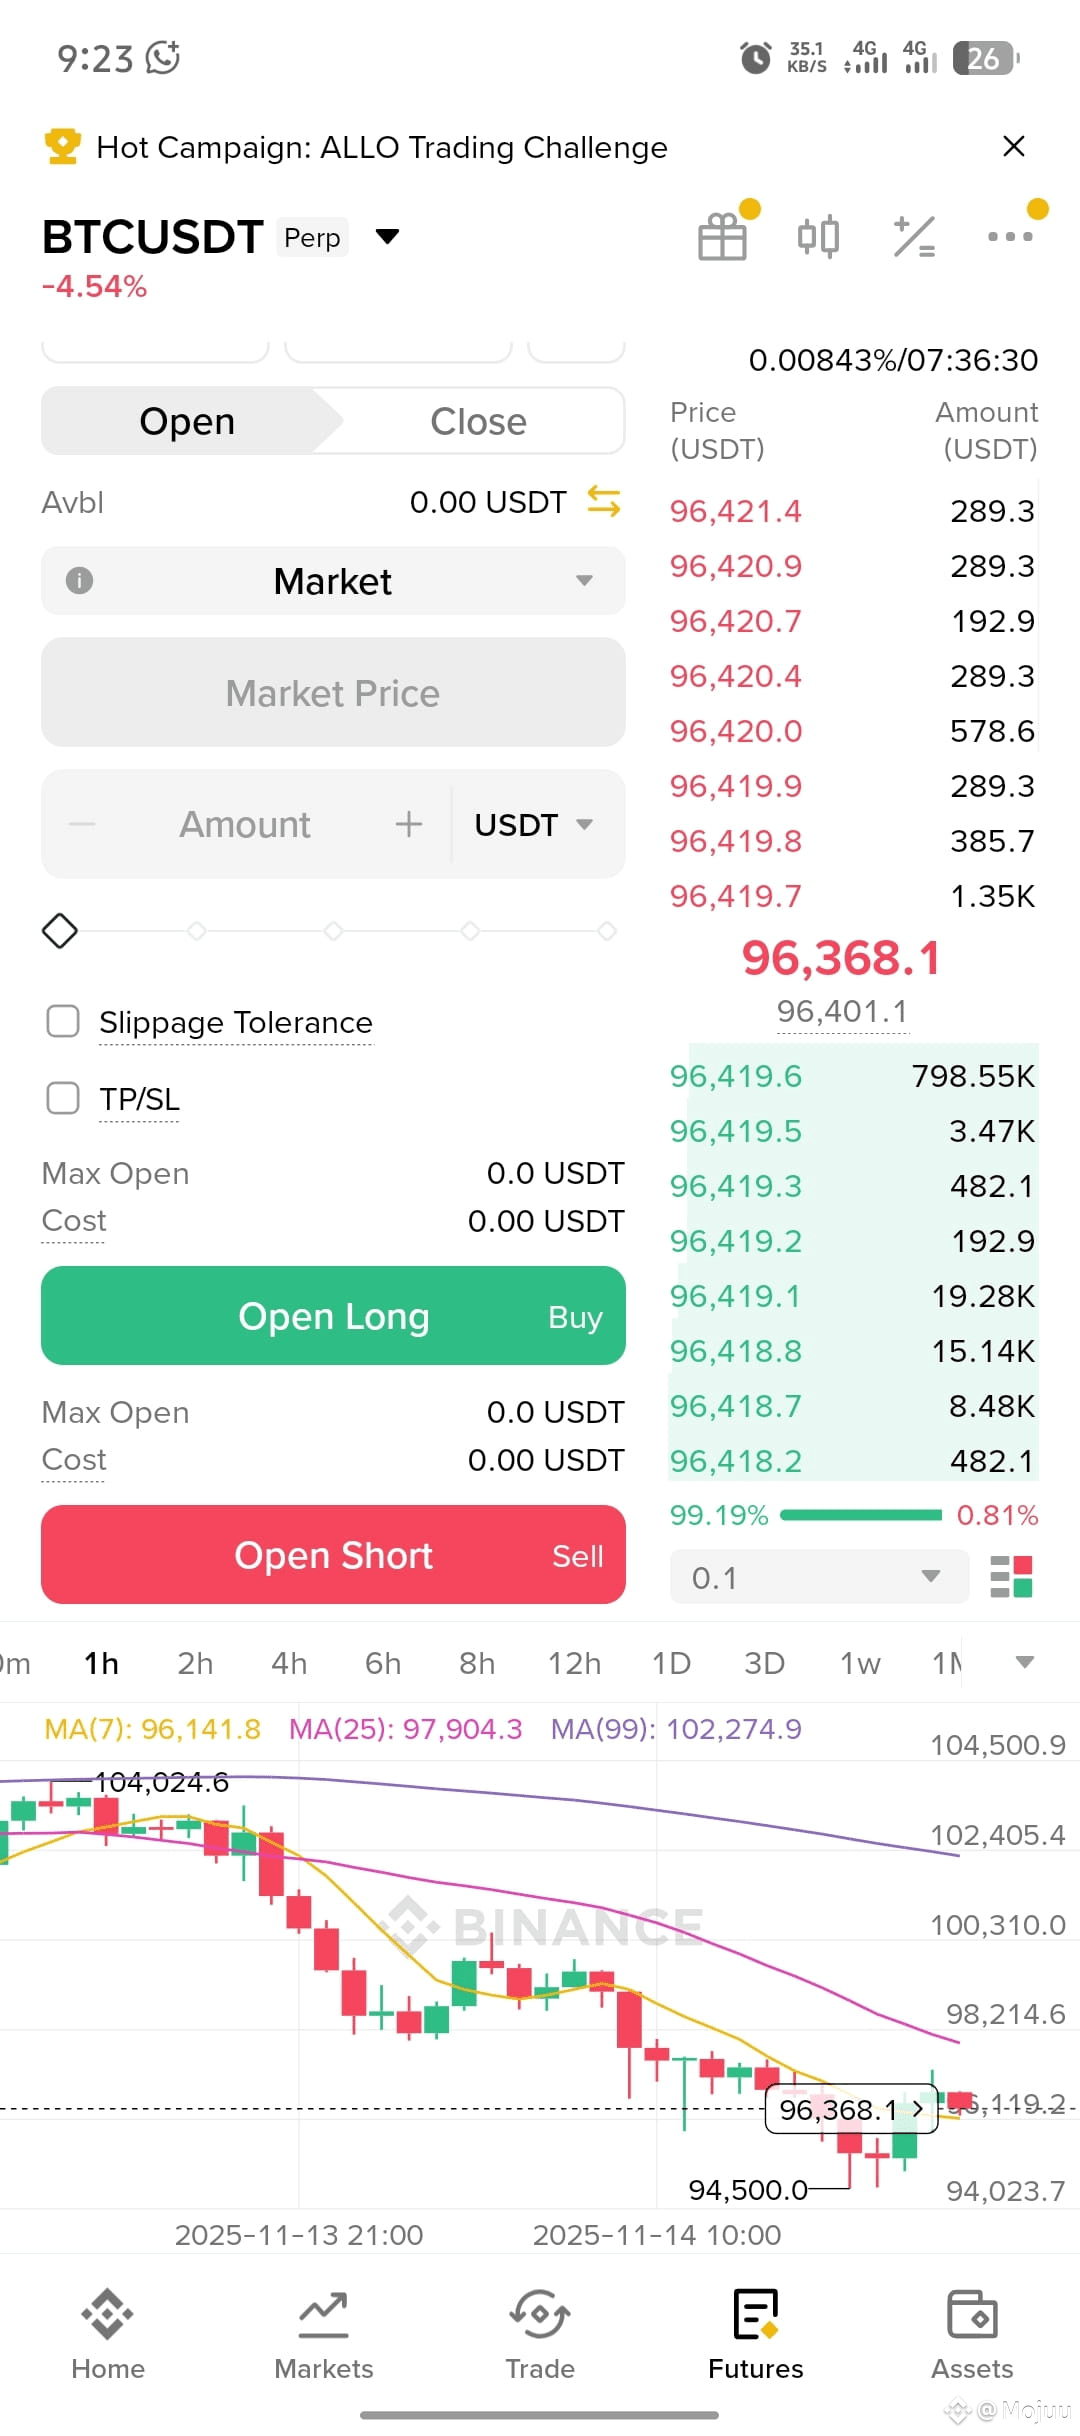
Current Price: 96,368.1 USDT
Moving Averages (MA):
MA(7): 96,141.8
MA(25): 97,904.3
MA(99): 102,274.9
The 7-day moving average is below the 25-day moving average, which is below the 99-day moving average. This suggests a downtrend in the short to medium term.
Price Chart: The price chart shows recent price action with red (bearish) and green (bullish) candles. The price is currently below the 25-day and 99-day moving averages, reinforcing the bearish sentiment.
Trading Options: The interface shows options to "Open Long" (Buy) or "Open Short" (Sell), indicating that traders can speculate on both upward and downward price movements.
Potential Next Move:
Given the current technical indicators, the next move for BTC could be a continuation of the downtrend. However, it's important to note that the price is currently hovering around the 7-day moving average, which could act as a support level.
Disclaimer: This is just an analysis based on the limited information available in the image and should not be taken as financial advice. Trading cryptocurrencies involves significant risk, and you should always do your own research before making any investment decisions.
Based on the technical analysis indicators in the image, here's an assessment of Bitcoin's (BTC) potential next move:
Current Price: 96,368.1 USDT
Moving Averages (MA):
MA(7): 96,141.8
MA(25): 97,904.3
MA(99): 102,274.9
The 7-day moving average is below the 25-day moving average, which is below the 99-day moving average. This suggests a downtrend in the short to medium term.
Price Chart: The price chart shows recent price action with red (bearish) and green (bullish) candles. The price is currently below the 25-day and 99-day moving averages, reinforcing the bearish sentiment.
Trading Options: The interface shows options to "Open Long" (Buy) or "Open Short" (Sell), indicating that traders can speculate on both upward and downward price movements.
Potential Next Move:
Given the current technical indicators, the next move for BTC could be a continuation of the downtrend. However, it's important to note that the price is currently hovering around the 7-day moving average, which could act as a support level.
Disclaimer: This is just an analysis based on the limited information available in the image and should not be taken as financial advice. Trading cryptocurrencies involves significant risk, and you should always do your own research before making any investment decisions.