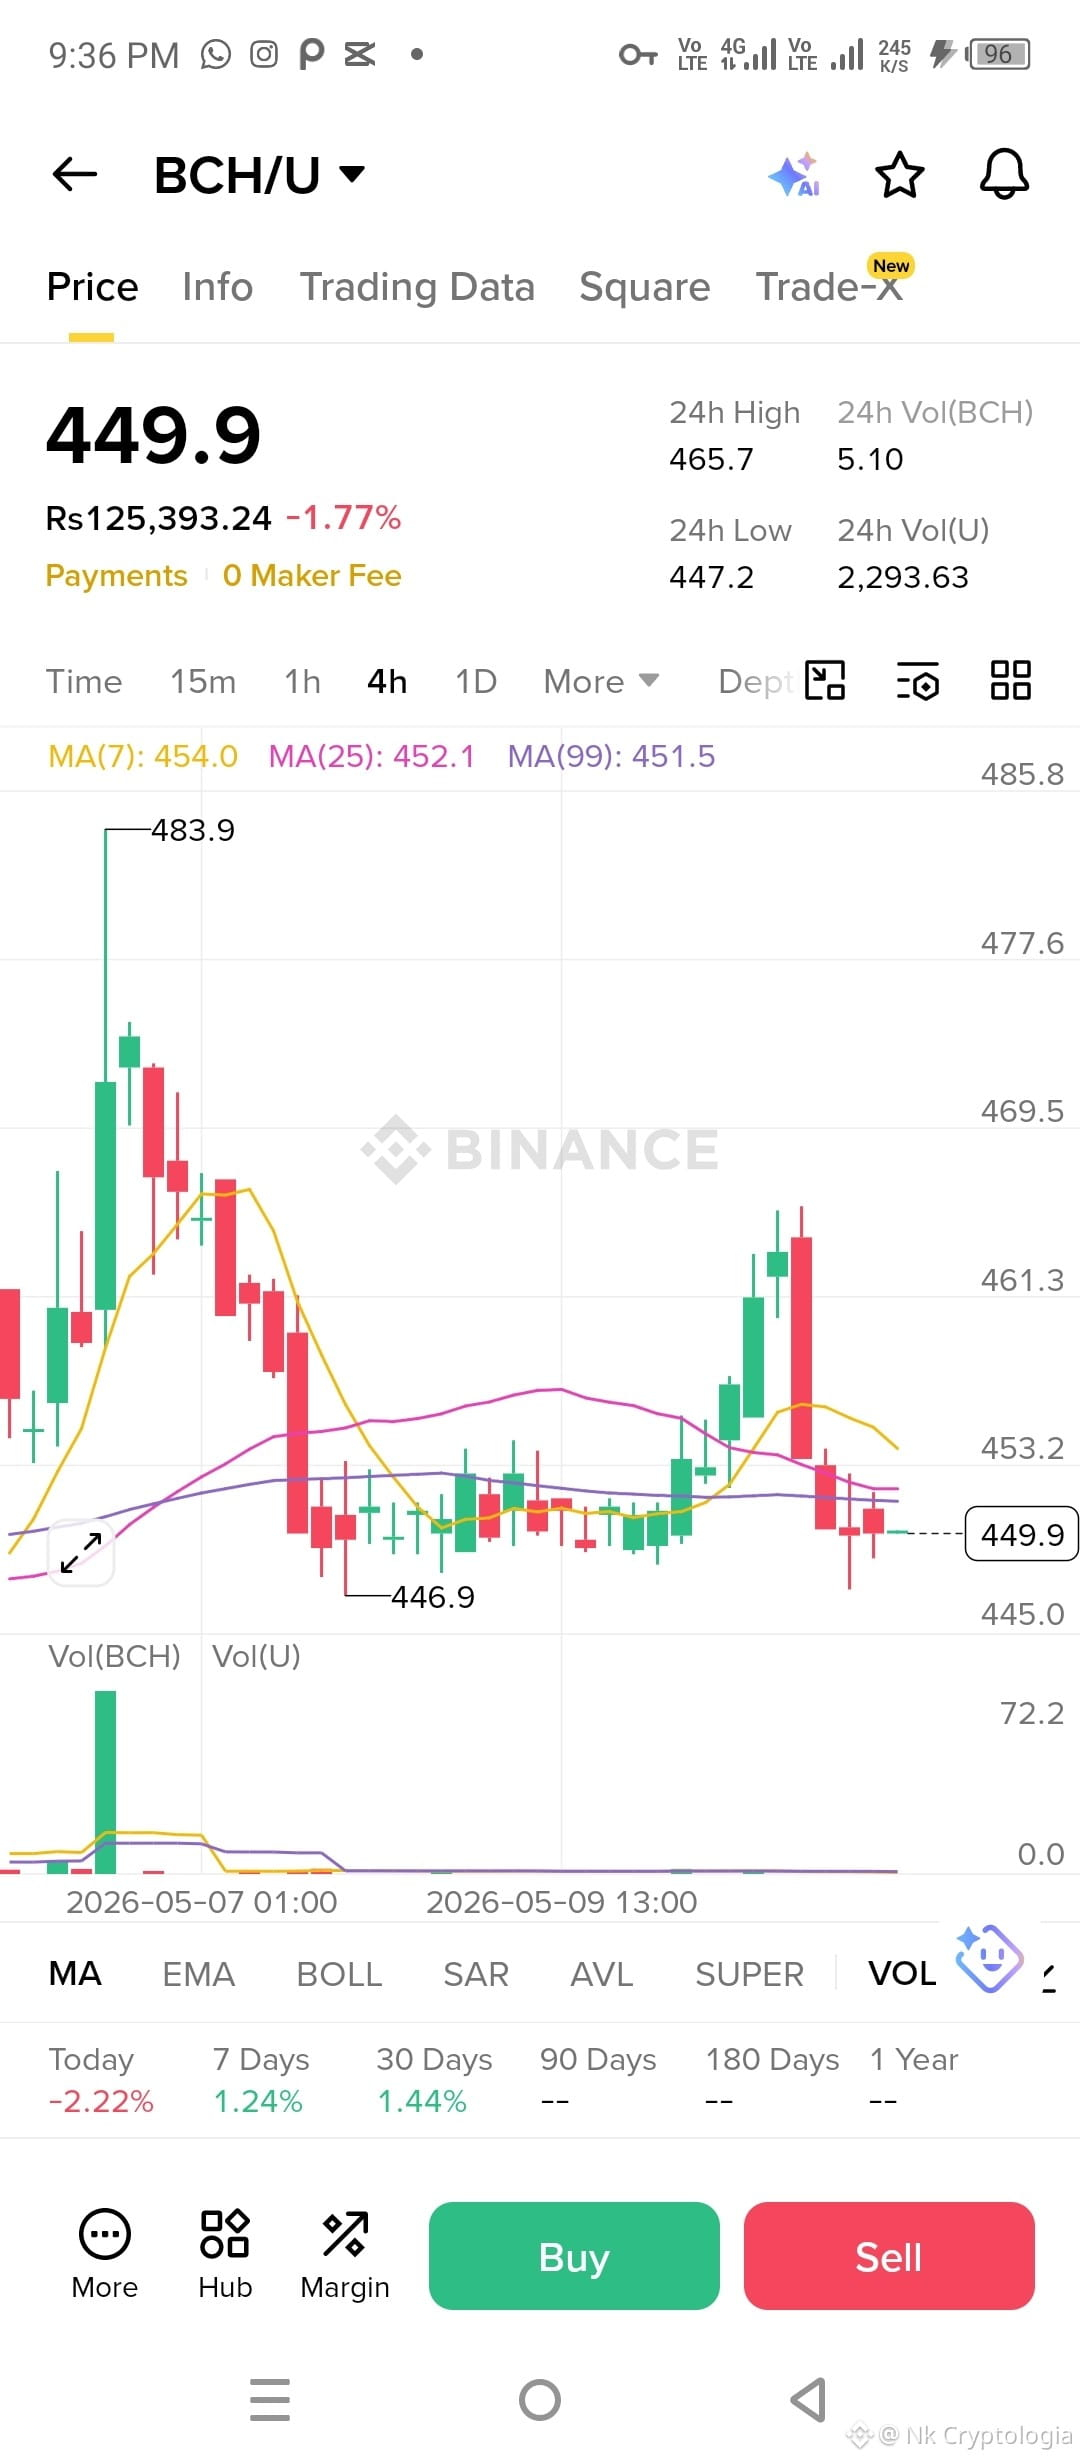
here is a technical analysis of the current market structure and the likely next move.
Technical Analysis
Price Action & Trend
Current Price: $449.9 (down 1.77% in the last 24 hours).
Structure: The chart shows a recent rejection from a local high of $483.9. Since that peak, the price has been making lower highs and is currently consolidating near a local support level.
Support & Resistance:
Immediate Support: $446.9. The price has touched this level recently and bounced slightly.
Immediate Resistance: $461.3. This is the previous local peak before the current dip.
Major Resistance: $483.9, which marked the top of the recent bullish attempt.
Moving Averages (MA)
MA(7) (Yellow): $454.0
MA(25) (Pink): $452.1
MA(99) (Purple): $451.5 The price is currently trading below all three major moving averages on the 4H timeframe. This indicates a short-term bearish crossover and suggests that the MAs are now acting as dynamic resistance.
Volume
Trading volume is relatively low compared to the spike seen during the run-up to $483. The low volume on this current dip indicates a lack of strong buying interest at these levels, though it also suggests the selling pressure might be exhausting.
Next Movement & Price Prediction
Scenario 1: Bearish Continuation (High Probability)
If BCH fails to hold the $446.9 support level on the next 4H candle close, we will likely see a deeper correction.
Target: $435.0 - $440.0.
Condition: Staying below the $454 resistance (MA 7).
Scenario 2: Bullish Reversal (Low to Moderate Probability)
To regain bullish momentum, BCH needs to break and close above the $461.3 level.
Target: A retest of the $475 - $480 zone.
Condition: A strong volume spike and a crossover where the price moves back above the $454 MA.
$BCH
#IranRejectsUSPeacePlan
#TrumpToVisitChinaFromMay13To15
#StrategyToResumeBTCPurchases
#GrayscaleCardanoETF
#BTCSurpassesTeslaMarketCap
Technical Analysis
Price Action & Trend
Current Price: $449.9 (down 1.77% in the last 24 hours).
Structure: The chart shows a recent rejection from a local high of $483.9. Since that peak, the price has been making lower highs and is currently consolidating near a local support level.
Support & Resistance:
Immediate Support: $446.9. The price has touched this level recently and bounced slightly.
Immediate Resistance: $461.3. This is the previous local peak before the current dip.
Major Resistance: $483.9, which marked the top of the recent bullish attempt.
Moving Averages (MA)
MA(7) (Yellow): $454.0
MA(25) (Pink): $452.1
MA(99) (Purple): $451.5 The price is currently trading below all three major moving averages on the 4H timeframe. This indicates a short-term bearish crossover and suggests that the MAs are now acting as dynamic resistance.
Volume
Trading volume is relatively low compared to the spike seen during the run-up to $483. The low volume on this current dip indicates a lack of strong buying interest at these levels, though it also suggests the selling pressure might be exhausting.
Next Movement & Price Prediction
Scenario 1: Bearish Continuation (High Probability)
If BCH fails to hold the $446.9 support level on the next 4H candle close, we will likely see a deeper correction.
Target: $435.0 - $440.0.
Condition: Staying below the $454 resistance (MA 7).
Scenario 2: Bullish Reversal (Low to Moderate Probability)
To regain bullish momentum, BCH needs to break and close above the $461.3 level.
Target: A retest of the $475 - $480 zone.
Condition: A strong volume spike and a crossover where the price moves back above the $454 MA.
$BCH
#IranRejectsUSPeacePlan
#TrumpToVisitChinaFromMay13To15
#StrategyToResumeBTCPurchases
#GrayscaleCardanoETF
#BTCSurpassesTeslaMarketCap