$TON
/USDT Analysis**
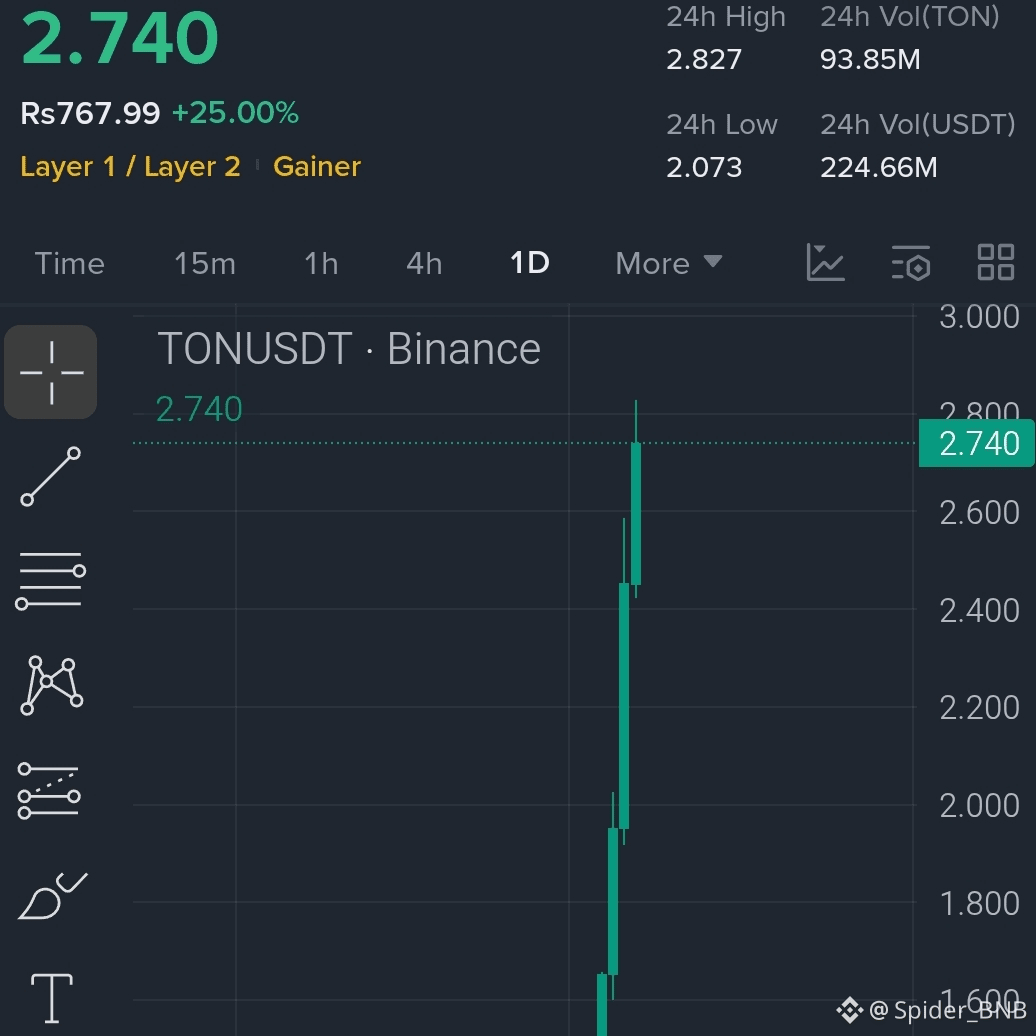
The chart shows a **"God Candle"**—a massive vertical breakout with high conviction.
### **Key Data**
* **Price:** 2.740 (+25%)
* **24h Range:** $2.07 – $2.82
* **Volume:** $224M+ (Very high liquidity)
### **Technical Outlook**
* **Resistance:** **$2.85 – $3.00**. A break here confirms a move into new price territory.
* **Support:** **$2.40 – $2.50**. Expect a "retest" of this zone if the price cools down.
* **Trend:** Extremely bullish, but the 90-degree angle suggests high risk for late entries (FOMO).
### **Bottom Line**
The trend is your friend until it bends. Look for a daily close above **$2.80** to confirm further upside, or wait for a dip to **$2.50** for a safer entry.#SPIDER_BNB
/USDT Analysis**
The chart shows a **"God Candle"**—a massive vertical breakout with high conviction.
### **Key Data**
* **Price:** 2.740 (+25%)
* **24h Range:** $2.07 – $2.82
* **Volume:** $224M+ (Very high liquidity)
### **Technical Outlook**
* **Resistance:** **$2.85 – $3.00**. A break here confirms a move into new price territory.
* **Support:** **$2.40 – $2.50**. Expect a "retest" of this zone if the price cools down.
* **Trend:** Extremely bullish, but the 90-degree angle suggests high risk for late entries (FOMO).
### **Bottom Line**
The trend is your friend until it bends. Look for a daily close above **$2.80** to confirm further upside, or wait for a dip to **$2.50** for a safer entry.#SPIDER_BNB