*Bitcoin at $82,281: Buy the Dip or Sell the Bounce? 6 May 2026 Analysis*
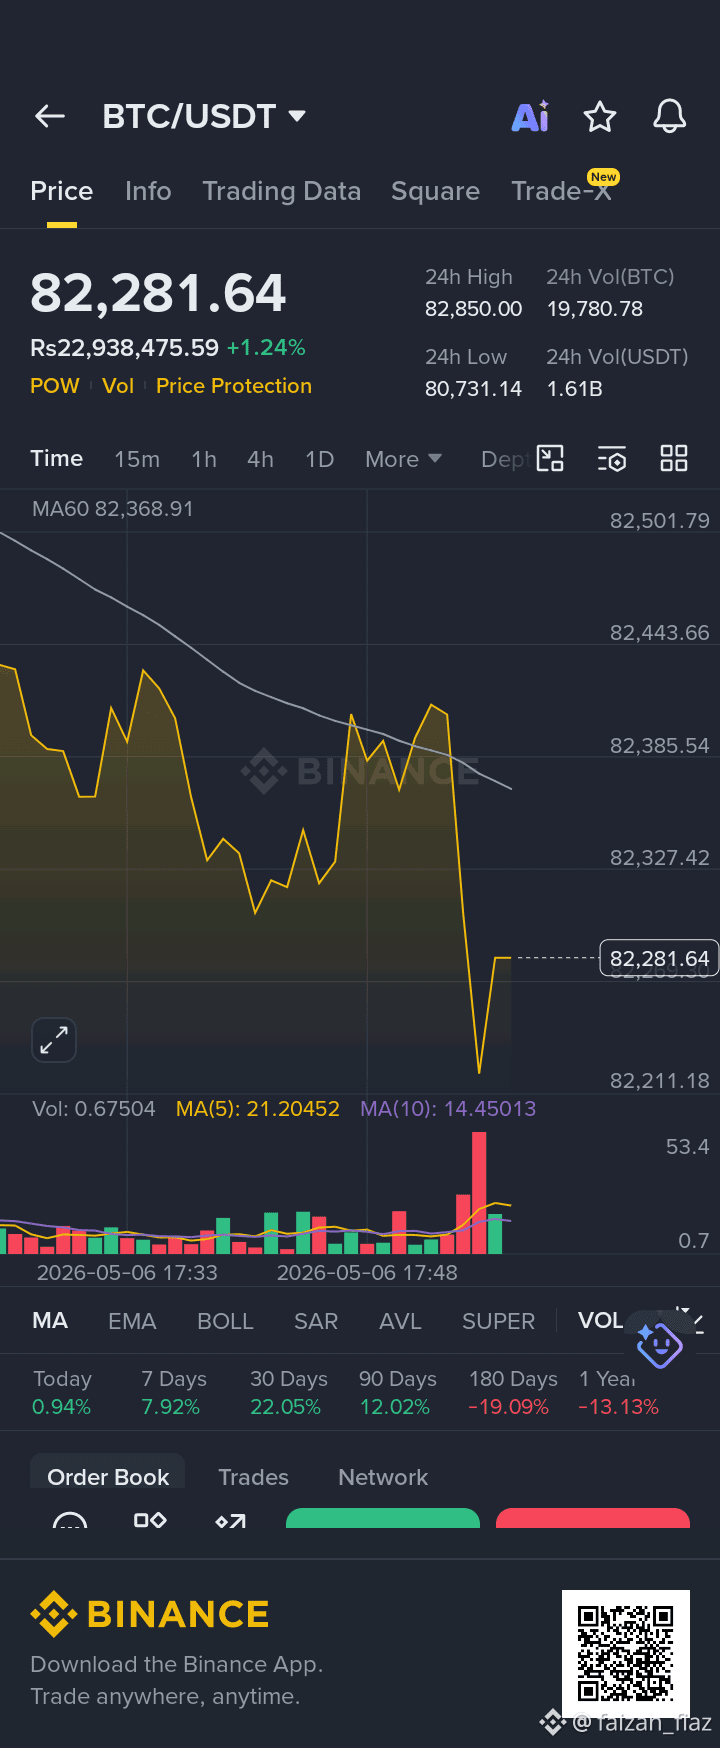
As of 5:57 PM today, Bitcoin is trading at *$82,281.64 USDT*, up *+1.24%* on the day. But the 15-minute chart shows the session wasn’t smooth. Let’s break down what the market is saying.*What the Market Is Signaling Right Now*
*Bearish Signs:*1. *Below MA60*: #BTC走势分析 is trading under the 60-period moving average at $82,368.91. In short-term trading, that’s often seen as resistance. The white MA line is sloping down.2. *Sharp Rejection*: The chart shows a sudden wick down to $82,211 with a huge red volume bar. Sellers dumped hard at $82,385 and pushed price down fast.
3. *Longer-Term Trend*: Despite a strong 30-day run of *+22.05%*, #BTC is still *-19.09%* over 6 months and *-13.13%* over 1 year. The broader downtrend from late 2025 hasn’t fully reversed.
*Bullish Signs:*1. *Buyers Defended Support*: That dip to $82,211 was bought up instantly. The green volume that followed shows demand is stepping in on drops.2. *Daily & Weekly Positive*: #BTC is +0.94% today and +7.92% this week. Momentum over the last 30 days is solid at +22.05%.3. *Holding 24h Range*: The 24h low is $80,731. Price is currently $1,550 above it, showing buyers haven’t let it retest that level.Key Levels Traders Are Watching*
Type Level Why It Matters
**Resistance** $82,368 - $82,385 MA60 + intraday rejection zone
**Resistance** $82,850 24h high. Break = bullish continuation
**Support** $82,211 Intraday bounce point with high volume
**Support** $80,731 24h low. Break = risk of deeper drop
*So… Buy or Sell?*The market isn’t giving a clear-cut answer. It’s in a _conflict zone_.
- *Bullish case*: If $BTC reclaims $82,368 and closes above MA60 with volume, short-term buyers may target $82,850 and then $84,000. The strong 30-day performance supports this.
- *Bearish case*: If $BTC fails to break $82,368 and loses $82,211, sellers could push it back toward $80,731. The 6-month and 1-year negative returns show overhead supply exists.Right now, $BTC is stuck between dip-buyers and profit-take
As of 5:57 PM today, Bitcoin is trading at *$82,281.64 USDT*, up *+1.24%* on the day. But the 15-minute chart shows the session wasn’t smooth. Let’s break down what the market is saying.*What the Market Is Signaling Right Now*
*Bearish Signs:*1. *Below MA60*: #BTC走势分析 is trading under the 60-period moving average at $82,368.91. In short-term trading, that’s often seen as resistance. The white MA line is sloping down.2. *Sharp Rejection*: The chart shows a sudden wick down to $82,211 with a huge red volume bar. Sellers dumped hard at $82,385 and pushed price down fast.
3. *Longer-Term Trend*: Despite a strong 30-day run of *+22.05%*, #BTC is still *-19.09%* over 6 months and *-13.13%* over 1 year. The broader downtrend from late 2025 hasn’t fully reversed.
*Bullish Signs:*1. *Buyers Defended Support*: That dip to $82,211 was bought up instantly. The green volume that followed shows demand is stepping in on drops.2. *Daily & Weekly Positive*: #BTC is +0.94% today and +7.92% this week. Momentum over the last 30 days is solid at +22.05%.3. *Holding 24h Range*: The 24h low is $80,731. Price is currently $1,550 above it, showing buyers haven’t let it retest that level.Key Levels Traders Are Watching*
Type Level Why It Matters
**Resistance** $82,368 - $82,385 MA60 + intraday rejection zone
**Resistance** $82,850 24h high. Break = bullish continuation
**Support** $82,211 Intraday bounce point with high volume
**Support** $80,731 24h low. Break = risk of deeper drop
*So… Buy or Sell?*The market isn’t giving a clear-cut answer. It’s in a _conflict zone_.
- *Bullish case*: If $BTC reclaims $82,368 and closes above MA60 with volume, short-term buyers may target $82,850 and then $84,000. The strong 30-day performance supports this.
- *Bearish case*: If $BTC fails to break $82,368 and loses $82,211, sellers could push it back toward $80,731. The 6-month and 1-year negative returns show overhead supply exists.Right now, $BTC is stuck between dip-buyers and profit-take