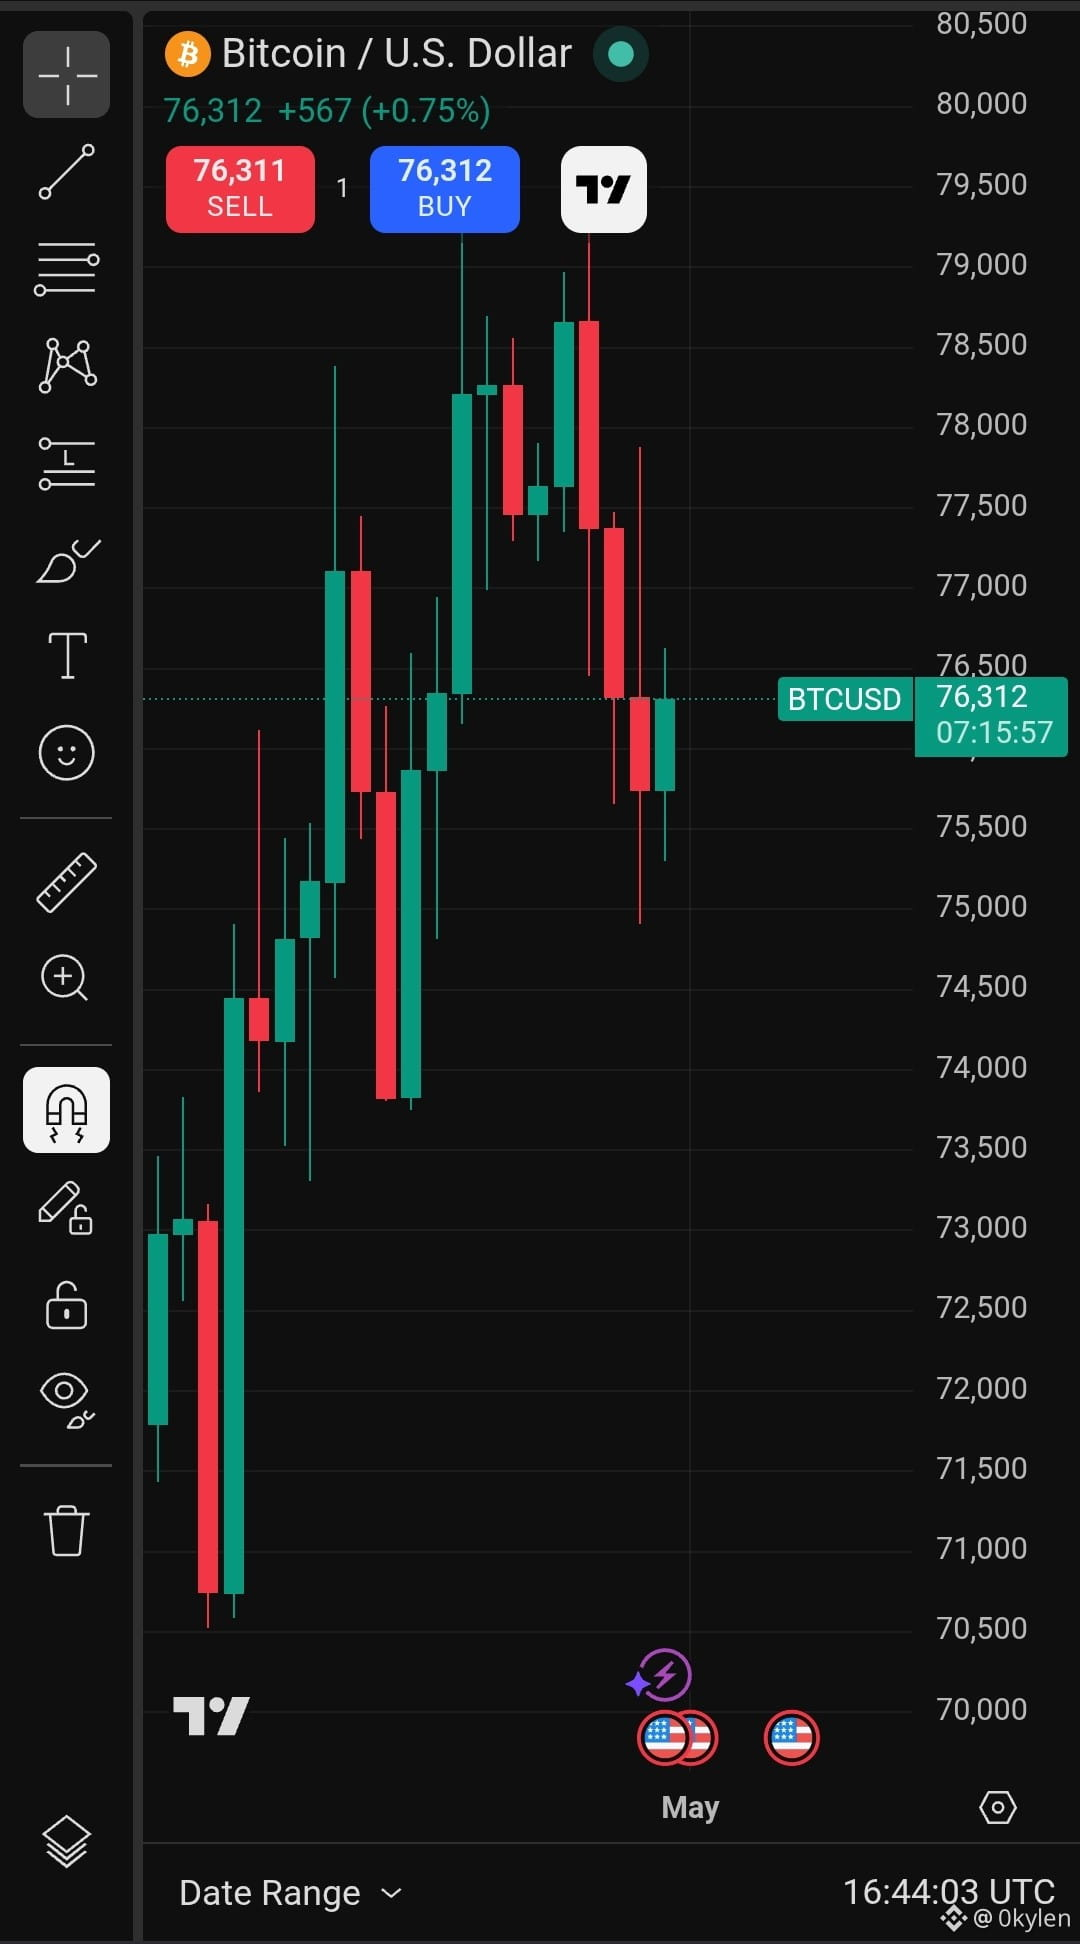
Current Bitcoin analytical view of point and future scenario of price fluctuations
$BTC #StrategyBTCPurchase #BinanceLaunchesGoldvs.BTCTradingCompetition
Bitcoin is currently in a sideways-to-volatile consolidation phase near major resistance zones (~$75K–$82K range).
Recent data shows:
BTC trading roughly $75K–$80K region with repeated rejection and support flips
Short-term trend: range-bound / neutral
Medium-term trend: still structurally bullish but weakening momentum
Volatility: compressed → “breakout setup forming”
Key Technical Zones
Immediate Resistance
~$79K–$82K (strong sell wall)
Above that: ~$85K (next expansion zone)
Immediate Support
~$75K–$76K (current pivot zone)
Break below → ~$71K risk zone
Deep support: ~$65K–$68K (trend structure base)
📉 2. Market Momentum Signals
Neutral but fragile momentum
RSI: ~50–55 (no strong trend)
MACD: flat / slight bearish divergence risk
Volume: mixed (spot buying vs weaker futures participation)
Structure: compression pattern (volatility squeeze)
👉 Interpretation:
Market is coiling energy — typically a precursor to a sharp move (not sideways continuation forever).
🧠 3. Macro Drivers Influencing BTC
Current price action is not purely technical. It is strongly influenced by:
Bullish drivers
ETF inflows and institutional accumulation cycles
Long-term adoption trend (BTC as macro asset)
Reduced exchange supply (structural scarcity)
Bearish / risk drivers
High interest-rate sensitivity (risk asset behavior)
Profit-taking after prior rally cycles
Macro uncertainty → reduces liquidity appetite
🚦 4. Forward Price Scenarios (Next 2–6 Months)
🟢 Scenario A — Bullish Breakout (Probability: ~40%)
If BTC breaks and holds above $82K
Expected path:
$85K → $92K
Extended bullish wave → $100K+ possible
What confirms this:
Strong volume breakout
ETF inflow acceleration
Daily close above resistance band
$BTC #StrategyBTCPurchase #BinanceLaunchesGoldvs.BTCTradingCompetition
Bitcoin is currently in a sideways-to-volatile consolidation phase near major resistance zones (~$75K–$82K range).
Recent data shows:
BTC trading roughly $75K–$80K region with repeated rejection and support flips
Short-term trend: range-bound / neutral
Medium-term trend: still structurally bullish but weakening momentum
Volatility: compressed → “breakout setup forming”
Key Technical Zones
Immediate Resistance
~$79K–$82K (strong sell wall)
Above that: ~$85K (next expansion zone)
Immediate Support
~$75K–$76K (current pivot zone)
Break below → ~$71K risk zone
Deep support: ~$65K–$68K (trend structure base)
📉 2. Market Momentum Signals
Neutral but fragile momentum
RSI: ~50–55 (no strong trend)
MACD: flat / slight bearish divergence risk
Volume: mixed (spot buying vs weaker futures participation)
Structure: compression pattern (volatility squeeze)
👉 Interpretation:
Market is coiling energy — typically a precursor to a sharp move (not sideways continuation forever).
🧠 3. Macro Drivers Influencing BTC
Current price action is not purely technical. It is strongly influenced by:
Bullish drivers
ETF inflows and institutional accumulation cycles
Long-term adoption trend (BTC as macro asset)
Reduced exchange supply (structural scarcity)
Bearish / risk drivers
High interest-rate sensitivity (risk asset behavior)
Profit-taking after prior rally cycles
Macro uncertainty → reduces liquidity appetite
🚦 4. Forward Price Scenarios (Next 2–6 Months)
🟢 Scenario A — Bullish Breakout (Probability: ~40%)
If BTC breaks and holds above $82K
Expected path:
$85K → $92K
Extended bullish wave → $100K+ possible
What confirms this:
Strong volume breakout
ETF inflow acceleration
Daily close above resistance band