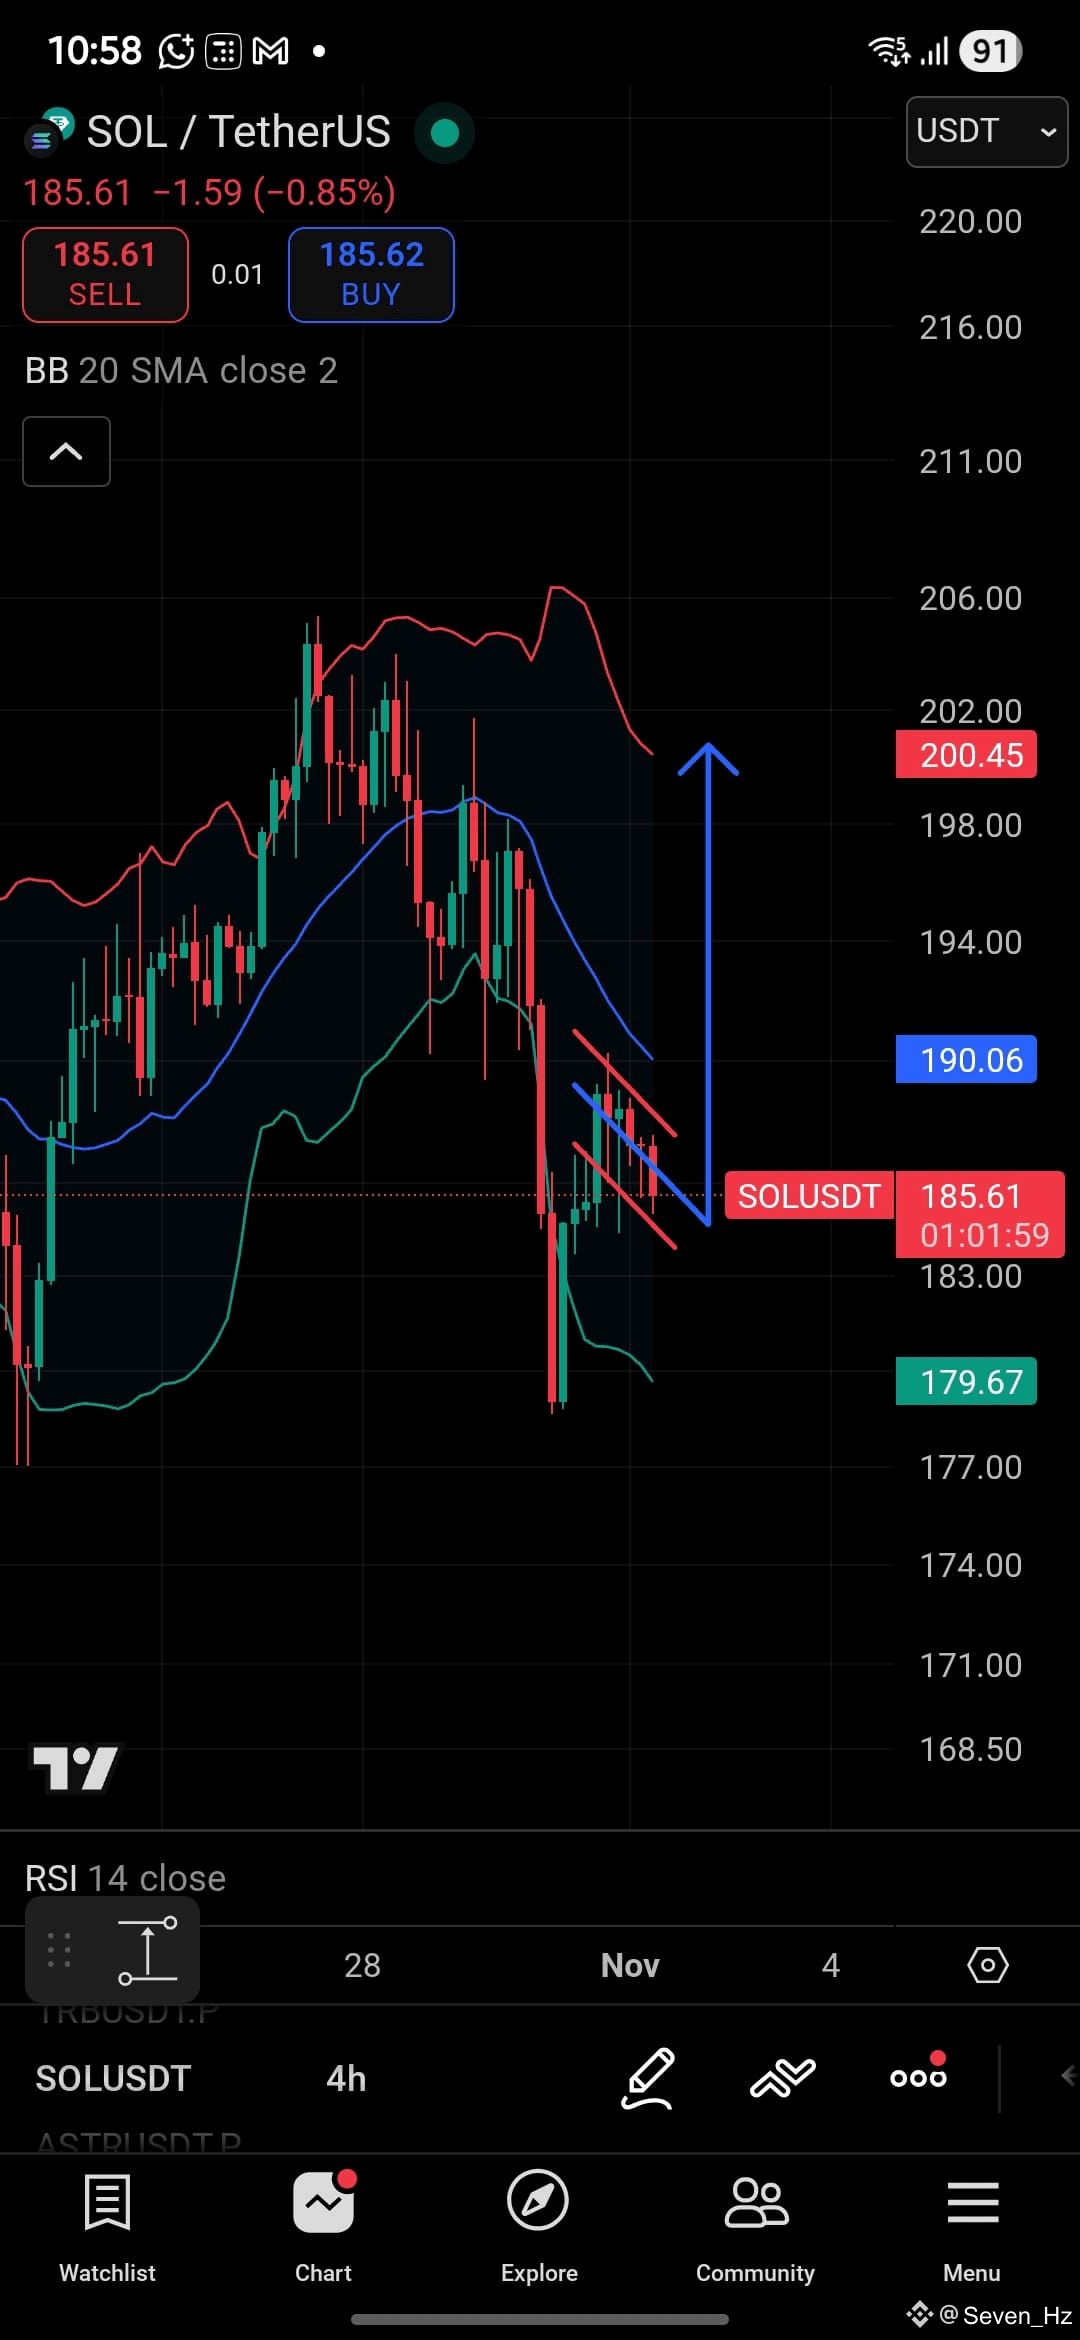
#solana #bullish $$SOL is currently trading around $185.6, showing a short-term falling wedge pattern, which is typically a bullish reversal signal.
Price is consolidating after a sharp drop and is testing the lower Bollinger Band, suggesting potential exhaustion of selling pressure.
The RSI (14) indicates that momentum is stabilizing after being oversold, hinting at a possible upside recovery.
The Bollinger mid-band (SMA 20) at $190.0 acts as the first resistance zone. A breakout above this could trigger a move toward the upper band.
📈 Trade Idea
Pattern: Falling Wedge (Bullish Reversal)
Bias: Bullish (upon breakout confirmation above $188–190)
Current Price: $185.6
🎯 Targets (TP)
TP1: $190.0 (Bollinger Mid-band)
TP2: $196.5 (Upper wedge breakout zone)
TP3: $200.5 (Upper Bollinger Band / Major Resistance)
---
🛡️ Stop Loss (SL)
SL: $179.5 (Below recent swing low and lower band)
Leverage as per your position sizing I would suggest no more than 5x with strict SL
Price is consolidating after a sharp drop and is testing the lower Bollinger Band, suggesting potential exhaustion of selling pressure.
The RSI (14) indicates that momentum is stabilizing after being oversold, hinting at a possible upside recovery.
The Bollinger mid-band (SMA 20) at $190.0 acts as the first resistance zone. A breakout above this could trigger a move toward the upper band.
📈 Trade Idea
Pattern: Falling Wedge (Bullish Reversal)
Bias: Bullish (upon breakout confirmation above $188–190)
Current Price: $185.6
🎯 Targets (TP)
TP1: $190.0 (Bollinger Mid-band)
TP2: $196.5 (Upper wedge breakout zone)
TP3: $200.5 (Upper Bollinger Band / Major Resistance)
---
🛡️ Stop Loss (SL)
SL: $179.5 (Below recent swing low and lower band)
Leverage as per your position sizing I would suggest no more than 5x with strict SL