
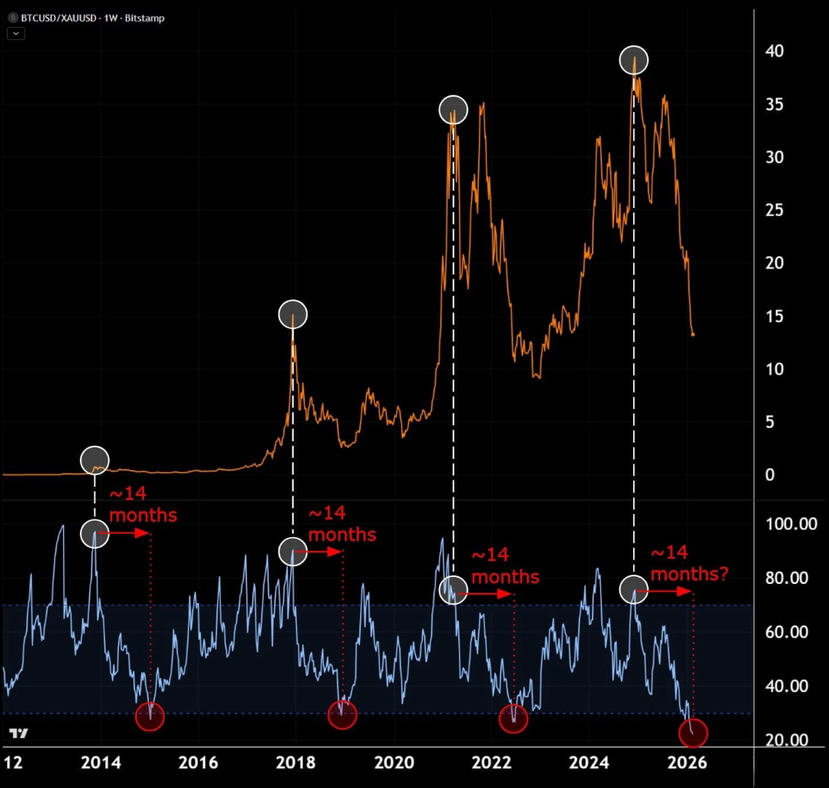
When you price Bitcoin in dollars, the narrative looks confusing. We printed an all-time high in October 2025. That makes many assume we’re only a few months into a new bear phase.
But price it in Gold terms… and the story changes completely.
The $BTC / $XAU chart is now printing the lowest RSI reading in its history.
That’s not just “weakness.”
That’s compression at an extreme.
The 14-Month Pattern
Look at prior major Bitcoin bear phases measured against Gold:
• Nov 2013 → Jan 2015 ≈ 14 months
• Dec 2017 → Feb 2019 ≈ 14 months
• April 2021 → June 2022 ≈ 14 months
Each time, the relative drawdown against Gold lasted roughly the same duration.
Now?
Bitcoin peaked relative to Gold in December 2024. We are roughly 14 months removed from that high.
That symmetry isn’t proof — but it’s consistent.
Why the Dollar Chart Can Mislead
The October 2025 USD all-time high may not have represented real relative strength.
Gold and Silver were aggressively expanding during that period. If hard assets rise across the board, Bitcoin can print higher dollar highs while still underperforming relative to Gold.
In other words:
Nominal strength doesn’t always equal structural strength.
When you strip away dollar debasement and measure BTC in hard-asset terms, the trend suggests the relative bear market may have already matured.
RSI at Historic Lows
An RSI reading at all-time lows on the BTC/Gold pair reflects deep relative exhaustion.
Historically, such compression phases marked the end of multi-month bear trends — not their beginning.
After each prior 14-month relative drawdown, Bitcoin entered multi-year uptrends against Gold.
Not instantly.
But structurally.
The Key Question
Are we early in a new bear market?
Or late in one that started 14 months ago?
That distinction matters.
If this is late-stage relative compression, then downside asymmetry may be narrowing — not expanding.
If this is something structurally different, then bears are betting that the lowest relative RSI in history can still deteriorate further.
History doesn’t guarantee outcomes.
But when duration symmetry, relative exhaustion, and sentiment compression align — it becomes statistically notable.
The market feels uncertain.
It often does near transition points.
The real debate now isn’t whether Bitcoin is volatile.
It’s whether this 14-month relative reset is nearing completion — just as it did in prior cycles.