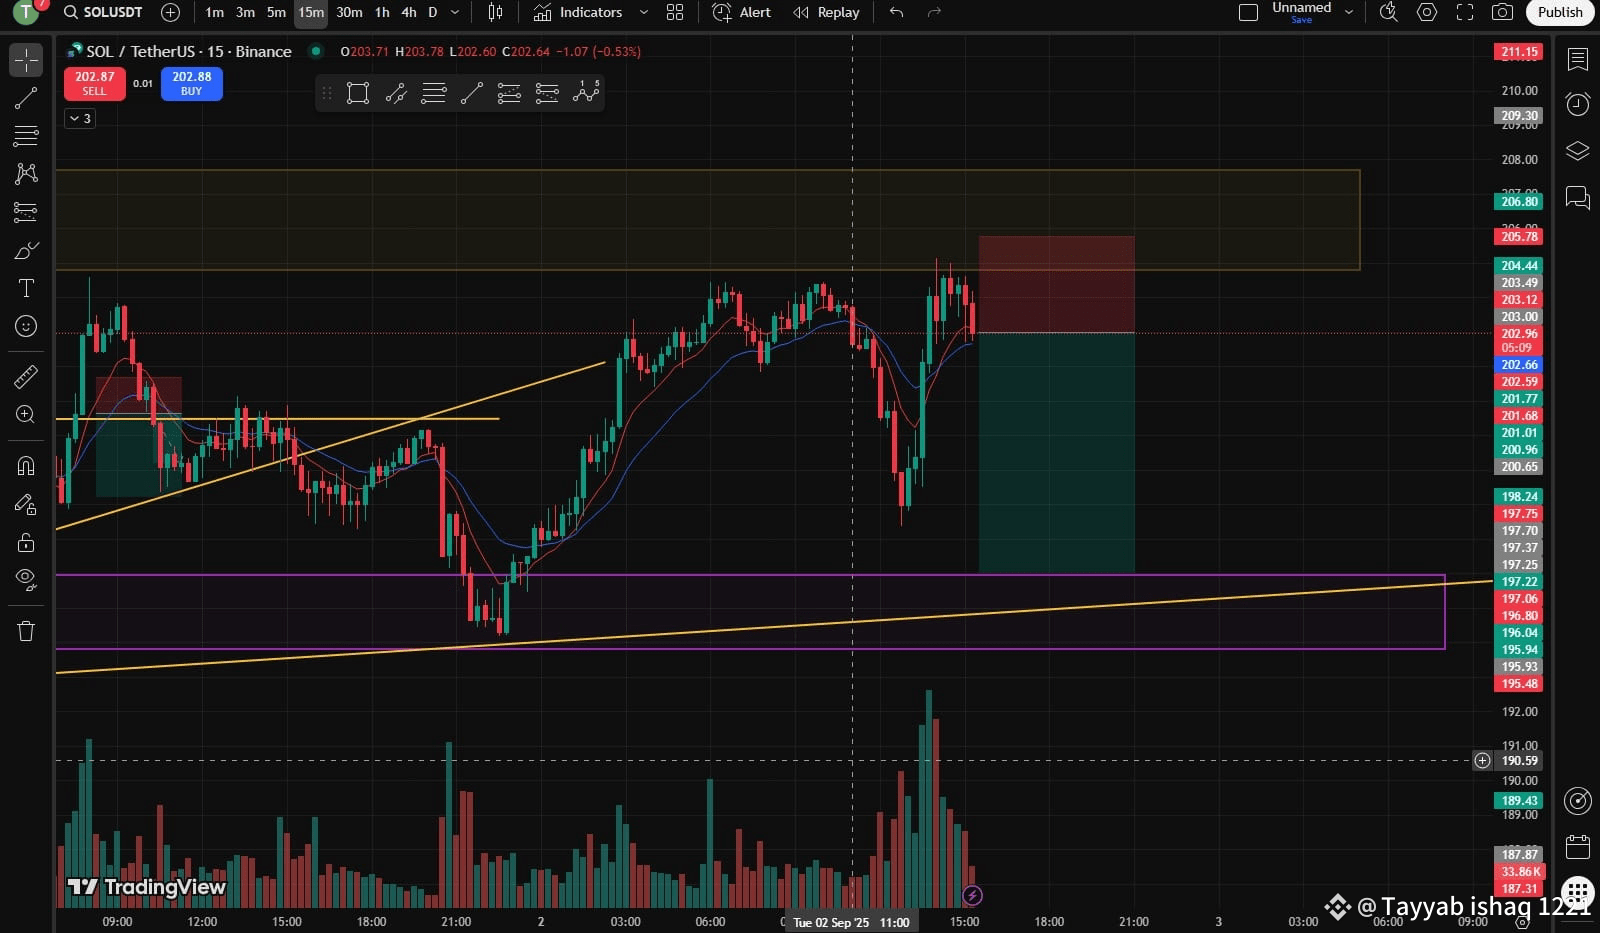
🐻 Bearish Setup on $SOL/USDT (15m Chart) – Potential Short Opportunity
🔹 Pattern & Context:
Price rejected from a strong resistance zone (highlighted in yellow).
Previous rising wedge pattern broke to the downside, followed by a retest.
Current price action shows a lower high forming, signaling weakening bullish momentum.
Bearish engulfing candle confirms rejection from resistance.
🔹 Entry: Around $203 after rejection from resistance.
🔹 Stop Loss: Above resistance zone, around $206.80.
🔹 Take Profit: Downside targets near $197 - $195, aligning with the confluence of:
Previous horizontal support (purple zone).
Rising trendline (yellow diagonal support).
🔹 Indicators:
9 EMA and 21 EMA show potential for a bearish crossover.
Volume spike on the rejection candle adds conviction to the move.
📉 Bias: Bearish
As long as price remains below $204, bears have the upper hand.
Watch for a break of the purple support zone to confirm momentum.
Always use proper risk management. Not financial advice.
$SOL $ETH $BTC