The crypto market is flashing signals of intense volatility and massive opportunity, particularly within the $ZKP /USDT pair. As we analyze the latest data from the trading floors, it's clear that ZKP is currently one of the most dynamic assets on the radar. Whether you are a day trader or a long-term visionary, the current price action demands your attention. 🕵️♂️🔥
📊 Market Snapshot: ZKP’s Massive 24-Hour Surge
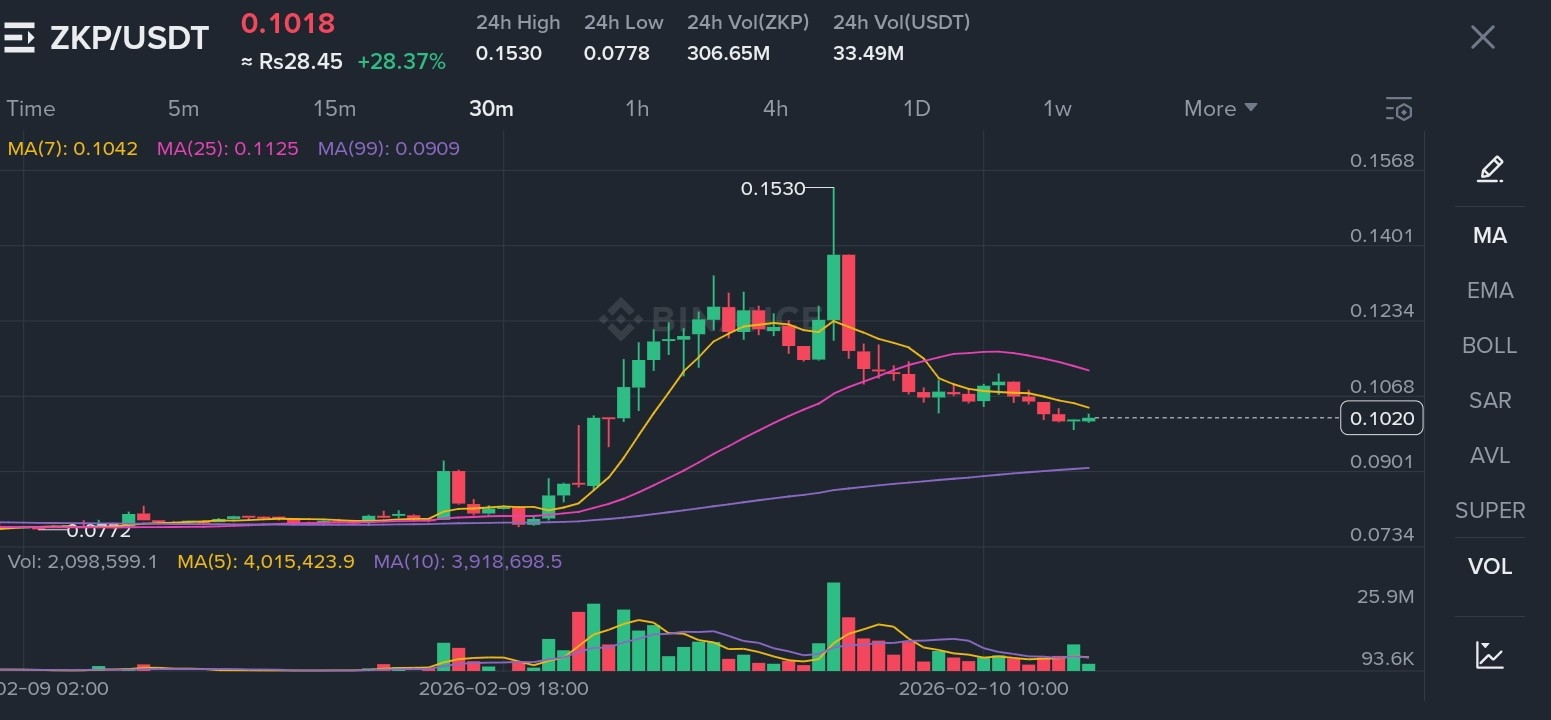
As of the latest data, ZKP/USDT is trading at approximately $0.1018. What makes this price point fascinating is the incredible momentum behind it—the asset is up a staggering +28.37% in just the last 24 hours.
Let’s look at the liquidity and participation levels that are driving this move:
24h High: $0.1530
24h Low: $0.0778
Trading Volume ($ZKP ): 306.65M
Trading Volume (USDT): 33.49M
This surge suggests a period of intense accumulation followed by a parabolic "blow-off" top at the $0.1530 level, which has now transitioned into a healthy consolidation phase. 🧘♂️💹
📉 Technical Analysis: Breaking Down the 30-Minute Chart
Zooming into the 30m timeframe, we can see a classic "Pump and Retrace" structure that is currently testing critical support levels. 🛠️
1. The Moving Averages (MA)
The chart shows a cluster of Moving Averages providing a roadmap for the next move:
MA(7) - Yellow: Currently at 0.1042, acting as immediate overhead resistance.
MA(25) - Pink: Sitting at 0.1125, representing the mid-term trend line that the price is currently trading below.
MA(99) - Purple: Located down at 0.0909, serving as the "Line in the Sand" for bulls. As long as ZKP stays above this purple line, the macro bullish structure remains intact.
2. Volume and Exhaustion
The volume bars at the bottom of the chart tell a story of heavy participation. We saw a massive green volume spike during the run-up to $0.1530, but the recent red candles show decreasing volume on the sell-off. This is often a bullish signal, suggesting that the "selling pressure" is drying up and buyers may be preparing for a second leg up. ⛽🚀
🌍 The Macro View: OG/USDT and the 2026-2027 Roadmap
While ZKP provides short-term fireworks, looking at the OG/USDT Weekly (1W) Chart provides a masterclass in long-term cycle theory.
Price History: We see a clear pattern of accumulation between 2022 and 2025.
Current Standing: Trading at $4.404, OG has recently seen a strong +9.40% weekly gain.
The Projection: The technical roadmap suggests a breakout from the current horizontal support zone, with a projected path hitting $8.00 before potentially soaring toward the $12.00 - $14.00 range throughout late 2026 and early 2027. 🎯💎
💡 Strategic Takeaways for Traders
In markets this volatile, discipline is your greatest asset. Here is how to approach the current ZKP and OG setups:
Patience in Consolidation: ZKP is currently in a "cool down" period after its 28% run. Watch for a candle close back above the MA(7) to signal the start of a new rally. ⏳
Support Buys: The $0.090 area (MA99) represents a high-value entry zone for those looking to catch a bounce. 🧱
Long-Term Vision: If you believe in the "Supercycle" theory mentioned by industry leaders like CZ, the weekly structure on coins like OG suggests we are only at the beginning of a multi-year expansion phase. 🏛️
🏁 Final Thought
The combination of ZKP's explosive short-term volatility and OG's solid long-term weekly structure creates a perfect environment for diversified trading. Keep your eyes on the $0.1020 level for ZKP—if the bulls hold this line, we could be looking at a re-test of the $0.15 highs sooner than you think! 🏁💰
#ZKP #CryptoTrading #BitcoinSupercycle #altcoinseason #TechnicalAnalysis
Would you like me to generate a YouTube-sized cover picture for this ZKP market analysis? (I'll ensure there's no date or time in the image!)