Just a quick summary, as i have had DMs about it recently
1. Logarithmic Charts Explained
2. Linear Charts Explained
3. When to Use Log rather than Linear
4. Summary
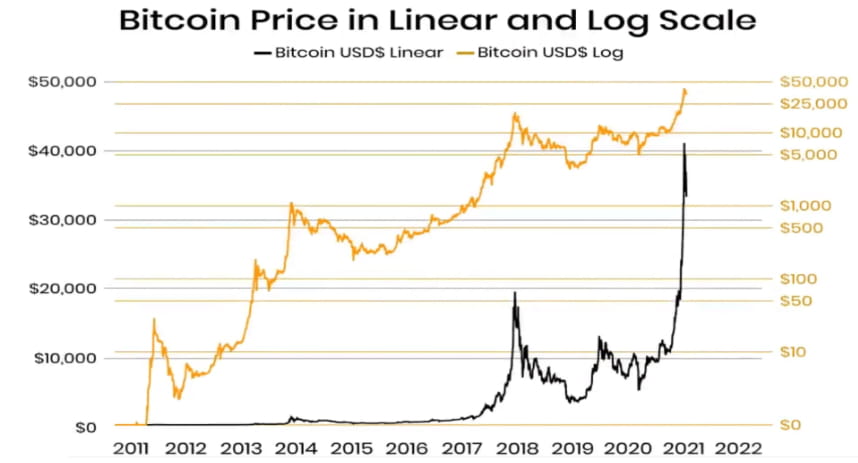
-- Logarithmic Charts Explained --

Logarithmic or log price scale, represents price spacing on the vertical or y-axis dependent on the PERCENTAGE CHANGE in the underlying asset's price
Think of it as the log scale shows the rate of change over time
-- Linear Charts Explained --
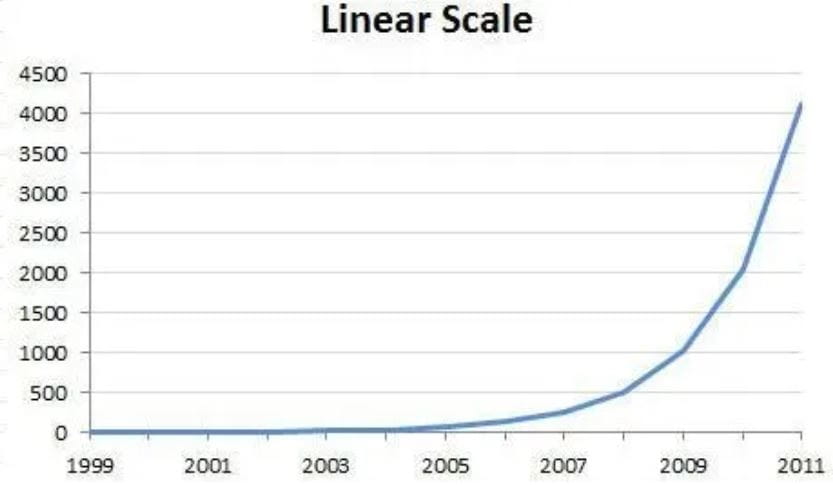
Linear or arithmetic price scale, represents price on the y-axis using equidistant spacing between the designated prices / the absolute values
Think of it as showing the absolute number increase / decrease over time
-- When to Use Log rather than Linear --
Traders tend to use log for Long-Term perspective or when price movements are large / in multiples
Linear scale is used more by Day traders within tight ranges
-- Summary --
I use Log when looking at HTF's and trying to find confluences with trend lines / pitchforks etc...
I find with Bitcoin due to the large % price moves I tend to keep my charts on Log
NOTE: Some @tradingview indicators have specific log scale settings