
#vsa
vsa
閲覧回数 4,220
25人が討論中
注目
最新

·
--
記事
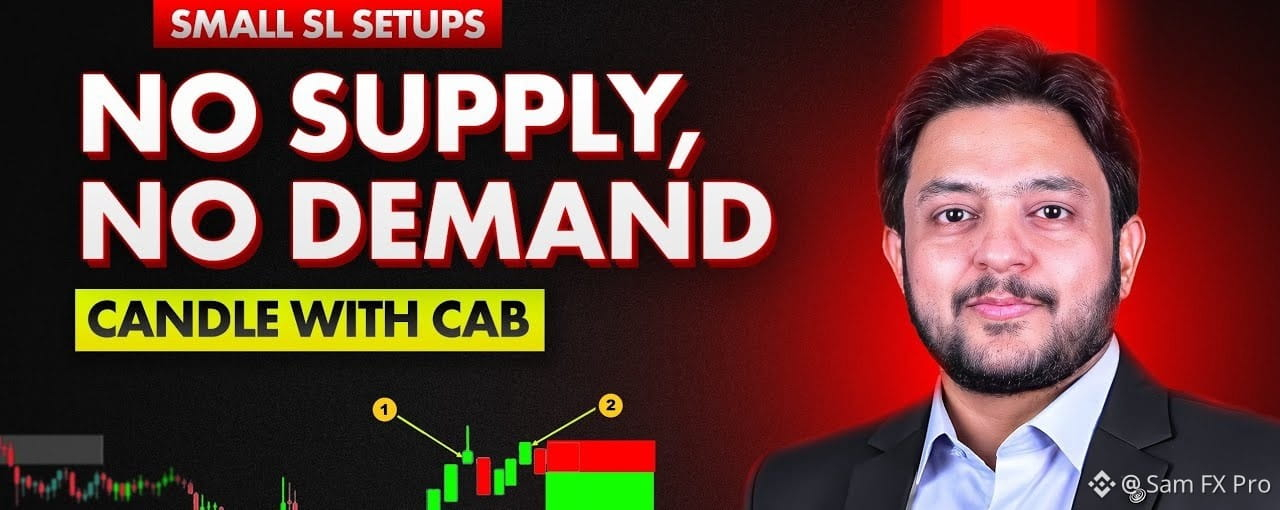
🚨Guy's STOP and LEARN $BTC 90% Accuracy Strategy 🤫🔥 需要なし(NO DEMAND)& 供給なし(NO SUPPLY)――多くのトレーダーが無視している出来高戦略
この記事の最後に、この戦略で今日の私の$800の利益が表示されます✅
ほとんどのトレーダーはローソク足を見る。
出来高を見て賢いトレーダーは、出来高を通してローソク足が何を言っているかを見ます。👀
私のお気に入りのVSA(出来高分析)の概念の1つが、需要なし(ND)& 供給なし(NS)です。
考え方はシンプルです。
需要なし(NO DEMAND)=買い手が本当の強さを見せていない
📉 供給なし(NO SUPPLY)=売り手が本当の強さを見せていない
しかし、重要なルールが1つあります。
⚠️ 低出来高のローソク足を見たからといって、ND/NSだけで取引しないでください。状況が重要です。
🚨Guy's STOP and LEARN $BTC 90% Accuracy Strategy 🤫
🔥 需要なし(NO DEMAND)& 供給なし(NO SUPPLY)――多くのトレーダーが無視している出来高戦略
この記事の最後に、この戦略で今日の私の$800の利益が表示されます✅
ほとんどのトレーダーはローソク足を見る。
出来高を見て賢いトレーダーは、出来高を通してローソク足が何を言っているかを見ます。👀
私のお気に入りのVSA(出来高分析)の概念の1つが、需要なし(ND)& 供給なし(NS)です。
考え方はシンプルです。
需要なし(NO DEMAND)=買い手が本当の強さを見せていない
📉 供給なし(NO SUPPLY)=売り手が本当の強さを見せていない
しかし、重要なルールが1つあります。
⚠️ 低出来高のローソク足を見たからといって、ND/NSだけで取引しないでください。状況が重要です。
この記事の最後に、この戦略で今日の私の$800の利益が表示されます✅
ほとんどのトレーダーはローソク足を見る。
出来高を見て賢いトレーダーは、出来高を通してローソク足が何を言っているかを見ます。👀
私のお気に入りのVSA(出来高分析)の概念の1つが、需要なし(ND)& 供給なし(NS)です。
考え方はシンプルです。
需要なし(NO DEMAND)=買い手が本当の強さを見せていない
📉 供給なし(NO SUPPLY)=売り手が本当の強さを見せていない
しかし、重要なルールが1つあります。
⚠️ 低出来高のローソク足を見たからといって、ND/NSだけで取引しないでください。状況が重要です。
1
94

🕯️ ロウソク(キャンドル)とは?
取引に慣れていない?まずここから👇
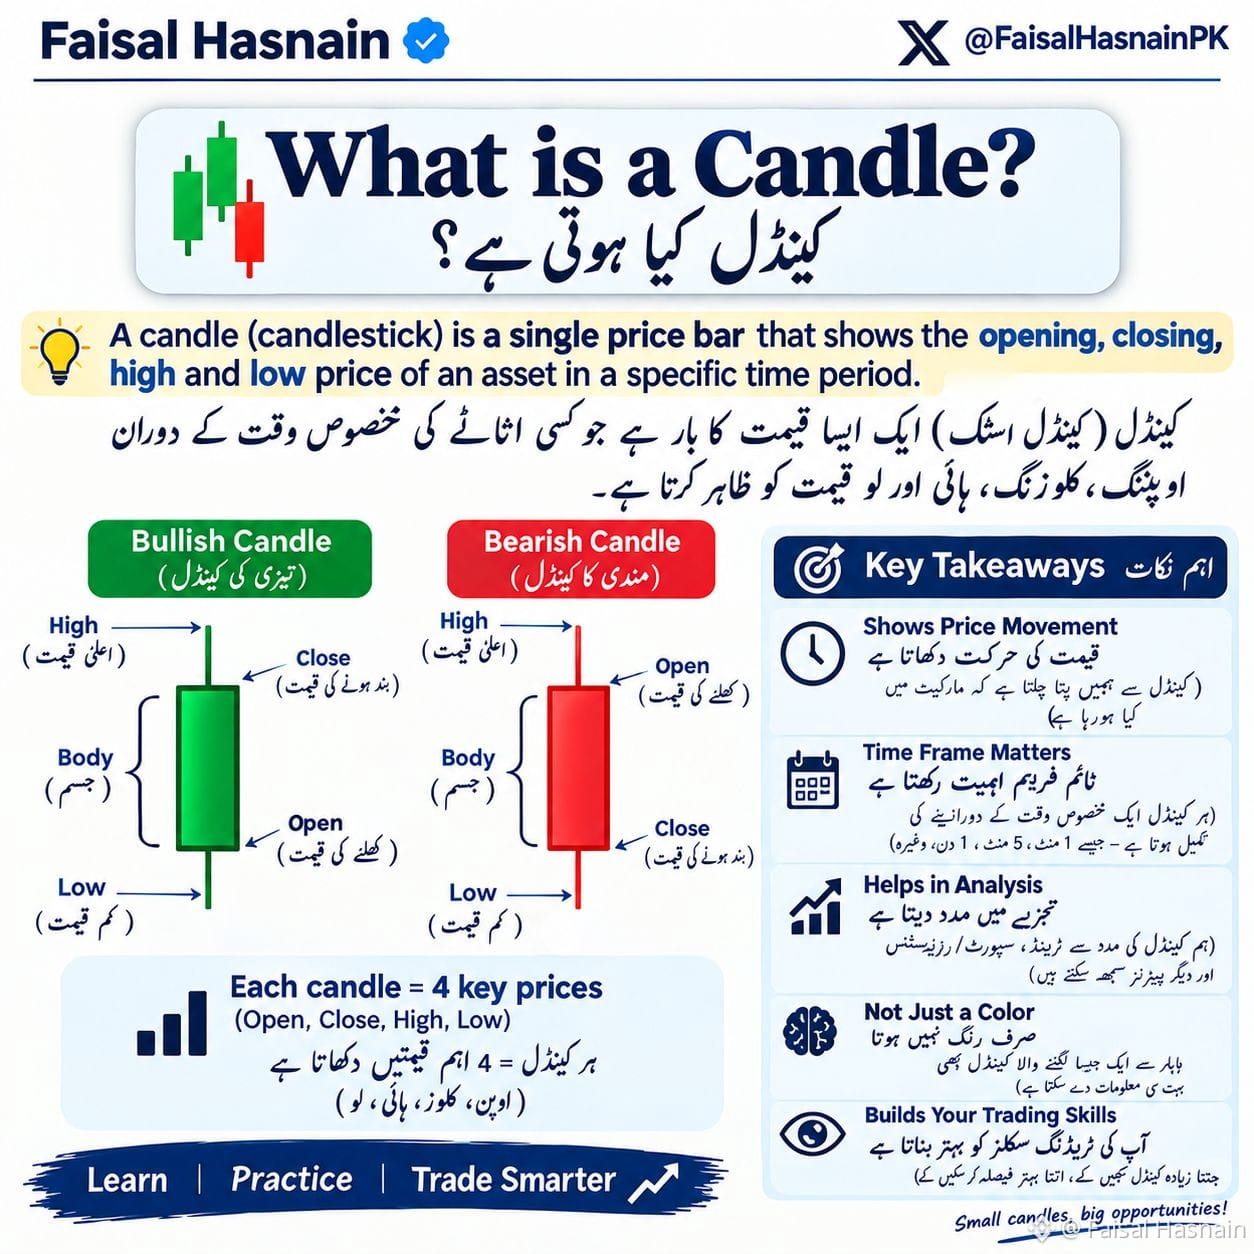
ローソク足(Candlestick)=1つの価格バーで、4つのことが一目でわかります📊
1️⃣ Open(始値)- 最初に始まった価格
2️⃣ Close(終値)- 終わった価格
3️⃣ High(高値)- 到達した最高値
4️⃣ Low(安値)- 到達した最安値
🟢 強気のキャンドル(Bullish Candle)=終値が始値より上
つまり、買い手がより強かったということ💪
🔴 弱気のキャンドル(Bearish Candle)=終値が始値より下
つまり、売り手がより強かったということ📉
なぜ重要?👇
⏰ 時間足(タイムフレーム)が重要 - 1分足は1日足とは違います
📈 値動き - キャンドルは市場が何をしているかを示します
🧠 分析 - S&R(サポート/レジスタンス)、トレンド、そしてパターンを見つける方法です
💡 色だけではない - すべてのキャンドルが物語を語ります
取引を学びたい?まずはローソク足の読み方を覚えましょう🔑
保存する🔖 | 初心者の方はRT❤️
$BTC $XAUT
#trading #Candlestick #VSA #forex #learntrading
🕯️ ロウソク(キャンドル)とは?
取引に慣れていない?まずここから👇
ローソク足(Candlestick)=1つの価格バーで、4つのことが一目でわかります📊
1️⃣ Open(始値)- 最初に始まった価格
2️⃣ Close(終値)- 終わった価格
3️⃣ High(高値)- 到達した最高値
4️⃣ Low(安値)- 到達した最安値
🟢 強気のキャンドル(Bullish Candle)=終値が始値より上
つまり、買い手がより強かったということ💪
🔴 弱気のキャンドル(Bearish Candle)=終値が始値より下
つまり、売り手がより強かったということ📉
なぜ重要?👇
⏰ 時間足(タイムフレーム)が重要 - 1分足は1日足とは違います
📈 値動き - キャンドルは市場が何をしているかを示します
🧠 分析 - S&R(サポート/レジスタンス)、トレンド、そしてパターンを見つける方法です
💡 色だけではない - すべてのキャンドルが物語を語ります
取引を学びたい?まずはローソク足の読み方を覚えましょう🔑
保存する🔖 | 初心者の方はRT❤️
$BTC $XAUT
#trading #Candlestick #VSA #forex #learntrading
取引に慣れていない?まずここから👇
ローソク足(Candlestick)=1つの価格バーで、4つのことが一目でわかります📊
1️⃣ Open(始値)- 最初に始まった価格
2️⃣ Close(終値)- 終わった価格
3️⃣ High(高値)- 到達した最高値
4️⃣ Low(安値)- 到達した最安値
🟢 強気のキャンドル(Bullish Candle)=終値が始値より上
つまり、買い手がより強かったということ💪
🔴 弱気のキャンドル(Bearish Candle)=終値が始値より下
つまり、売り手がより強かったということ📉
なぜ重要?👇
⏰ 時間足(タイムフレーム)が重要 - 1分足は1日足とは違います
📈 値動き - キャンドルは市場が何をしているかを示します
🧠 分析 - S&R(サポート/レジスタンス)、トレンド、そしてパターンを見つける方法です
💡 色だけではない - すべてのキャンドルが物語を語ります
取引を学びたい?まずはローソク足の読み方を覚えましょう🔑
保存する🔖 | 初心者の方はRT❤️
$BTC $XAUT
#trading #Candlestick #VSA #forex #learntrading
99

·
--
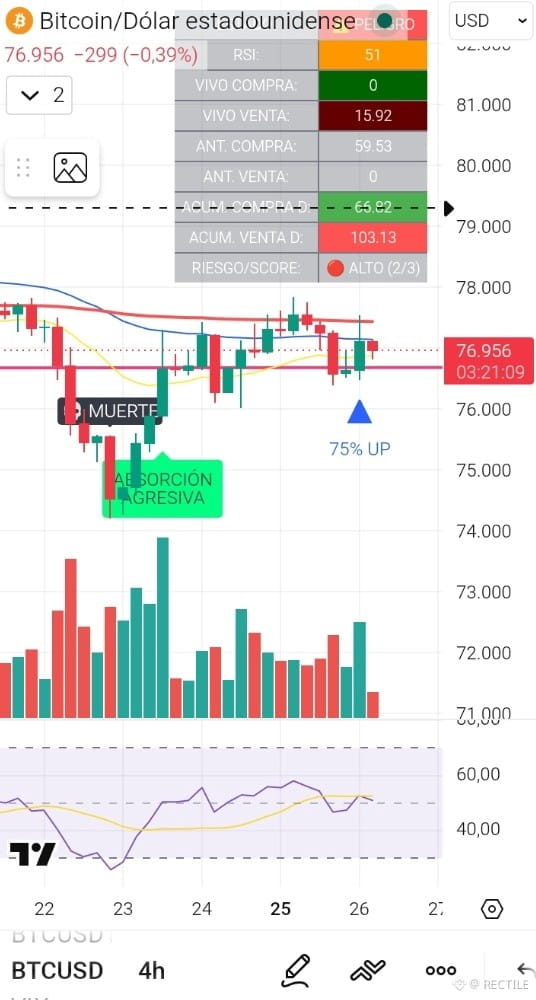
$BTC 🚨 ビットコイン (4H): RSIは51、ボリュームはドライ。ニューヨークでの嵐の前の静けさか? 📊
火曜日のオープニングはクラシックな統合フェーズを提供してくれますが、内部のオーダーフローは、従来のキャンドルチャートでは示されない警告を発しています。
構造分析 (4H):
1. 価格の圧縮: 24時間狭いレンジに閉じ込められています。昨日の迷いのキャンドル (ドージ) は最安値を試みましたが、価格は再び$76,900近くで安定しました。
2. 流動性の欠如: ボリュームのバーは急激に減少しています。機関投資家はこの中間レンジには参加しておらず、極端なレベルで再び資本を注入するのを待っています。
3. フローのダイバージェンス (危険): 価格が静かに見える一方で、ダッシュボードの累積ボリュームデルタは明確な弱気ドミナンスを示しています (売り103.13対買い65.82)。これにより、我々のアルゴリズムは高リスクの状態にあります。
💡 取引の視点: ボリュームの確認なしにレンジの中で取引することはギャンブルです。真の機関の動きは極端なところで起こります。
このレンジで取引していますか、それともボリュームを伴うブレイクを待っていますか? 👇
#BinanceSquare #Bitcoin #テクニカル分析 #オーダーフロー #クリプトトレーディング #VSA
$BTC 🚨 ビットコイン (4H): RSIは51、ボリュームはドライ。ニューヨークでの嵐の前の静けさか? 📊
火曜日のオープニングはクラシックな統合フェーズを提供してくれますが、内部のオーダーフローは、従来のキャンドルチャートでは示されない警告を発しています。
構造分析 (4H):
1. 価格の圧縮: 24時間狭いレンジに閉じ込められています。昨日の迷いのキャンドル (ドージ) は最安値を試みましたが、価格は再び$76,900近くで安定しました。
2. 流動性の欠如: ボリュームのバーは急激に減少しています。機関投資家はこの中間レンジには参加しておらず、極端なレベルで再び資本を注入するのを待っています。
3. フローのダイバージェンス (危険): 価格が静かに見える一方で、ダッシュボードの累積ボリュームデルタは明確な弱気ドミナンスを示しています (売り103.13対買い65.82)。これにより、我々のアルゴリズムは高リスクの状態にあります。
💡 取引の視点: ボリュームの確認なしにレンジの中で取引することはギャンブルです。真の機関の動きは極端なところで起こります。
このレンジで取引していますか、それともボリュームを伴うブレイクを待っていますか? 👇
#BinanceSquare #Bitcoin #テクニカル分析 #オーダーフロー #クリプトトレーディング #VSA
火曜日のオープニングはクラシックな統合フェーズを提供してくれますが、内部のオーダーフローは、従来のキャンドルチャートでは示されない警告を発しています。
構造分析 (4H):
1. 価格の圧縮: 24時間狭いレンジに閉じ込められています。昨日の迷いのキャンドル (ドージ) は最安値を試みましたが、価格は再び$76,900近くで安定しました。
2. 流動性の欠如: ボリュームのバーは急激に減少しています。機関投資家はこの中間レンジには参加しておらず、極端なレベルで再び資本を注入するのを待っています。
3. フローのダイバージェンス (危険): 価格が静かに見える一方で、ダッシュボードの累積ボリュームデルタは明確な弱気ドミナンスを示しています (売り103.13対買い65.82)。これにより、我々のアルゴリズムは高リスクの状態にあります。
💡 取引の視点: ボリュームの確認なしにレンジの中で取引することはギャンブルです。真の機関の動きは極端なところで起こります。
このレンジで取引していますか、それともボリュームを伴うブレイクを待っていますか? 👇
#BinanceSquare #Bitcoin #テクニカル分析 #オーダーフロー #クリプトトレーディング #VSA
1
172
·
--
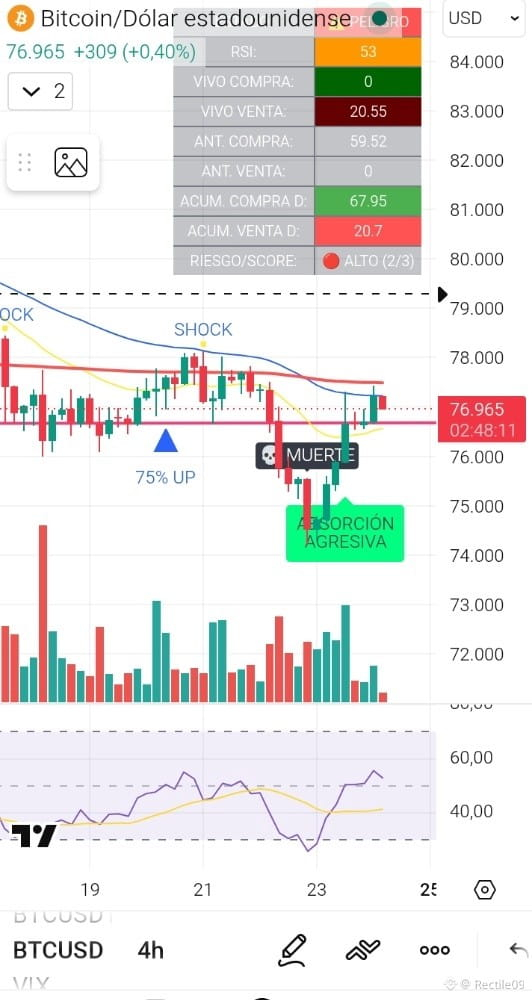
$BTC 🚨 ビットコイン 4H: "アグレッシブ・アブソープション" 確認済み。修正の終わりか、それとも騙しの反発か? 📊
ビットコインのチャートは、週末における機関投資家の動きについてのマスタークラスを提供してくれました。昨日の厳しい下落の後、価格は$76,900を回復し、明確な機関の足跡を残しました。
1. 底の解剖:
$73,400のゾーンで、私たちのオーダーフローシステムは「アグレッシブ・アブソープション」のラベルを発火させました。超高ボリュームのピークと一致し、スマートマネーは小口投資家の清算ポジションを大量に買い、完璧な反転パターン(ハンマー)を生成しました。
2. ボリュームのダイバージェンス:
ここが注意が必要なポイントです。$76,900に向けてのV字回復(キャンドル4, 5, 6)は、明らかに減少するボリュームを示しています。燃料なしでの上昇は危険です。価格は動的抵抗線(青いEMA)によって拒否されました。
3. ライブフローとリスク:
パネルは日中リスクを高い(2/3)と示しており、ライブでの売りフローは20.55に対して買いは0です。
💡 結論:ローカルの底はアグレッシブに守られましたが、現在の抵抗を破るのに必要なボリュームが不足しています。週末のクローズを待って、この反発が新たな高値を目指す力を持っているか、ダブルボトムをテストするかを確認する必要があります。
あなたは買い持ちですか、それとも確認を待っていますか? 👇
#BinanceSquare #Bitcoin #Analisis4H #スマートマネー #VSA #CryptoTrading
$BTC 🚨 ビットコイン 4H: "アグレッシブ・アブソープション" 確認済み。修正の終わりか、それとも騙しの反発か? 📊
ビットコインのチャートは、週末における機関投資家の動きについてのマスタークラスを提供してくれました。昨日の厳しい下落の後、価格は$76,900を回復し、明確な機関の足跡を残しました。
1. 底の解剖:
$73,400のゾーンで、私たちのオーダーフローシステムは「アグレッシブ・アブソープション」のラベルを発火させました。超高ボリュームのピークと一致し、スマートマネーは小口投資家の清算ポジションを大量に買い、完璧な反転パターン(ハンマー)を生成しました。
2. ボリュームのダイバージェンス:
ここが注意が必要なポイントです。$76,900に向けてのV字回復(キャンドル4, 5, 6)は、明らかに減少するボリュームを示しています。燃料なしでの上昇は危険です。価格は動的抵抗線(青いEMA)によって拒否されました。
3. ライブフローとリスク:
パネルは日中リスクを高い(2/3)と示しており、ライブでの売りフローは20.55に対して買いは0です。
💡 結論:ローカルの底はアグレッシブに守られましたが、現在の抵抗を破るのに必要なボリュームが不足しています。週末のクローズを待って、この反発が新たな高値を目指す力を持っているか、ダブルボトムをテストするかを確認する必要があります。
あなたは買い持ちですか、それとも確認を待っていますか? 👇
#BinanceSquare #Bitcoin #Analisis4H #スマートマネー #VSA #CryptoTrading
ビットコインのチャートは、週末における機関投資家の動きについてのマスタークラスを提供してくれました。昨日の厳しい下落の後、価格は$76,900を回復し、明確な機関の足跡を残しました。
1. 底の解剖:
$73,400のゾーンで、私たちのオーダーフローシステムは「アグレッシブ・アブソープション」のラベルを発火させました。超高ボリュームのピークと一致し、スマートマネーは小口投資家の清算ポジションを大量に買い、完璧な反転パターン(ハンマー)を生成しました。
2. ボリュームのダイバージェンス:
ここが注意が必要なポイントです。$76,900に向けてのV字回復(キャンドル4, 5, 6)は、明らかに減少するボリュームを示しています。燃料なしでの上昇は危険です。価格は動的抵抗線(青いEMA)によって拒否されました。
3. ライブフローとリスク:
パネルは日中リスクを高い(2/3)と示しており、ライブでの売りフローは20.55に対して買いは0です。
💡 結論:ローカルの底はアグレッシブに守られましたが、現在の抵抗を破るのに必要なボリュームが不足しています。週末のクローズを待って、この反発が新たな高値を目指す力を持っているか、ダブルボトムをテストするかを確認する必要があります。
あなたは買い持ちですか、それとも確認を待っていますか? 👇
#BinanceSquare #Bitcoin #Analisis4H #スマートマネー #VSA #CryptoTrading
1
2
380
ログインして、さらにコンテンツを読む
厳選トピックで世界の暗号資産トレーダーの仲間入り
⚡️ 暗号資産に関する最新かつ有益な情報が見つかります。
💬 世界最大の暗号資産取引所から信頼されています。
👍 認証を受けたクリエイターから、有益なインサイトを得られます。
メール / 電話番号
トレンドトピック
1
#FedRateWatch
閲覧回数 1.1M
5,350人が討論中
2
#ZcashRises6%
閲覧回数 1,805
61人が討論中
3
#XRPSinks10%
閲覧回数 460
46人が討論中
4
#BitcoinETFsShed$450M
閲覧回数 18
22人が討論中
5
#CircleOpensArcMainnet
閲覧回数 205
23人が討論中
6
#ZcashHoldersBackNU7Upgrade
閲覧回数 8,175
196人が討論中
7
#MSTRTradingVolumeSurpassesMorganStanley
閲覧回数 12,084
396人が討論中
8
#BitcoinFalls4%
閲覧回数 27,642
659人が討論中
9
#SKHynixInTalksToMakeMemoryChipsInUS
閲覧回数 12,976
279人が討論中
10
#OpenAIDiscussesNewFundingAt$1.2TValuation
閲覧回数 2,924
46人が討論中