
#tradingtips
tradingtips
閲覧回数 9.8M
22,613人が討論中
注目
最新

翻訳参照
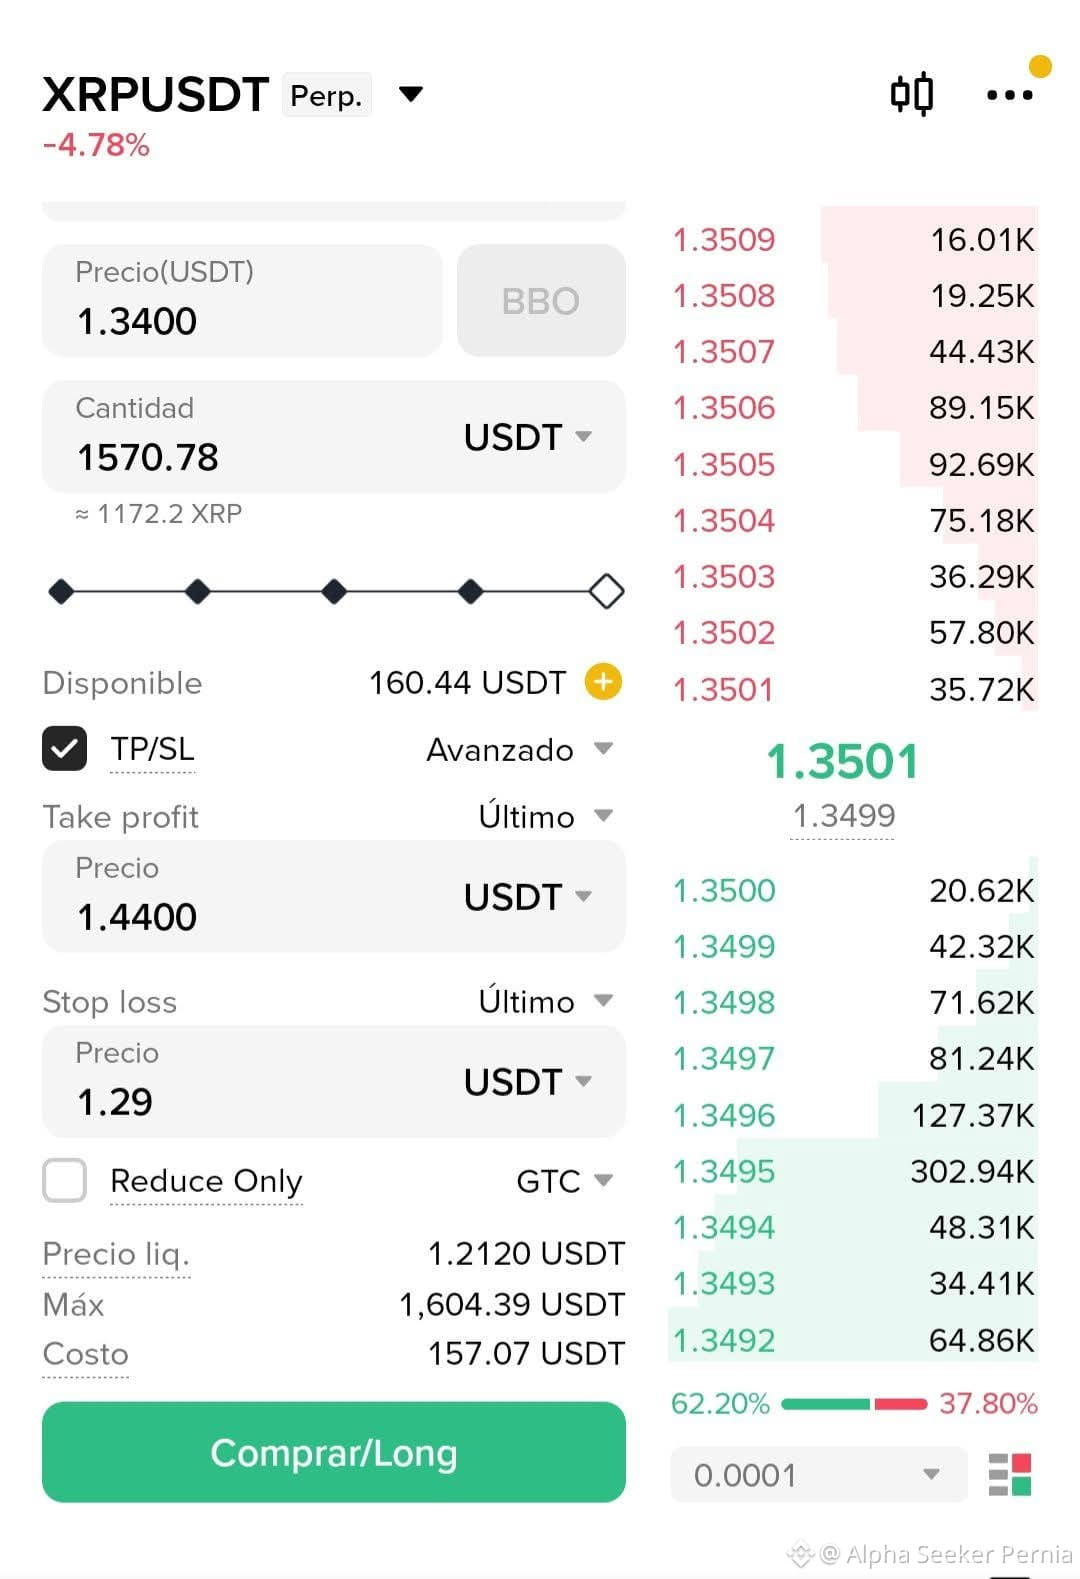
🚨 ANÁLISIS DE TRADING: Oportunidad en $XRP /$USDT 🚨
¿Pensando en entrar en $1.3400? Analizamos los pros, contras y riesgos clave de esta operación antes de presionar el botón de compra.👇
📊 El Escenario:
Entrada objetivo: $1.3400 (Orden Limit)
Take Profit (TP): $1.4400 (+7.46%)
Stop Loss (SL): $1.2900 (-3.73%)
Precio de Liquidación estimado: $1.2120
⚖️ Lo Bueno vs. Lo Malo
🟢 Puntos a favor:
Relación Riesgo/Beneficio (1:2): Arriesgas un 3.7% para buscar un 7.5%.
* TP Alcanzable: El objetivo en $1.44 es realista frente a la estructura actual.
* Zona de Soporte: Entrada estratégica en precio clave.
🔴 Puntos de cuidado:
Riesgo de Liquidación Alto: Al estar en $1.2120 (a solo un -9.5%), sugiere un apalancamiento elevado (~10x).
Momentum Bajista: Tendencia a corto plazo a la baja y por debajo de medias móviles clave.
💡 Consejos para Ejecutar Mejor:
Baja el apalancamiento: Pasa de 10x a 5x para alejar el precio de liquidación y darle aire a la posición.
Entra en fases (DCA): Divide tu capital en 2 o 3 compras escalonadas en lugar de una sola orden.
Busca confirmación: Espera una vela de rechazo o señal de rebote en el soporte antes de activar.
📌 Veredicto Final: ⚠️ MODERADAMENTE ARRIESGADA
Estructura técnica sólida con un TP prudente, pero exige control estricto del apalancamiento para no ser barrido por la volatilidad.
💬 ¿Entras ahora o esperas confirmación de rebote? ¡Te leo en los comentarios! 👇
#Xrp🔥🔥 #Ripple💰 #tradingtips
🚨 ANÁLISIS DE TRADING: Oportunidad en $XRP /$USDT 🚨
¿Pensando en entrar en $1.3400? Analizamos los pros, contras y riesgos clave de esta operación antes de presionar el botón de compra.👇
📊 El Escenario:
Entrada objetivo: $1.3400 (Orden Limit)
Take Profit (TP): $1.4400 (+7.46%)
Stop Loss (SL): $1.2900 (-3.73%)
Precio de Liquidación estimado: $1.2120
⚖️ Lo Bueno vs. Lo Malo
🟢 Puntos a favor:
Relación Riesgo/Beneficio (1:2): Arriesgas un 3.7% para buscar un 7.5%.
* TP Alcanzable: El objetivo en $1.44 es realista frente a la estructura actual.
* Zona de Soporte: Entrada estratégica en precio clave.
🔴 Puntos de cuidado:
Riesgo de Liquidación Alto: Al estar en $1.2120 (a solo un -9.5%), sugiere un apalancamiento elevado (~10x).
Momentum Bajista: Tendencia a corto plazo a la baja y por debajo de medias móviles clave.
💡 Consejos para Ejecutar Mejor:
Baja el apalancamiento: Pasa de 10x a 5x para alejar el precio de liquidación y darle aire a la posición.
Entra en fases (DCA): Divide tu capital en 2 o 3 compras escalonadas en lugar de una sola orden.
Busca confirmación: Espera una vela de rechazo o señal de rebote en el soporte antes de activar.
📌 Veredicto Final: ⚠️ MODERADAMENTE ARRIESGADA
Estructura técnica sólida con un TP prudente, pero exige control estricto del apalancamiento para no ser barrido por la volatilidad.
💬 ¿Entras ahora o esperas confirmación de rebote? ¡Te leo en los comentarios! 👇
#Xrp🔥🔥 #Ripple💰 #tradingtips
¿Pensando en entrar en $1.3400? Analizamos los pros, contras y riesgos clave de esta operación antes de presionar el botón de compra.👇
📊 El Escenario:
Entrada objetivo: $1.3400 (Orden Limit)
Take Profit (TP): $1.4400 (+7.46%)
Stop Loss (SL): $1.2900 (-3.73%)
Precio de Liquidación estimado: $1.2120
⚖️ Lo Bueno vs. Lo Malo
🟢 Puntos a favor:
Relación Riesgo/Beneficio (1:2): Arriesgas un 3.7% para buscar un 7.5%.
* TP Alcanzable: El objetivo en $1.44 es realista frente a la estructura actual.
* Zona de Soporte: Entrada estratégica en precio clave.
🔴 Puntos de cuidado:
Riesgo de Liquidación Alto: Al estar en $1.2120 (a solo un -9.5%), sugiere un apalancamiento elevado (~10x).
Momentum Bajista: Tendencia a corto plazo a la baja y por debajo de medias móviles clave.
💡 Consejos para Ejecutar Mejor:
Baja el apalancamiento: Pasa de 10x a 5x para alejar el precio de liquidación y darle aire a la posición.
Entra en fases (DCA): Divide tu capital en 2 o 3 compras escalonadas en lugar de una sola orden.
Busca confirmación: Espera una vela de rechazo o señal de rebote en el soporte antes de activar.
📌 Veredicto Final: ⚠️ MODERADAMENTE ARRIESGADA
Estructura técnica sólida con un TP prudente, pero exige control estricto del apalancamiento para no ser barrido por la volatilidad.
💬 ¿Entras ahora o esperas confirmación de rebote? ¡Te leo en los comentarios! 👇
#Xrp🔥🔥 #Ripple💰 #tradingtips
ZONAOESTEVO:
viene en caída libre BTC también
1
2
3k

·
--
ブリッシュ
$JTO の分析 .. 反発が底から始まり、爆発がまもなく来る 🚀🔥
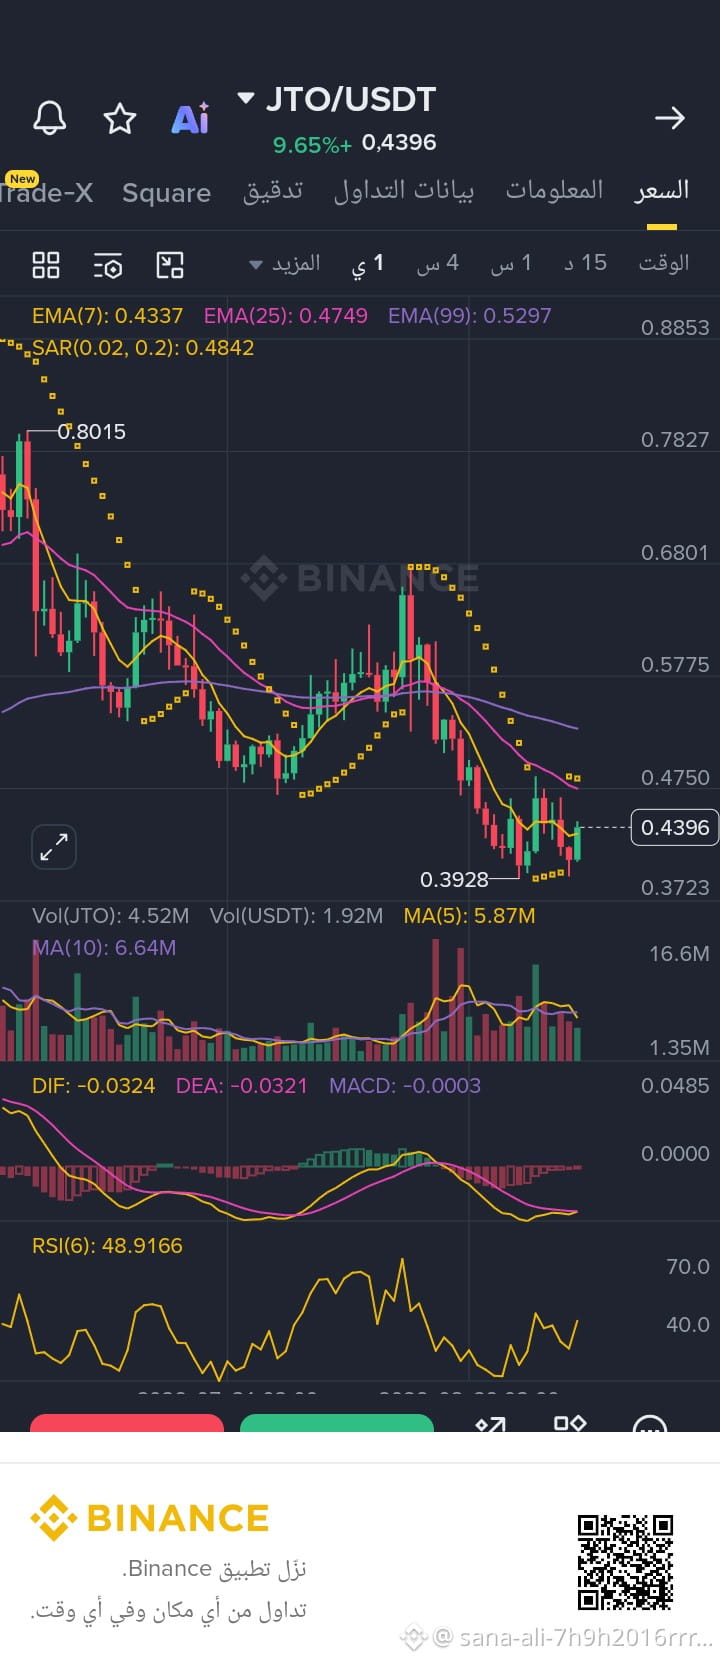
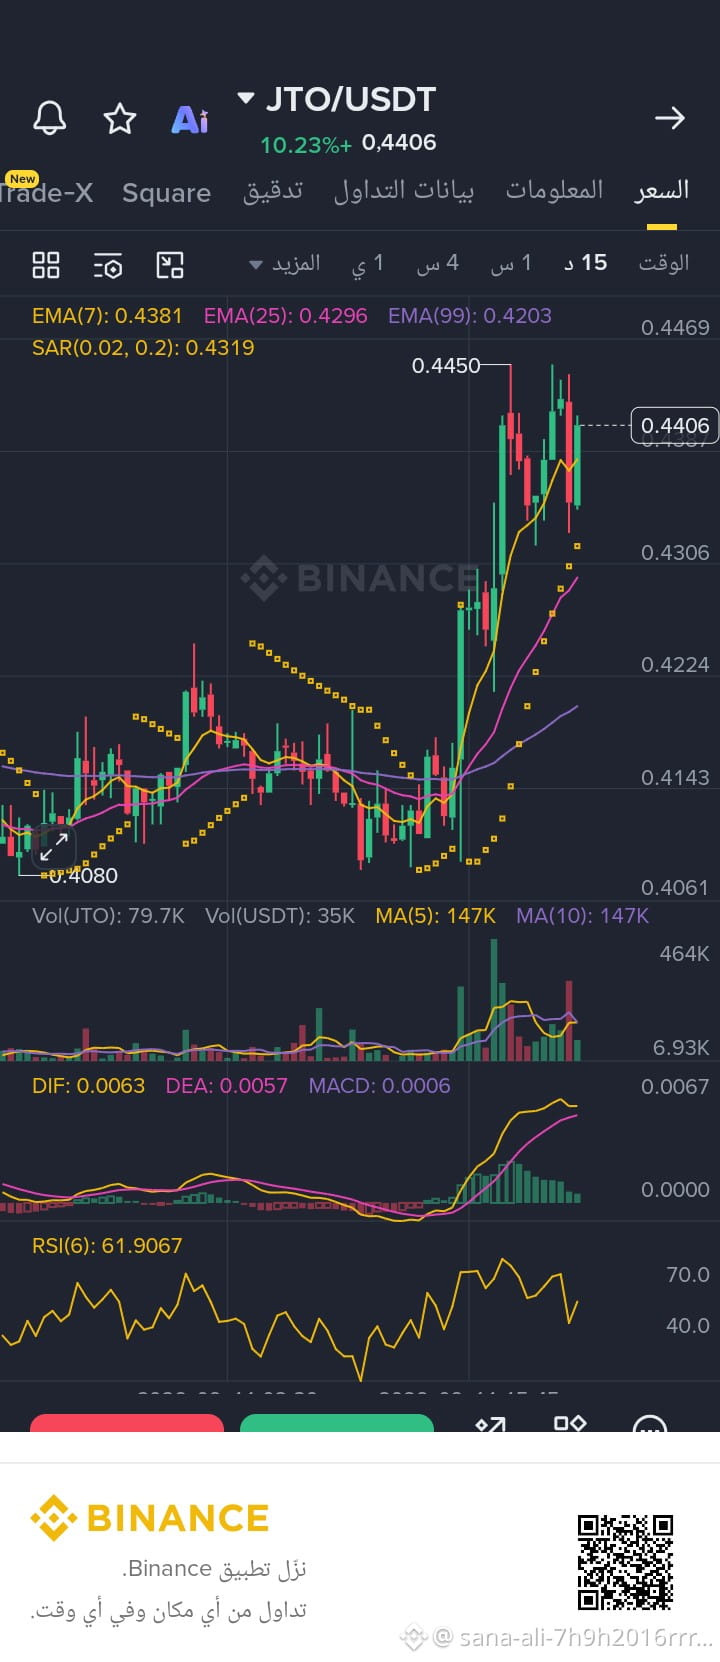
$JTO は、0.3928で典型的な反発の底を形成し、現在は4時間足のチャートに強い買いの資金(流動性)が入ったことで、サイン全てが緑に変わっています
🧐 テクニカル分析:
日足では:下落圧力が終了し、反発のための集積型のローソクが始まっています
4時間足および15分足では:EMA7とEMA25の平均線の上をブレイクし、そこに定着しており、買いボリュームも非常に良好。サポート線とSARの上で安定した、いまの上昇トレンドです
🎯 売買プラン:
⬅️ 現在のエントリー価格:0.4350〜0.4410はとても良い
🔒 強い確認条件:近いレジスタンス0.4450をブレイクし、その上で終値すること
🎯 目標:
第1目標:0.4600
第2目標:0.4860
第3目標:0.5290
🛑 損切り:4時間足のローソクを0.4150の水準より下でクローズしたら
⚠️ 忘れないで:資金は全額で入らず、必ず損切りを実行して資本を守ってください .. みなさんに幸運を 🤲💵
#CryptoAnalysis #CryptoAnalysis #TradingTips #TechnicalAnalysis #تحليل_العملات_الرقمية #تداول_فوري
{spot}(JTOUSDT)
$JTO の分析 .. 反発が底から始まり、爆発がまもなく来る 🚀🔥
$JTO は、0.3928で典型的な反発の底を形成し、現在は4時間足のチャートに強い買いの資金(流動性)が入ったことで、サイン全てが緑に変わっています
🧐 テクニカル分析:
日足では:下落圧力が終了し、反発のための集積型のローソクが始まっています
4時間足および15分足では:EMA7とEMA25の平均線の上をブレイクし、そこに定着しており、買いボリュームも非常に良好。サポート線とSARの上で安定した、いまの上昇トレンドです
🎯 売買プラン:
⬅️ 現在のエントリー価格:0.4350〜0.4410はとても良い
🔒 強い確認条件:近いレジスタンス0.4450をブレイクし、その上で終値すること
🎯 目標:
第1目標:0.4600
第2目標:0.4860
第3目標:0.5290
🛑 損切り:4時間足のローソクを0.4150の水準より下でクローズしたら
⚠️ 忘れないで:資金は全額で入らず、必ず損切りを実行して資本を守ってください .. みなさんに幸運を 🤲💵
#CryptoAnalysis #CryptoAnalysis #TradingTips #TechnicalAnalysis #تحليل_العملات_الرقمية #تداول_فوري
$JTO は、0.3928で典型的な反発の底を形成し、現在は4時間足のチャートに強い買いの資金(流動性)が入ったことで、サイン全てが緑に変わっています
🧐 テクニカル分析:
日足では:下落圧力が終了し、反発のための集積型のローソクが始まっています
4時間足および15分足では:EMA7とEMA25の平均線の上をブレイクし、そこに定着しており、買いボリュームも非常に良好。サポート線とSARの上で安定した、いまの上昇トレンドです
🎯 売買プラン:
⬅️ 現在のエントリー価格:0.4350〜0.4410はとても良い
🔒 強い確認条件:近いレジスタンス0.4450をブレイクし、その上で終値すること
🎯 目標:
第1目標:0.4600
第2目標:0.4860
第3目標:0.5290
🛑 損切り:4時間足のローソクを0.4150の水準より下でクローズしたら
⚠️ 忘れないで:資金は全額で入らず、必ず損切りを実行して資本を守ってください .. みなさんに幸運を 🤲💵
#CryptoAnalysis #CryptoAnalysis #TradingTips #TechnicalAnalysis #تحليل_العملات_الرقمية #تداول_فوري

1
41

·
--
翻訳参照
Most people place stops at round percentages. That’s not where the stop belongs.
For $KORUB, price is $23.1100.
The last 1h swing low is 21.1200.
That’s the level that proves your long thesis wrong.
The 1h ATR is 1.9% of price that’s 0.439.
A stop at 22.67 would get hit by normal noise.
A stop at 21.12 waits for real failure.
Place your stop below the last confirmed swing low. Not below a percentage.
What’s your rule for where the stop actually belongs?
#TradingTips #KORUB
Not financial advice. My levels, my risk.
Most people place stops at round percentages. That’s not where the stop belongs.
For $KORUB , price is $23.1100.
The last 1h swing low is 21.1200.
That’s the level that proves your long thesis wrong.
The 1h ATR is 1.9% of price that’s 0.439.
A stop at 22.67 would get hit by normal noise.
A stop at 21.12 waits for real failure.
Place your stop below the last confirmed swing low. Not below a percentage.
What’s your rule for where the stop actually belongs?
#TradingTips #KORUB
Not financial advice. My levels, my risk.
For $KORUB , price is $23.1100.
The last 1h swing low is 21.1200.
That’s the level that proves your long thesis wrong.
The 1h ATR is 1.9% of price that’s 0.439.
A stop at 22.67 would get hit by normal noise.
A stop at 21.12 waits for real failure.
Place your stop below the last confirmed swing low. Not below a percentage.
What’s your rule for where the stop actually belongs?
#TradingTips #KORUB
Not financial advice. My levels, my risk.
2
·
--
翻訳参照
Most traders ignore volume confirmation and chase price alone.
$NEAR is up 0.4% today but volume is $96.6M 1.4x the 7-day average of 69M.
That’s 96.6 divided by 69 = 1.4.
A move with volume behind it means buyers are actively stepping in.
A move without it is just noise price drifting with no conviction.
Check it in 20 seconds: go to Binance, scroll to 24h volume, divide by 7-day average.
On my next trade, I wait for volume >1.2x average before considering any breakout.
What’s your rule for confirming volume?
#TradingTips #NEAR
Not financial advice. My levels, my risk.
Most traders ignore volume confirmation and chase price alone.
$NEAR is up 0.4% today but volume is $96.6M 1.4x the 7-day average of 69M.
That’s 96.6 divided by 69 = 1.4.
A move with volume behind it means buyers are actively stepping in.
A move without it is just noise price drifting with no conviction.
Check it in 20 seconds: go to Binance, scroll to 24h volume, divide by 7-day average.
On my next trade, I wait for volume >1.2x average before considering any breakout.
What’s your rule for confirming volume?
#TradingTips #NEAR
Not financial advice. My levels, my risk.
$NEAR is up 0.4% today but volume is $96.6M 1.4x the 7-day average of 69M.
That’s 96.6 divided by 69 = 1.4.
A move with volume behind it means buyers are actively stepping in.
A move without it is just noise price drifting with no conviction.
Check it in 20 seconds: go to Binance, scroll to 24h volume, divide by 7-day average.
On my next trade, I wait for volume >1.2x average before considering any breakout.
What’s your rule for confirming volume?
#TradingTips #NEAR
Not financial advice. My levels, my risk.
39

翻訳参照
Demystifying Market Depth: How Order Books Shape Crypto Price MovementWhen observing financial markets, most traders rely heavily on standard candlestick charts. These charts showcase historical price actions—where the price opened, closed, peaked, and bottomed over specific timeframes. While historical price action is essential, it only tells half the story. It tells you where the market has been, but it provides little structural insight into how easily the market can move right now.
To understand how price movements actually occur under the hood, traders must look beyond price candles and evaluate market depth. Market depth offers a real-time window into pending buy and sell interest across different price levels. Understanding this visual and mathematical landscape is a crucial step for intermediate traders looking to refine their execution, manage trading costs, and avoid common market execution traps.
### What is Market Depth?
At its core, market depth refers to the market's ability to absorb relatively large market orders without causing significant price fluctuations. It represents the aggregate volume of outstanding limit orders positioned on both sides of an asset’s current market price.
Every centralized exchange operates an electronic matching engine powered by an order book. This order book contains two main sides:
1. **The Bid Side (Buyers):** A list of traders offering to purchase the asset at specific prices below the current market price.
2. **The Ask or Offer Side (Sellers):** A list of traders offering to sell the asset at specific prices above the current market price.
Market depth visualizes these limit orders, typically through a depth chart or an aggregated order book ladder. The horizontal axis represents price levels, while the vertical axis (or cumulative volume total) shows the quantity of the asset available at those price points.
### Market Volume vs. Market Depth: A Key Distinction
It is easy to confuse trading volume with market depth, yet they measure fundamentally different mechanics:
* **Trading Volume** is a backward-looking metric. It measures the total amount of an asset that has successfully changed hands over a given period (such as 24 hours). High historical volume indicates robust past activity, but it does not guarantee immediate liquidity.
* **Market Depth** is a present-moment metric. It measures the volume of orders currently sitting in the order book, waiting to be matched.
An asset might boast millions of dollars in 24-hour volume due to rapid back-and-forth trading, but if its active order book contains very few resting orders near the spot price, a single large order can easily push the price up or down significantly.
### Core Components of Order Book Depth
To read market depth effectively, traders must understand three essential elements:
#### 1. The Bid-Ask Spread
The distance between the highest price a buyer is willing to pay (best bid) and the lowest price a seller is willing to accept (best ask) is called the spread. Tight spreads generally signal high market depth and liquid conditions, while wide spreads suggest lower liquidity and higher trading friction.
#### 2. Market Slippage
When you execute a market order, the exchange matches your order against existing limit orders in the book. If your order size exceeds the volume available at the best bid or ask, the matching engine continues filling the remainder of your order at progressively worse prices deeper into the book. This difference between your expected fill price and your actual average execution price is known as slippage.
#### 3. Depth Walls (Buy and Sell Walls)
When viewing a visual market depth chart, you will frequently notice steep vertical steps on either side of the price curve. These are known as order walls.
* **Buy Wall:** Occurs when a massive concentration of buy limit orders exists at a specific price level. This creates a psychological and financial barrier, as sellers must exhaust all that buy liquidity before the price can push lower.
* **Sell Wall:** Occurs when a massive concentration of sell limit orders sits at a specific price. Buyers must purchase all available inventory at that level before the price can climb higher.
### Practical Example: The Mechanics of Execution
To understand how depth affects your trade, consider a practical scenario involving an asset traded on an exchange.
Imagine Asset X is currently trading at $100.00. You decide to place a market buy order for 1,000 units of Asset X.
Let's examine two different market depth scenarios:
**Scenario A: Deep Market Depth**
* Best Ask: $100.05 (500 units available)
* Second Ask: $100.10 (500 units available)
* **Result:** Your order is filled in two parts—500 units at $100.05 and 500 units at $100.10. Your average execution price is $100.075. Slippage is negligible (less than 0.08%).
**Scenario B: Thin Market Depth**
* Best Ask: $100.05 (100 units available)
* Second Ask: $101.00 (200 units available)
* Third Ask: $103.00 (700 units available)
* **Result:** Your order matches 100 units at $100.05, 200 units at $101.00, and 700 units at $103.00. Your average execution price jumps to approximately $102.30. You suffered over 2.3% in slippage simply due to poor market depth.
This example highlights why market order execution on low-depth assets can severely impair overall trading performance, even if your directional bias was correct.
### Advanced Order Book Dynamics
Market depth is not static; it is a dynamic environment driven by automated market makers, institutional algorithmic execution engines, and retail participants.
* **Algorithmic Market Making:** Automated programs continuously quote buy and sell prices, capturing the bid-ask spread while providing liquidity to the order book. When market volatility spikes, these algorithms often retreat or widen their spreads to mitigate risk, causing market depth to evaporate rapidly.
* **Iceberg Orders:** Large traders often wish to hide their true execution intentions to prevent the market from moving against them. They use iceberg orders, which divide a massive order into small visible portions. As soon as one visible chunk is filled, the system automatically posts the next chunk. Therefore, the visible order book depth may not always represent the full extent of true market liquidity.
### Risks, Limitations, and Misconceptions
While evaluating order book depth provides valuable insights, relying on static depth snapshots carries inherent risks:
#### 1. Phantom Liquidity and Spoofing
Not every order in the book is intended to be executed. Spoofing is an illegal or manipulative tactic where market actors place massive fake orders (buy or sell walls) to create a false impression of support or resistance. As soon as the market price approaches these orders, the manipulator cancels them. Expecting a buy wall to act as a guaranteed price floor can lead to costly mistakes.
#### 2. Fragmented Liquidity
Unlike traditional financial markets that rely on centralized clearinghouses, the cryptocurrency landscape is highly fragmented. Liquidity is split across dozens of centralized exchanges, decentralized exchanges, and over-the-counter desks. A token might exhibit deep order book liquidity on one exchange venue while remaining virtually illiquid on another. Looking at depth on a single platform provides only a partial view of global liquidity.
#### 3. Rapid Order Cancellation During Volatility
During sharp macro announcements or sudden price breakouts, limit order books can empty within milliseconds. Limit orders placed by liquidity providers represent commitment; when extreme volatility hits, market makers quickly cancel their orders to avoid being caught on the wrong side of a major trend. Consequently, depth that exists during quiet market conditions often disappears when you need it most.
### Practical Checklist for Intermediate Traders
1. **Match Order Type to Liquidity:** For large trade sizes relative to the asset’s order book depth, utilize limit orders, Time-Weighted Average Price (TWAP) algorithms, or scale into positions gradually rather than relying on standard market orders.
2. **Monitor 1% and 2% Depth Metrics:** Instead of focusing only on the spot price, monitor how much capital is required to move the price by 1% or 2% in either direction. This metric provides a far clearer picture of true market resilience.
3. **Beware of Single Wall Signals:** Avoid using large order book walls as isolated entry or exit triggers. Treat them as dynamic indicators that require confirmation from volume and price action tools.
4. **Verify Venue-Specific Depth:** Always verify execution depth specifically on the exchange venue where you intend to place your order.
### Conclusion
Market depth is the foundational structural layer that governs price formation and trade execution across crypto markets. By moving beyond historic price action and mastering the mechanics of order books, bid-ask spreads, and liquidity distribution, traders can protect themselves from unnecessary slippage, avoid market manipulation traps, and execute orders with far greater precision.
#CryptoEducation #TradingTips #MarketDepth
Demystifying Market Depth: How Order Books Shape Crypto Price Movement
When observing financial markets, most traders rely heavily on standard candlestick charts. These charts showcase historical price actions—where the price opened, closed, peaked, and bottomed over specific timeframes. While historical price action is essential, it only tells half the story. It tells you where the market has been, but it provides little structural insight into how easily the market can move right now.
To understand how price movements actually occur under the hood, traders must look beyond price candles and evaluate market depth. Market depth offers a real-time window into pending buy and sell interest across different price levels. Understanding this visual and mathematical landscape is a crucial step for intermediate traders looking to refine their execution, manage trading costs, and avoid common market execution traps.
### What is Market Depth?
At its core, market depth refers to the market's ability to absorb relatively large market orders without causing significant price fluctuations. It represents the aggregate volume of outstanding limit orders positioned on both sides of an asset’s current market price.
Every centralized exchange operates an electronic matching engine powered by an order book. This order book contains two main sides:
1. **The Bid Side (Buyers):** A list of traders offering to purchase the asset at specific prices below the current market price.
2. **The Ask or Offer Side (Sellers):** A list of traders offering to sell the asset at specific prices above the current market price.
Market depth visualizes these limit orders, typically through a depth chart or an aggregated order book ladder. The horizontal axis represents price levels, while the vertical axis (or cumulative volume total) shows the quantity of the asset available at those price points.
### Market Volume vs. Market Depth: A Key Distinction
It is easy to confuse trading volume with market depth, yet they measure fundamentally different mechanics:
* **Trading Volume** is a backward-looking metric. It measures the total amount of an asset that has successfully changed hands over a given period (such as 24 hours). High historical volume indicates robust past activity, but it does not guarantee immediate liquidity.
* **Market Depth** is a present-moment metric. It measures the volume of orders currently sitting in the order book, waiting to be matched.
An asset might boast millions of dollars in 24-hour volume due to rapid back-and-forth trading, but if its active order book contains very few resting orders near the spot price, a single large order can easily push the price up or down significantly.
### Core Components of Order Book Depth
To read market depth effectively, traders must understand three essential elements:
#### 1. The Bid-Ask Spread
The distance between the highest price a buyer is willing to pay (best bid) and the lowest price a seller is willing to accept (best ask) is called the spread. Tight spreads generally signal high market depth and liquid conditions, while wide spreads suggest lower liquidity and higher trading friction.
#### 2. Market Slippage
When you execute a market order, the exchange matches your order against existing limit orders in the book. If your order size exceeds the volume available at the best bid or ask, the matching engine continues filling the remainder of your order at progressively worse prices deeper into the book. This difference between your expected fill price and your actual average execution price is known as slippage.
#### 3. Depth Walls (Buy and Sell Walls)
When viewing a visual market depth chart, you will frequently notice steep vertical steps on either side of the price curve. These are known as order walls.
* **Buy Wall:** Occurs when a massive concentration of buy limit orders exists at a specific price level. This creates a psychological and financial barrier, as sellers must exhaust all that buy liquidity before the price can push lower.
* **Sell Wall:** Occurs when a massive concentration of sell limit orders sits at a specific price. Buyers must purchase all available inventory at that level before the price can climb higher.
### Practical Example: The Mechanics of Execution
To understand how depth affects your trade, consider a practical scenario involving an asset traded on an exchange.
Imagine Asset X is currently trading at $100.00. You decide to place a market buy order for 1,000 units of Asset X.
Let's examine two different market depth scenarios:
**Scenario A: Deep Market Depth**
* Best Ask: $100.05 (500 units available)
* Second Ask: $100.10 (500 units available)
* **Result:** Your order is filled in two parts—500 units at $100.05 and 500 units at $100.10. Your average execution price is $100.075. Slippage is negligible (less than 0.08%).
**Scenario B: Thin Market Depth**
* Best Ask: $100.05 (100 units available)
* Second Ask: $101.00 (200 units available)
* Third Ask: $103.00 (700 units available)
* **Result:** Your order matches 100 units at $100.05, 200 units at $101.00, and 700 units at $103.00. Your average execution price jumps to approximately $102.30. You suffered over 2.3% in slippage simply due to poor market depth.
This example highlights why market order execution on low-depth assets can severely impair overall trading performance, even if your directional bias was correct.
### Advanced Order Book Dynamics
Market depth is not static; it is a dynamic environment driven by automated market makers, institutional algorithmic execution engines, and retail participants.
* **Algorithmic Market Making:** Automated programs continuously quote buy and sell prices, capturing the bid-ask spread while providing liquidity to the order book. When market volatility spikes, these algorithms often retreat or widen their spreads to mitigate risk, causing market depth to evaporate rapidly.
* **Iceberg Orders:** Large traders often wish to hide their true execution intentions to prevent the market from moving against them. They use iceberg orders, which divide a massive order into small visible portions. As soon as one visible chunk is filled, the system automatically posts the next chunk. Therefore, the visible order book depth may not always represent the full extent of true market liquidity.
### Risks, Limitations, and Misconceptions
While evaluating order book depth provides valuable insights, relying on static depth snapshots carries inherent risks:
#### 1. Phantom Liquidity and Spoofing
Not every order in the book is intended to be executed. Spoofing is an illegal or manipulative tactic where market actors place massive fake orders (buy or sell walls) to create a false impression of support or resistance. As soon as the market price approaches these orders, the manipulator cancels them. Expecting a buy wall to act as a guaranteed price floor can lead to costly mistakes.
#### 2. Fragmented Liquidity
Unlike traditional financial markets that rely on centralized clearinghouses, the cryptocurrency landscape is highly fragmented. Liquidity is split across dozens of centralized exchanges, decentralized exchanges, and over-the-counter desks. A token might exhibit deep order book liquidity on one exchange venue while remaining virtually illiquid on another. Looking at depth on a single platform provides only a partial view of global liquidity.
#### 3. Rapid Order Cancellation During Volatility
During sharp macro announcements or sudden price breakouts, limit order books can empty within milliseconds. Limit orders placed by liquidity providers represent commitment; when extreme volatility hits, market makers quickly cancel their orders to avoid being caught on the wrong side of a major trend. Consequently, depth that exists during quiet market conditions often disappears when you need it most.
### Practical Checklist for Intermediate Traders
1. **Match Order Type to Liquidity:** For large trade sizes relative to the asset’s order book depth, utilize limit orders, Time-Weighted Average Price (TWAP) algorithms, or scale into positions gradually rather than relying on standard market orders.
2. **Monitor 1% and 2% Depth Metrics:** Instead of focusing only on the spot price, monitor how much capital is required to move the price by 1% or 2% in either direction. This metric provides a far clearer picture of true market resilience.
3. **Beware of Single Wall Signals:** Avoid using large order book walls as isolated entry or exit triggers. Treat them as dynamic indicators that require confirmation from volume and price action tools.
4. **Verify Venue-Specific Depth:** Always verify execution depth specifically on the exchange venue where you intend to place your order.
### Conclusion
Market depth is the foundational structural layer that governs price formation and trade execution across crypto markets. By moving beyond historic price action and mastering the mechanics of order books, bid-ask spreads, and liquidity distribution, traders can protect themselves from unnecessary slippage, avoid market manipulation traps, and execute orders with far greater precision.
#CryptoEducation #TradingTips #MarketDepth
To understand how price movements actually occur under the hood, traders must look beyond price candles and evaluate market depth. Market depth offers a real-time window into pending buy and sell interest across different price levels. Understanding this visual and mathematical landscape is a crucial step for intermediate traders looking to refine their execution, manage trading costs, and avoid common market execution traps.
### What is Market Depth?
At its core, market depth refers to the market's ability to absorb relatively large market orders without causing significant price fluctuations. It represents the aggregate volume of outstanding limit orders positioned on both sides of an asset’s current market price.
Every centralized exchange operates an electronic matching engine powered by an order book. This order book contains two main sides:
1. **The Bid Side (Buyers):** A list of traders offering to purchase the asset at specific prices below the current market price.
2. **The Ask or Offer Side (Sellers):** A list of traders offering to sell the asset at specific prices above the current market price.
Market depth visualizes these limit orders, typically through a depth chart or an aggregated order book ladder. The horizontal axis represents price levels, while the vertical axis (or cumulative volume total) shows the quantity of the asset available at those price points.
### Market Volume vs. Market Depth: A Key Distinction
It is easy to confuse trading volume with market depth, yet they measure fundamentally different mechanics:
* **Trading Volume** is a backward-looking metric. It measures the total amount of an asset that has successfully changed hands over a given period (such as 24 hours). High historical volume indicates robust past activity, but it does not guarantee immediate liquidity.
* **Market Depth** is a present-moment metric. It measures the volume of orders currently sitting in the order book, waiting to be matched.
An asset might boast millions of dollars in 24-hour volume due to rapid back-and-forth trading, but if its active order book contains very few resting orders near the spot price, a single large order can easily push the price up or down significantly.
### Core Components of Order Book Depth
To read market depth effectively, traders must understand three essential elements:
#### 1. The Bid-Ask Spread
The distance between the highest price a buyer is willing to pay (best bid) and the lowest price a seller is willing to accept (best ask) is called the spread. Tight spreads generally signal high market depth and liquid conditions, while wide spreads suggest lower liquidity and higher trading friction.
#### 2. Market Slippage
When you execute a market order, the exchange matches your order against existing limit orders in the book. If your order size exceeds the volume available at the best bid or ask, the matching engine continues filling the remainder of your order at progressively worse prices deeper into the book. This difference between your expected fill price and your actual average execution price is known as slippage.
#### 3. Depth Walls (Buy and Sell Walls)
When viewing a visual market depth chart, you will frequently notice steep vertical steps on either side of the price curve. These are known as order walls.
* **Buy Wall:** Occurs when a massive concentration of buy limit orders exists at a specific price level. This creates a psychological and financial barrier, as sellers must exhaust all that buy liquidity before the price can push lower.
* **Sell Wall:** Occurs when a massive concentration of sell limit orders sits at a specific price. Buyers must purchase all available inventory at that level before the price can climb higher.
### Practical Example: The Mechanics of Execution
To understand how depth affects your trade, consider a practical scenario involving an asset traded on an exchange.
Imagine Asset X is currently trading at $100.00. You decide to place a market buy order for 1,000 units of Asset X.
Let's examine two different market depth scenarios:
**Scenario A: Deep Market Depth**
* Best Ask: $100.05 (500 units available)
* Second Ask: $100.10 (500 units available)
* **Result:** Your order is filled in two parts—500 units at $100.05 and 500 units at $100.10. Your average execution price is $100.075. Slippage is negligible (less than 0.08%).
**Scenario B: Thin Market Depth**
* Best Ask: $100.05 (100 units available)
* Second Ask: $101.00 (200 units available)
* Third Ask: $103.00 (700 units available)
* **Result:** Your order matches 100 units at $100.05, 200 units at $101.00, and 700 units at $103.00. Your average execution price jumps to approximately $102.30. You suffered over 2.3% in slippage simply due to poor market depth.
This example highlights why market order execution on low-depth assets can severely impair overall trading performance, even if your directional bias was correct.
### Advanced Order Book Dynamics
Market depth is not static; it is a dynamic environment driven by automated market makers, institutional algorithmic execution engines, and retail participants.
* **Algorithmic Market Making:** Automated programs continuously quote buy and sell prices, capturing the bid-ask spread while providing liquidity to the order book. When market volatility spikes, these algorithms often retreat or widen their spreads to mitigate risk, causing market depth to evaporate rapidly.
* **Iceberg Orders:** Large traders often wish to hide their true execution intentions to prevent the market from moving against them. They use iceberg orders, which divide a massive order into small visible portions. As soon as one visible chunk is filled, the system automatically posts the next chunk. Therefore, the visible order book depth may not always represent the full extent of true market liquidity.
### Risks, Limitations, and Misconceptions
While evaluating order book depth provides valuable insights, relying on static depth snapshots carries inherent risks:
#### 1. Phantom Liquidity and Spoofing
Not every order in the book is intended to be executed. Spoofing is an illegal or manipulative tactic where market actors place massive fake orders (buy or sell walls) to create a false impression of support or resistance. As soon as the market price approaches these orders, the manipulator cancels them. Expecting a buy wall to act as a guaranteed price floor can lead to costly mistakes.
#### 2. Fragmented Liquidity
Unlike traditional financial markets that rely on centralized clearinghouses, the cryptocurrency landscape is highly fragmented. Liquidity is split across dozens of centralized exchanges, decentralized exchanges, and over-the-counter desks. A token might exhibit deep order book liquidity on one exchange venue while remaining virtually illiquid on another. Looking at depth on a single platform provides only a partial view of global liquidity.
#### 3. Rapid Order Cancellation During Volatility
During sharp macro announcements or sudden price breakouts, limit order books can empty within milliseconds. Limit orders placed by liquidity providers represent commitment; when extreme volatility hits, market makers quickly cancel their orders to avoid being caught on the wrong side of a major trend. Consequently, depth that exists during quiet market conditions often disappears when you need it most.
### Practical Checklist for Intermediate Traders
1. **Match Order Type to Liquidity:** For large trade sizes relative to the asset’s order book depth, utilize limit orders, Time-Weighted Average Price (TWAP) algorithms, or scale into positions gradually rather than relying on standard market orders.
2. **Monitor 1% and 2% Depth Metrics:** Instead of focusing only on the spot price, monitor how much capital is required to move the price by 1% or 2% in either direction. This metric provides a far clearer picture of true market resilience.
3. **Beware of Single Wall Signals:** Avoid using large order book walls as isolated entry or exit triggers. Treat them as dynamic indicators that require confirmation from volume and price action tools.
4. **Verify Venue-Specific Depth:** Always verify execution depth specifically on the exchange venue where you intend to place your order.
### Conclusion
Market depth is the foundational structural layer that governs price formation and trade execution across crypto markets. By moving beyond historic price action and mastering the mechanics of order books, bid-ask spreads, and liquidity distribution, traders can protect themselves from unnecessary slippage, avoid market manipulation traps, and execute orders with far greater precision.
#CryptoEducation #TradingTips #MarketDepth
53

翻訳参照
Crypto trading is 10% buying, 10% selling, and 80% waiting.
Successful traders don’t chase every pump; they wait for the right setup. Control your emotions before the market controls your wallet. 🚀
Stay patient, stay informed!"
#CryptoMindset #tradingtips #HODL #Binance
Crypto trading is 10% buying, 10% selling, and 80% waiting.
Successful traders don’t chase every pump; they wait for the right setup. Control your emotions before the market controls your wallet. 🚀
Stay patient, stay informed!"
#CryptoMindset #tradingtips #HODL #Binance
Successful traders don’t chase every pump; they wait for the right setup. Control your emotions before the market controls your wallet. 🚀
Stay patient, stay informed!"
#CryptoMindset #tradingtips #HODL #Binance
1
63
·
--
翻訳参照
Chasing the top gainer loses because you’re buying from the people who just sold high.
$BLUR is up 14.2% but sitting at 45% of its 24h range ($0.01594 to $0.02207).
That means half the daily price action has already happened.
The 1h swing high was $0.02207 price is now 15.3% below that.
Volume is 17.1x the 7-day average most buyers entered earlier.
The last 1h swing low was $0.01594 if price drops back there, it’s a retest of support.
Who’s selling now? The early buyers taking profit at the top of the range.
I wait for price to retest the lower end of the range with volume dropping below average.
What’s your rule for avoiding the top gainer trap?
#TradingTips #BLUR
Not financial advice. My levels, my risk.
Chasing the top gainer loses because you’re buying from the people who just sold high.
$BLUR is up 14.2% but sitting at 45% of its 24h range ($0.01594 to $0.02207).
That means half the daily price action has already happened.
The 1h swing high was $0.02207 price is now 15.3% below that.
Volume is 17.1x the 7-day average most buyers entered earlier.
The last 1h swing low was $0.01594 if price drops back there, it’s a retest of support.
Who’s selling now? The early buyers taking profit at the top of the range.
I wait for price to retest the lower end of the range with volume dropping below average.
What’s your rule for avoiding the top gainer trap?
#TradingTips #BLUR
Not financial advice. My levels, my risk.
$BLUR is up 14.2% but sitting at 45% of its 24h range ($0.01594 to $0.02207).
That means half the daily price action has already happened.
The 1h swing high was $0.02207 price is now 15.3% below that.
Volume is 17.1x the 7-day average most buyers entered earlier.
The last 1h swing low was $0.01594 if price drops back there, it’s a retest of support.
Who’s selling now? The early buyers taking profit at the top of the range.
I wait for price to retest the lower end of the range with volume dropping below average.
What’s your rule for avoiding the top gainer trap?
#TradingTips #BLUR
Not financial advice. My levels, my risk.
17

翻訳参照
📊 Bitcoin Market Update & Next Targets
Bitcoin is currently showing strong price action around key resistance levels. Volume is steadily increasing, which suggests potential bullish momentum if we hold above the major support zone.
💡 Strategy: Always manage your risk properly and never use high leverage in volatile conditions. DCA (Dollar-Cost Averaging) remains the safest entry method for long-term holders.
What is your target for $BTC this week? Let me know in the comments! 👇
#Bitcoin #BTC #CryptoAnalysis #tradingtips #BTC☀️ #bitcoin
📊 Bitcoin Market Update & Next Targets
Bitcoin is currently showing strong price action around key resistance levels. Volume is steadily increasing, which suggests potential bullish momentum if we hold above the major support zone.
💡 Strategy: Always manage your risk properly and never use high leverage in volatile conditions. DCA (Dollar-Cost Averaging) remains the safest entry method for long-term holders.
What is your target for $BTC this week? Let me know in the comments! 👇
#Bitcoin #BTC #CryptoAnalysis #tradingtips #BTC☀️ #bitcoin
Bitcoin is currently showing strong price action around key resistance levels. Volume is steadily increasing, which suggests potential bullish momentum if we hold above the major support zone.
💡 Strategy: Always manage your risk properly and never use high leverage in volatile conditions. DCA (Dollar-Cost Averaging) remains the safest entry method for long-term holders.
What is your target for $BTC this week? Let me know in the comments! 👇
#Bitcoin #BTC #CryptoAnalysis #tradingtips #BTC☀️ #bitcoin
74
·
--
多くの人はキリのいい数字にストップを置きます。ですが、市場はそこにはありません。
$CRVでは価格は$0.34420です。
直近の1時間足のスイング安値は$0.33190。
それが、あなたを言い負かすレベルです。
たとえば$0.34000のようにその上にストップを置けば、通常のノイズでヒットします。
1h ATRは価格の1.8%です。
それは$0.0062。
つまり現在価格から1.8%下落すると$0.3380です。
$0.33190はそれより下。実在しています。
ストップは$0.33190の下に置きましょう。
$0.3400ではありません。$0.3300でもありません。
直近のスイング安値の下です。
ストップをどこに置くか、あなたのルールは何ですか?
#TradingTips #CRV
投資助言ではありません。私の水準、私のリスク。
多くの人はキリのいい数字にストップを置きます。ですが、市場はそこにはありません。
$CRV では価格は$0.34420です。
直近の1時間足のスイング安値は$0.33190。
それが、あなたを言い負かすレベルです。
たとえば$0.34000のようにその上にストップを置けば、通常のノイズでヒットします。
1h ATRは価格の1.8%です。
それは$0.0062。
つまり現在価格から1.8%下落すると$0.3380です。
$0.33190はそれより下。実在しています。
ストップは$0.33190の下に置きましょう。
$0.3400ではありません。$0.3300でもありません。
直近のスイング安値の下です。
ストップをどこに置くか、あなたのルールは何ですか?
#TradingTips #CRV
投資助言ではありません。私の水準、私のリスク。
$CRV では価格は$0.34420です。
直近の1時間足のスイング安値は$0.33190。
それが、あなたを言い負かすレベルです。
たとえば$0.34000のようにその上にストップを置けば、通常のノイズでヒットします。
1h ATRは価格の1.8%です。
それは$0.0062。
つまり現在価格から1.8%下落すると$0.3380です。
$0.33190はそれより下。実在しています。
ストップは$0.33190の下に置きましょう。
$0.3400ではありません。$0.3300でもありません。
直近のスイング安値の下です。
ストップをどこに置くか、あなたのルールは何ですか?
#TradingTips #CRV
投資助言ではありません。私の水準、私のリスク。
2
·
--
翻訳参照
Most people risk too much because they ignore volatility.
My account is $1000. I risk 1% = $10.
ENA’s 1h ATR is 1.6% of price.
Price is 0.14600.
1.6% of 0.14600 = 0.002336.
To lose only $10 if the stop is 1 ATR away:
$10 ÷ 0.002336 = 4280.4 coins.
I would size at 4280 ENA.
On the next trade, I size so my stop distance matches my risk limit not my gut.
What’s your rule for position sizing? #TradingTips #ENA
Not financial advice. My levels, my risk.
Most people risk too much because they ignore volatility.
My account is $1000. I risk 1% = $10.
ENA’s 1h ATR is 1.6% of price.
Price is 0.14600.
1.6% of 0.14600 = 0.002336.
To lose only $10 if the stop is 1 ATR away:
$10 ÷ 0.002336 = 4280.4 coins.
I would size at 4280 ENA.
On the next trade, I size so my stop distance matches my risk limit not my gut.
What’s your rule for position sizing? #TradingTips #ENA
Not financial advice. My levels, my risk.
My account is $1000. I risk 1% = $10.
ENA’s 1h ATR is 1.6% of price.
Price is 0.14600.
1.6% of 0.14600 = 0.002336.
To lose only $10 if the stop is 1 ATR away:
$10 ÷ 0.002336 = 4280.4 coins.
I would size at 4280 ENA.
On the next trade, I size so my stop distance matches my risk limit not my gut.
What’s your rule for position sizing? #TradingTips #ENA
Not financial advice. My levels, my risk.
91

実践的なトレーディング/リスク管理のアドバイス
暗号資産トレーダーを一掃する「最も大きなミス」⚠️
ダメージを与えるのは、だいたいチャート分析ではありません。問題はポジションサイジング(建玉管理)です。
BTCのような主要銘柄や、BNBのような高い実用性のある資産なら、たいていは忍耐が報われます。ですが、オーバーレバレッジしてしまったり、アルトコインで1回の取引につき1〜2%を超えるリスクを取るようになると、たった1本のヒゲで数か月分の利益が吹き飛ぶことがあります。
ゲームに残り続けるための3つのルール:
1. 無効化レベル(ストップロス)なしで取引しない。
2. 強い局面では部分利確を行う。完璧な天井を待たない。
3. 相場が荒れている(レンジ/不安定な)ときは、攻め急ぐより資本の保全を優先する。
暗号資産でのリスク管理に関するあなたの「黄金のルール」は何ですか?下にコメントしてください!👇
@Binance_Square_Official #Write2Earn #CryptoTrading #tradingtips #KhmerSharing24h
実践的なトレーディング/リスク管理のアドバイス
暗号資産トレーダーを一掃する「最も大きなミス」⚠️
ダメージを与えるのは、だいたいチャート分析ではありません。問題はポジションサイジング(建玉管理)です。
BTCのような主要銘柄や、BNBのような高い実用性のある資産なら、たいていは忍耐が報われます。ですが、オーバーレバレッジしてしまったり、アルトコインで1回の取引につき1〜2%を超えるリスクを取るようになると、たった1本のヒゲで数か月分の利益が吹き飛ぶことがあります。
ゲームに残り続けるための3つのルール:
1. 無効化レベル(ストップロス)なしで取引しない。
2. 強い局面では部分利確を行う。完璧な天井を待たない。
3. 相場が荒れている(レンジ/不安定な)ときは、攻め急ぐより資本の保全を優先する。
暗号資産でのリスク管理に関するあなたの「黄金のルール」は何ですか?下にコメントしてください!👇
@Binance Square Official #Write2Earn #CryptoTrading #tradingtips #KhmerSharing24h
暗号資産トレーダーを一掃する「最も大きなミス」⚠️
ダメージを与えるのは、だいたいチャート分析ではありません。問題はポジションサイジング(建玉管理)です。
BTCのような主要銘柄や、BNBのような高い実用性のある資産なら、たいていは忍耐が報われます。ですが、オーバーレバレッジしてしまったり、アルトコインで1回の取引につき1〜2%を超えるリスクを取るようになると、たった1本のヒゲで数か月分の利益が吹き飛ぶことがあります。
ゲームに残り続けるための3つのルール:
1. 無効化レベル(ストップロス)なしで取引しない。
2. 強い局面では部分利確を行う。完璧な天井を待たない。
3. 相場が荒れている(レンジ/不安定な)ときは、攻め急ぐより資本の保全を優先する。
暗号資産でのリスク管理に関するあなたの「黄金のルール」は何ですか?下にコメントしてください!👇
@Binance Square Official #Write2Earn #CryptoTrading #tradingtips #KhmerSharing24h

94
·
--
多くの人は節目の価格にストップを置きます。ですが市場が気にしているのは、そこではありません。
私のストップは、私が間違っていることを証明する水準より下に置きます。
$THETAでは、直近1時間足のスイング安値は$0.16840です。
そこが短期トレンドが反転したポイントです。
価格がそこを下抜けたら、私が追っているモメンタムは消えます。
$0.18500にストップを置く?それは現在価格からわずか3.6%下です。
しかし1時間ATRは2.4%で、通常の値動きはそれより大きくなります。
$0.18500のストップは戦略というよりノイズに刈られます。
私は、割合ではなく確定したスイング安値の下にストップを置きます。
ストップが本当に置かれるべき場所を決めるあなたのルールは何ですか?
#TradingTips #THETA
※投資助言ではありません。私の水準、私のリスク。
多くの人は節目の価格にストップを置きます。ですが市場が気にしているのは、そこではありません。
私のストップは、私が間違っていることを証明する水準より下に置きます。
$THETA では、直近1時間足のスイング安値は$0.16840です。
そこが短期トレンドが反転したポイントです。
価格がそこを下抜けたら、私が追っているモメンタムは消えます。
$0.18500にストップを置く?それは現在価格からわずか3.6%下です。
しかし1時間ATRは2.4%で、通常の値動きはそれより大きくなります。
$0.18500のストップは戦略というよりノイズに刈られます。
私は、割合ではなく確定したスイング安値の下にストップを置きます。
ストップが本当に置かれるべき場所を決めるあなたのルールは何ですか?
#TradingTips #THETA
※投資助言ではありません。私の水準、私のリスク。
私のストップは、私が間違っていることを証明する水準より下に置きます。
$THETA では、直近1時間足のスイング安値は$0.16840です。
そこが短期トレンドが反転したポイントです。
価格がそこを下抜けたら、私が追っているモメンタムは消えます。
$0.18500にストップを置く?それは現在価格からわずか3.6%下です。
しかし1時間ATRは2.4%で、通常の値動きはそれより大きくなります。
$0.18500のストップは戦略というよりノイズに刈られます。
私は、割合ではなく確定したスイング安値の下にストップを置きます。
ストップが本当に置かれるべき場所を決めるあなたのルールは何ですか?
#TradingTips #THETA
※投資助言ではありません。私の水準、私のリスク。
30
·
--
多くの人はキリのいい数字にストップを置きます。しかし、市場が反転する場所はそこではありません。
$EIGEN は$0.21670です。
直近1時間のスイング安値は$0.19500です。
そこがトレンドが崩れたポイントで、あなたが間違っているところです。
1時間のATRは価格の3.3%=$0.00715です。
$0.20900(1%下)のストップは通常のノイズでヒットします。
$0.19400($0.19500の下)のストップなら、取引に余裕を持たせられます。
「自分が間違っている」と証明される水準より下にストップを置きなさい。キリのいい数字の下に置くな。
ストップを置く場所のルールは何ですか?
#TradingTips #EIGEN
投資助言ではありません。私の水準、私のリスク。
多くの人はキリのいい数字にストップを置きます。しかし、市場が反転する場所はそこではありません。
$EIGEN は$0.21670です。
直近1時間のスイング安値は$0.19500です。
そこがトレンドが崩れたポイントで、あなたが間違っているところです。
1時間のATRは価格の3.3%=$0.00715です。
$0.20900(1%下)のストップは通常のノイズでヒットします。
$0.19400($0.19500の下)のストップなら、取引に余裕を持たせられます。
「自分が間違っている」と証明される水準より下にストップを置きなさい。キリのいい数字の下に置くな。
ストップを置く場所のルールは何ですか?
#TradingTips #EIGEN
投資助言ではありません。私の水準、私のリスク。
$EIGEN は$0.21670です。
直近1時間のスイング安値は$0.19500です。
そこがトレンドが崩れたポイントで、あなたが間違っているところです。
1時間のATRは価格の3.3%=$0.00715です。
$0.20900(1%下)のストップは通常のノイズでヒットします。
$0.19400($0.19500の下)のストップなら、取引に余裕を持たせられます。
「自分が間違っている」と証明される水準より下にストップを置きなさい。キリのいい数字の下に置くな。
ストップを置く場所のルールは何ですか?
#TradingTips #EIGEN
投資助言ではありません。私の水準、私のリスク。
48
·
--
多くの人はキリのいい数値にストップを置きます。しかし市場が気にしているのはそこではありません。
$SAGA は $0.01604 にあります。
その直近1時間のスイング安値は $0.01425 です。
そこで市場は「買い手が間違っていた」ことを証明しました。
その下にストップを置く? いいでしょう。
$0.01500 にストップを置く? それはただのノイズです。
1時間のATRは価格の7.0%で、$0.00112 です。
$0.01604 から $0.00112 を引くと $0.01492 です。
つまり $0.01500 のストップは、通常の時間足の値動きで刈り取られます。
最後に明確に確認できたスイング安値の下にストップを置きましょう。
キリのいい数値ではない。パーセンテージでもない。
あなたの「ストップが置かれる場所」のルールは何ですか?
#TradingTips #SAGA
※投資助言ではありません。私の水準、私のリスク。
多くの人はキリのいい数値にストップを置きます。しかし市場が気にしているのはそこではありません。
$SAGA は $0.01604 にあります。
その直近1時間のスイング安値は $0.01425 です。
そこで市場は「買い手が間違っていた」ことを証明しました。
その下にストップを置く? いいでしょう。
$0.01500 にストップを置く? それはただのノイズです。
1時間のATRは価格の7.0%で、$0.00112 です。
$0.01604 から $0.00112 を引くと $0.01492 です。
つまり $0.01500 のストップは、通常の時間足の値動きで刈り取られます。
最後に明確に確認できたスイング安値の下にストップを置きましょう。
キリのいい数値ではない。パーセンテージでもない。
あなたの「ストップが置かれる場所」のルールは何ですか?
#TradingTips #SAGA
※投資助言ではありません。私の水準、私のリスク。
$SAGA は $0.01604 にあります。
その直近1時間のスイング安値は $0.01425 です。
そこで市場は「買い手が間違っていた」ことを証明しました。
その下にストップを置く? いいでしょう。
$0.01500 にストップを置く? それはただのノイズです。
1時間のATRは価格の7.0%で、$0.00112 です。
$0.01604 から $0.00112 を引くと $0.01492 です。
つまり $0.01500 のストップは、通常の時間足の値動きで刈り取られます。
最後に明確に確認できたスイング安値の下にストップを置きましょう。
キリのいい数値ではない。パーセンテージでもない。
あなたの「ストップが置かれる場所」のルールは何ですか?
#TradingTips #SAGA
※投資助言ではありません。私の水準、私のリスク。
1
·
--
多くの人は切りの良い数字にストップを置きます。でも、市場はそんな場所にはいません。
$RUNE は$0.53500です。
直近1時間のスイング安値は$0.47700。
これが短期トレンドが崩れたことを証明する水準です。
$0.47700を下回るストップなら、相場があなたの見立てに反して動いたことになります。
1時間足のATRは価格の2.5%で、それが$0.013375です。
$0.52000(3%下)にストップを置いても、通常のノイズでヒットします。
ノイズはエントリーなんて気にしません。
スイング安値は気にします。
最後に確認されたスイング安値の下にストップを置きましょう。
切りの良い数字の下ではありません。
恐れに基づくのでもありません。
ストップをどこに置くかのルールは何ですか?
#TradingTips #RUNE
これは金融アドバイスではありません。私の水準、私のリスク。
多くの人は切りの良い数字にストップを置きます。でも、市場はそんな場所にはいません。
$RUNE は$0.53500です。
直近1時間のスイング安値は$0.47700。
これが短期トレンドが崩れたことを証明する水準です。
$0.47700を下回るストップなら、相場があなたの見立てに反して動いたことになります。
1時間足のATRは価格の2.5%で、それが$0.013375です。
$0.52000(3%下)にストップを置いても、通常のノイズでヒットします。
ノイズはエントリーなんて気にしません。
スイング安値は気にします。
最後に確認されたスイング安値の下にストップを置きましょう。
切りの良い数字の下ではありません。
恐れに基づくのでもありません。
ストップをどこに置くかのルールは何ですか?
#TradingTips #RUNE
これは金融アドバイスではありません。私の水準、私のリスク。
$RUNE は$0.53500です。
直近1時間のスイング安値は$0.47700。
これが短期トレンドが崩れたことを証明する水準です。
$0.47700を下回るストップなら、相場があなたの見立てに反して動いたことになります。
1時間足のATRは価格の2.5%で、それが$0.013375です。
$0.52000(3%下)にストップを置いても、通常のノイズでヒットします。
ノイズはエントリーなんて気にしません。
スイング安値は気にします。
最後に確認されたスイング安値の下にストップを置きましょう。
切りの良い数字の下ではありません。
恐れに基づくのでもありません。
ストップをどこに置くかのルールは何ですか?
#TradingTips #RUNE
これは金融アドバイスではありません。私の水準、私のリスク。
11
·
--
多くのトレーダーは出来高の確認を無視して、価格だけを追いかけます。
$LSK は出来高$1.4Mで12.6%上昇中です。
7日平均出来高は206K。
$1.4M ÷ 206K = 6.8倍。
これはただのラリーではなく、出来高に裏付けられた動きです。
この比率がなければ、12.6%の急騰を見て勢いだと思ってしまうでしょう。
でも比率があると、市場が本当に参加しているかが分かります。
20秒で確認:
Binanceを開き、コインをクリックし、「24h Vol」までスクロールします。
その下に表示されている7日平均で割ってください。
3倍を超えていれば、注目する価値があります。
次の取引では、ブレイクアウトを検討する前に、出来高が7日平均の3倍以上になるのを待ちます。
出来高を確認するあなたのルールは?
#TradingTips #LSK
投資助言ではありません。僕の水準、僕のリスクです。
多くのトレーダーは出来高の確認を無視して、価格だけを追いかけます。
$LSK は出来高$1.4Mで12.6%上昇中です。
7日平均出来高は206K。
$1.4M ÷ 206K = 6.8倍。
これはただのラリーではなく、出来高に裏付けられた動きです。
この比率がなければ、12.6%の急騰を見て勢いだと思ってしまうでしょう。
でも比率があると、市場が本当に参加しているかが分かります。
20秒で確認:
Binanceを開き、コインをクリックし、「24h Vol」までスクロールします。
その下に表示されている7日平均で割ってください。
3倍を超えていれば、注目する価値があります。
次の取引では、ブレイクアウトを検討する前に、出来高が7日平均の3倍以上になるのを待ちます。
出来高を確認するあなたのルールは?
#TradingTips #LSK
投資助言ではありません。僕の水準、僕のリスクです。
$LSK は出来高$1.4Mで12.6%上昇中です。
7日平均出来高は206K。
$1.4M ÷ 206K = 6.8倍。
これはただのラリーではなく、出来高に裏付けられた動きです。
この比率がなければ、12.6%の急騰を見て勢いだと思ってしまうでしょう。
でも比率があると、市場が本当に参加しているかが分かります。
20秒で確認:
Binanceを開き、コインをクリックし、「24h Vol」までスクロールします。
その下に表示されている7日平均で割ってください。
3倍を超えていれば、注目する価値があります。
次の取引では、ブレイクアウトを検討する前に、出来高が7日平均の3倍以上になるのを待ちます。
出来高を確認するあなたのルールは?
#TradingTips #LSK
投資助言ではありません。僕の水準、僕のリスクです。
1
15

·
--
翻訳参照
Picture this: you log into your trading terminal during peak volatility, only to find the session dropped because your browser aggressively wiped essential local cookies.
Most traders obsess over slippage and network congestion, yet completely overlook how fundamental session architecture protects their execution speed and security credentials during critical market moves.
When you look at infrastructure layers across Web3 and exchanges, essential session data functions much like validator heartbeats on networks like $SOL or consensus state tracking on $ETH. Without persistent essential cookies, features like session-based API auth, 2FA persistence, and zero-PII privacy preferences break instantly. It is similar to trying to route a fast swap through a decentralized protocol while blocking the state storage needed to verify your connected wallet address.
Just as $BNB chain relies on non-negotiable core validator parameters to keep blocks moving, modern interfaces require these strictly functional cookies solely to maintain your active login and user settings without ever touching your personal data.
How often do you review your browser and privacy settings before trading high-volatility events?
#CryptoSecurity #Web3Infrastructure #TradingTips
Picture this: you log into your trading terminal during peak volatility, only to find the session dropped because your browser aggressively wiped essential local cookies.
Most traders obsess over slippage and network congestion, yet completely overlook how fundamental session architecture protects their execution speed and security credentials during critical market moves.
When you look at infrastructure layers across Web3 and exchanges, essential session data functions much like validator heartbeats on networks like $SOL or consensus state tracking on $ETH . Without persistent essential cookies, features like session-based API auth, 2FA persistence, and zero-PII privacy preferences break instantly. It is similar to trying to route a fast swap through a decentralized protocol while blocking the state storage needed to verify your connected wallet address.
Just as $BNB chain relies on non-negotiable core validator parameters to keep blocks moving, modern interfaces require these strictly functional cookies solely to maintain your active login and user settings without ever touching your personal data.
How often do you review your browser and privacy settings before trading high-volatility events?
#CryptoSecurity #Web3Infrastructure #TradingTips
Most traders obsess over slippage and network congestion, yet completely overlook how fundamental session architecture protects their execution speed and security credentials during critical market moves.
When you look at infrastructure layers across Web3 and exchanges, essential session data functions much like validator heartbeats on networks like $SOL or consensus state tracking on $ETH . Without persistent essential cookies, features like session-based API auth, 2FA persistence, and zero-PII privacy preferences break instantly. It is similar to trying to route a fast swap through a decentralized protocol while blocking the state storage needed to verify your connected wallet address.
Just as $BNB chain relies on non-negotiable core validator parameters to keep blocks moving, modern interfaces require these strictly functional cookies solely to maintain your active login and user settings without ever touching your personal data.
How often do you review your browser and privacy settings before trading high-volatility events?
#CryptoSecurity #Web3Infrastructure #TradingTips
15
·
--
トップの値上がり銘柄を追いかけると、たいてい負けます。
$AVAX は本日-3.7%です。
価格は$7.4480で、直近24時間のレンジの7%地点($7.4140〜$7.8680)にあります。
つまり、今日の値動きの93%はすでに起きています。
出来高は7日平均の0.6倍で、参加が弱いです。
直近1時間のスイングハイは$7.8680でした。そこでの買い勢は1時間で5.4%失っています。
$7.4480であなたに売っているのは誰でしょう? $7.8680で買って、ちょうど損切り(ストップ)に遭ったのと同じ人たちです。
エントリーする前に、出来高とレンジの確認を待ってください。
この罠を避けるためのあなたのルールは何ですか?
#TradingTips #AVAX
投資助言ではありません。私の水準、私のリスク。
トップの値上がり銘柄を追いかけると、たいてい負けます。
$AVAX は本日-3.7%です。
価格は$7.4480で、直近24時間のレンジの7%地点($7.4140〜$7.8680)にあります。
つまり、今日の値動きの93%はすでに起きています。
出来高は7日平均の0.6倍で、参加が弱いです。
直近1時間のスイングハイは$7.8680でした。そこでの買い勢は1時間で5.4%失っています。
$7.4480であなたに売っているのは誰でしょう? $7.8680で買って、ちょうど損切り(ストップ)に遭ったのと同じ人たちです。
エントリーする前に、出来高とレンジの確認を待ってください。
この罠を避けるためのあなたのルールは何ですか?
#TradingTips #AVAX
投資助言ではありません。私の水準、私のリスク。
$AVAX は本日-3.7%です。
価格は$7.4480で、直近24時間のレンジの7%地点($7.4140〜$7.8680)にあります。
つまり、今日の値動きの93%はすでに起きています。
出来高は7日平均の0.6倍で、参加が弱いです。
直近1時間のスイングハイは$7.8680でした。そこでの買い勢は1時間で5.4%失っています。
$7.4480であなたに売っているのは誰でしょう? $7.8680で買って、ちょうど損切り(ストップ)に遭ったのと同じ人たちです。
エントリーする前に、出来高とレンジの確認を待ってください。
この罠を避けるためのあなたのルールは何ですか?
#TradingTips #AVAX
投資助言ではありません。私の水準、私のリスク。
16
·
--
多くの人はキリのいい数値にストップを置きます。でも市場が気にしているのは、そこではありません。
私のストップは、自分が間違っていることを証明する水準より下に置きます。
WIFの場合:
直近1時間のスイング安値は$0.18910です。
これは直近1時間での最安値です。
ここを下にブレイクすれば、短期のモメンタムは失われます。
通常の1時間スイングは、$0.19020の1.5% = $0.00285です。
$0.18735($0.19020 - $0.00285)のストップは、ノイズだけでヒットしてしまいます。
私は$0.18910の下にストップを置きます。丸い数値だからではなく、最後に確定した安値だからです。
次の取引では、市場の構造が私のストップを決めさせます。
あなたのルールは?
#TradingTips #WIF
投資助言ではありません。私の水準、私のリスク。
多くの人はキリのいい数値にストップを置きます。でも市場が気にしているのは、そこではありません。
私のストップは、自分が間違っていることを証明する水準より下に置きます。
WIFの場合:
直近1時間のスイング安値は$0.18910です。
これは直近1時間での最安値です。
ここを下にブレイクすれば、短期のモメンタムは失われます。
通常の1時間スイングは、$0.19020の1.5% = $0.00285です。
$0.18735($0.19020 - $0.00285)のストップは、ノイズだけでヒットしてしまいます。
私は$0.18910の下にストップを置きます。丸い数値だからではなく、最後に確定した安値だからです。
次の取引では、市場の構造が私のストップを決めさせます。
あなたのルールは?
#TradingTips #WIF
投資助言ではありません。私の水準、私のリスク。
私のストップは、自分が間違っていることを証明する水準より下に置きます。
WIFの場合:
直近1時間のスイング安値は$0.18910です。
これは直近1時間での最安値です。
ここを下にブレイクすれば、短期のモメンタムは失われます。
通常の1時間スイングは、$0.19020の1.5% = $0.00285です。
$0.18735($0.19020 - $0.00285)のストップは、ノイズだけでヒットしてしまいます。
私は$0.18910の下にストップを置きます。丸い数値だからではなく、最後に確定した安値だからです。
次の取引では、市場の構造が私のストップを決めさせます。
あなたのルールは?
#TradingTips #WIF
投資助言ではありません。私の水準、私のリスク。
9

·
--
ブリッシュ
翻訳参照
If you’re new to trading, learn this BEFORE you touch leverage. 📚
Most beginners focus on finding the “perfect entry.”
That’s not the most important part.
Start with these 5 things:
1️⃣ Risk management — never risk money you can’t afford to lose.
2️⃣ Position size — your position should match your risk, not your excitement.
3️⃣ Stop loss — know where you’re wrong before entering.
4️⃣ One setup — master one strategy instead of chasing every move.
5️⃣ Patience — no trade is better than a bad trade.
And remember:
You don’t need to win every trade. You need to survive long enough to become good.
Start small. Learn. Journal your trades. Improve. 📈
#Trading #CryptoTrading #RiskManagement #TradingTips
If you’re new to trading, learn this BEFORE you touch leverage. 📚
Most beginners focus on finding the “perfect entry.”
That’s not the most important part.
Start with these 5 things:
1️⃣ Risk management — never risk money you can’t afford to lose.
2️⃣ Position size — your position should match your risk, not your excitement.
3️⃣ Stop loss — know where you’re wrong before entering.
4️⃣ One setup — master one strategy instead of chasing every move.
5️⃣ Patience — no trade is better than a bad trade.
And remember:
You don’t need to win every trade. You need to survive long enough to become good.
Start small. Learn. Journal your trades. Improve. 📈
#Trading #CryptoTrading #RiskManagement #TradingTips
Most beginners focus on finding the “perfect entry.”
That’s not the most important part.
Start with these 5 things:
1️⃣ Risk management — never risk money you can’t afford to lose.
2️⃣ Position size — your position should match your risk, not your excitement.
3️⃣ Stop loss — know where you’re wrong before entering.
4️⃣ One setup — master one strategy instead of chasing every move.
5️⃣ Patience — no trade is better than a bad trade.
And remember:
You don’t need to win every trade. You need to survive long enough to become good.
Start small. Learn. Journal your trades. Improve. 📈
#Trading #CryptoTrading #RiskManagement #TradingTips

85
ログインして、さらにコンテンツを読む
厳選トピックで世界の暗号資産トレーダーの仲間入り
⚡️ 暗号資産に関する最新かつ有益な情報が見つかります。
💬 世界最大の暗号資産取引所から信頼されています。
👍 認証を受けたクリエイターから、有益なインサイトを得られます。
メール / 電話番号
トレンドトピック
1
#CPIWatch
閲覧回数 87M
502,830人が討論中
2
#BitcoinReboundsAbove$79KAfterCPI
閲覧回数 3,206
131人が討論中
3
#BNBTops730USDT
閲覧回数 25,262
692人が討論中
4
#BitcoinOpenInterestShareRisesTo42.1%
閲覧回数 12,783
381人が討論中
5
#OpenAILaunchesAgentsAPIPublicBeta
閲覧回数 10,351
232人が討論中
6
#SpotGoldRises0.87%SilverGains1.13%
閲覧回数 10,316
207人が討論中
7
#USCoreCPIRises0.3%InAugustBeatingForecasts
閲覧回数 24,349
316人が討論中
8
#BitcoinFallsTo$77KAfterGoldenCross
閲覧回数 3,494
68人が討論中
9
#OracleJumpsOver6%OnEarningsBeat
閲覧回数 31,360
435人が討論中
10
#CLARITYActRevisionToRuleNonDeFiControllers
閲覧回数 40,714
547人が討論中