
#rad
rad
閲覧回数 648,398
2,932人が討論中
注目
最新

·
--
翻訳参照
🟢 $RAD LONG · 1h
✅ Proven · Diamond Bottom
Entry 0.222
Target 0.2679 (+20.7%)
Stop 0.209 (−5.9%)
Reward:risk 3.5
📊 All coins, 1h: 36% won of 94 · avg −0.8%
🪙 On RAD: 1 of 1 won
Automated chart-pattern signal. Not financial advice.
#RAD #CryptoSignals
🟢 $RAD LONG · 1h
✅ Proven · Diamond Bottom
Entry 0.222
Target 0.2679 (+20.7%)
Stop 0.209 (−5.9%)
Reward:risk 3.5
📊 All coins, 1h: 36% won of 94 · avg −0.8%
🪙 On RAD: 1 of 1 won
Automated chart-pattern signal. Not financial advice.
#RAD #CryptoSignals
✅ Proven · Diamond Bottom
Entry 0.222
Target 0.2679 (+20.7%)
Stop 0.209 (−5.9%)
Reward:risk 3.5
📊 All coins, 1h: 36% won of 94 · avg −0.8%
🪙 On RAD: 1 of 1 won
Automated chart-pattern signal. Not financial advice.
#RAD #CryptoSignals
23

·
--
翻訳参照
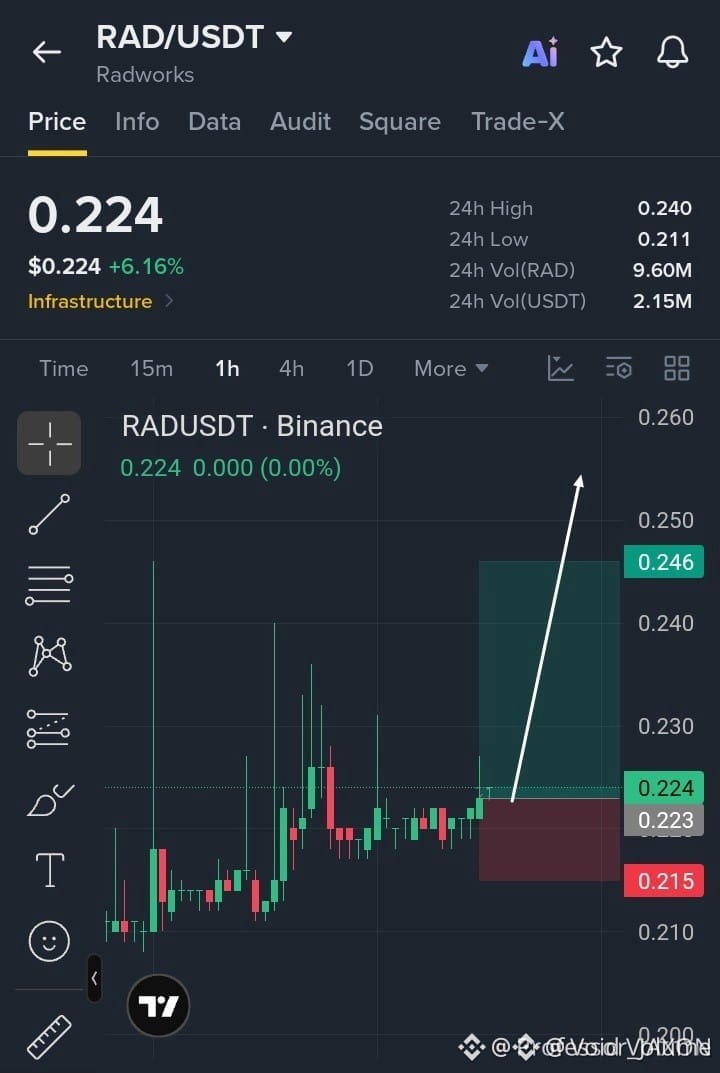
🚀 $RAD ACCUMULATION COMPLETE AS SMART MONEY EYES THE 0.246 LIQUIDITY PIVOT! 💥
Entry: $0.223 – $0.225 ⚡
Target: $0.246 🚀
Stop Loss: $0.215 ⚠️
📌 Price action on the 1H timeframe reveals a textbook base building above the $0.220 support block after absorbing late-stage sell pressure. 📊 Volume profiles show steady institutional accumulation within the current demand zone as buyers prepare to challenge local inefficiencies. ⚡
💡 A clean sweep of the $0.230 interim resistance opens a frictionless pathway toward our primary liquidity objective at the upper range. 💬 Are you positioning ahead of the breakout or waiting for a retest confirmation? 👇
⚠️ Not financial advice. Always manage your risk. 🛡️
🏷️ #RAD #LongSetup #Breakout #Crypto
🔥 💎
🚀 $RAD ACCUMULATION COMPLETE AS SMART MONEY EYES THE 0.246 LIQUIDITY PIVOT! 💥
Entry: $0.223 – $0.225 ⚡
Target: $0.246 🚀
Stop Loss: $0.215 ⚠️
📌 Price action on the 1H timeframe reveals a textbook base building above the $0.220 support block after absorbing late-stage sell pressure. 📊 Volume profiles show steady institutional accumulation within the current demand zone as buyers prepare to challenge local inefficiencies. ⚡
💡 A clean sweep of the $0.230 interim resistance opens a frictionless pathway toward our primary liquidity objective at the upper range. 💬 Are you positioning ahead of the breakout or waiting for a retest confirmation? 👇
⚠️ Not financial advice. Always manage your risk. 🛡️
🏷️ #RAD #LongSetup #Breakout #Crypto
🔥 💎
Entry: $0.223 – $0.225 ⚡
Target: $0.246 🚀
Stop Loss: $0.215 ⚠️
📌 Price action on the 1H timeframe reveals a textbook base building above the $0.220 support block after absorbing late-stage sell pressure. 📊 Volume profiles show steady institutional accumulation within the current demand zone as buyers prepare to challenge local inefficiencies. ⚡
💡 A clean sweep of the $0.230 interim resistance opens a frictionless pathway toward our primary liquidity objective at the upper range. 💬 Are you positioning ahead of the breakout or waiting for a retest confirmation? 👇
⚠️ Not financial advice. Always manage your risk. 🛡️
🏷️ #RAD #LongSetup #Breakout #Crypto
🔥 💎
9

翻訳参照
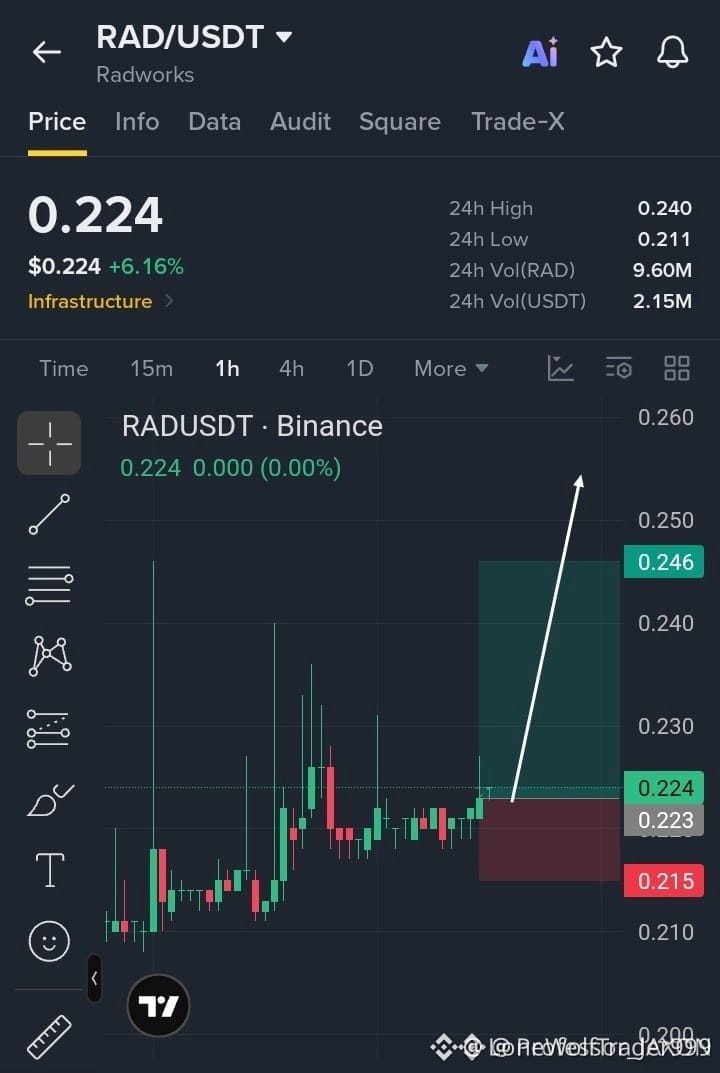
🚨 $RAD COILING TIGHT ABOVE SUPPORT READY FOR A VIOLENT BREAKOUT ⚡
Entry: $0.223 – $0.225 ⚡
Target: $0.246 🚀
Stop Loss: $0.215 ⚠️
Sellers are exhausting their ammunition after a stubborn base-building phase above the $0.220 floor. Buyers are stepping in with aggressive bids, turning every minor dip into an accumulation trampoline on the 1H timeframe. 📊
Momentum is shifting fast as order flow tilts heavily in favor of the bulls. Clearing the initial $0.230 hurdle unlocks clean headroom straight toward that major liquidity pocket at $0.246. ⚡
Are you positioning ahead of the ignition candle or waiting for the retest? 👇
⚠️ Not financial advice. Always manage your risk. 🛡️
🏷️ #RAD #LongSetup #Breakout #Crypto
🔥 💎
🚨 $RAD COILING TIGHT ABOVE SUPPORT READY FOR A VIOLENT BREAKOUT ⚡
Entry: $0.223 – $0.225 ⚡
Target: $0.246 🚀
Stop Loss: $0.215 ⚠️
Sellers are exhausting their ammunition after a stubborn base-building phase above the $0.220 floor. Buyers are stepping in with aggressive bids, turning every minor dip into an accumulation trampoline on the 1H timeframe. 📊
Momentum is shifting fast as order flow tilts heavily in favor of the bulls. Clearing the initial $0.230 hurdle unlocks clean headroom straight toward that major liquidity pocket at $0.246. ⚡
Are you positioning ahead of the ignition candle or waiting for the retest? 👇
⚠️ Not financial advice. Always manage your risk. 🛡️
🏷️ #RAD #LongSetup #Breakout #Crypto
🔥 💎
Entry: $0.223 – $0.225 ⚡
Target: $0.246 🚀
Stop Loss: $0.215 ⚠️
Sellers are exhausting their ammunition after a stubborn base-building phase above the $0.220 floor. Buyers are stepping in with aggressive bids, turning every minor dip into an accumulation trampoline on the 1H timeframe. 📊
Momentum is shifting fast as order flow tilts heavily in favor of the bulls. Clearing the initial $0.230 hurdle unlocks clean headroom straight toward that major liquidity pocket at $0.246. ⚡
Are you positioning ahead of the ignition candle or waiting for the retest? 👇
⚠️ Not financial advice. Always manage your risk. 🛡️
🏷️ #RAD #LongSetup #Breakout #Crypto
🔥 💎
6

翻訳参照
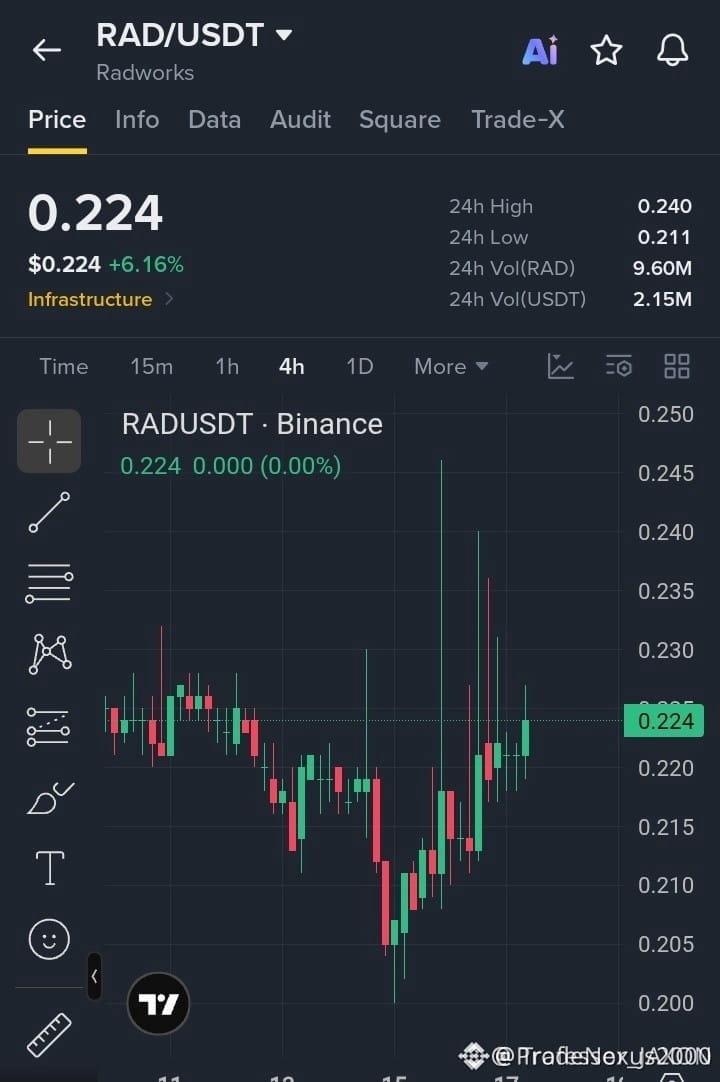
🦈 $RAD DEFENDING THE 0.2050 ACCUMULATION BASE AS SMART MONEY LIFTS BID DEPTH! ⚡
Entry: 0.2210 – 0.2240 ⚡
Target: 0.2420 🚀
Stop Loss: 0.2140 ⚠️
📊 Price action on the four-hour timeframe reveals a pristine structural defense of the 0.2050 liquidity base, flushing out late aggressive shorts before printing consecutive higher lows.
⚡ Institutional buyers are actively absorbing supply within the 0.2210 to 0.2240 reaccumulation zone, building the velocity needed to breach the 0.2300 psychological barrier and target upper liquidity pools. 💡
💬 Are you positioning ahead of the breakout sequence or waiting for confirmation above resistance? 👇
⚠️ Not financial advice. Always manage your risk. 🛡️
🏷️ #RAD #SmartMoney #CryptoTrading #MarketStructure #LongSetup
🔥 💎
🦈 $RAD DEFENDING THE 0.2050 ACCUMULATION BASE AS SMART MONEY LIFTS BID DEPTH! ⚡
Entry: 0.2210 – 0.2240 ⚡
Target: 0.2420 🚀
Stop Loss: 0.2140 ⚠️
📊 Price action on the four-hour timeframe reveals a pristine structural defense of the 0.2050 liquidity base, flushing out late aggressive shorts before printing consecutive higher lows.
⚡ Institutional buyers are actively absorbing supply within the 0.2210 to 0.2240 reaccumulation zone, building the velocity needed to breach the 0.2300 psychological barrier and target upper liquidity pools. 💡
💬 Are you positioning ahead of the breakout sequence or waiting for confirmation above resistance? 👇
⚠️ Not financial advice. Always manage your risk. 🛡️
🏷️ #RAD #SmartMoney #CryptoTrading #MarketStructure #LongSetup
🔥 💎
Entry: 0.2210 – 0.2240 ⚡
Target: 0.2420 🚀
Stop Loss: 0.2140 ⚠️
📊 Price action on the four-hour timeframe reveals a pristine structural defense of the 0.2050 liquidity base, flushing out late aggressive shorts before printing consecutive higher lows.
⚡ Institutional buyers are actively absorbing supply within the 0.2210 to 0.2240 reaccumulation zone, building the velocity needed to breach the 0.2300 psychological barrier and target upper liquidity pools. 💡
💬 Are you positioning ahead of the breakout sequence or waiting for confirmation above resistance? 👇
⚠️ Not financial advice. Always manage your risk. 🛡️
🏷️ #RAD #SmartMoney #CryptoTrading #MarketStructure #LongSetup
🔥 💎
6

翻訳参照
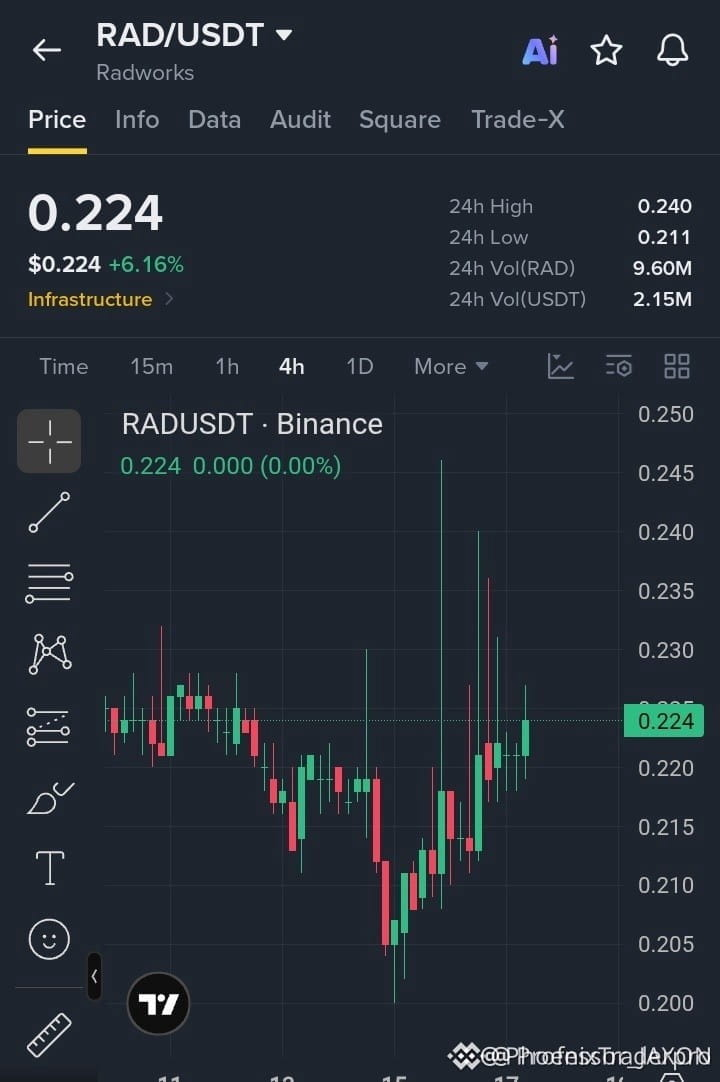
🟢 $RAD BUYERS AWAKEN AS MOMENTUM BUILDS FOR A CLEAN BREAKOUT ACROSS RESISTANCE! ⚡
Entry: 0.2210 – 0.2240 ⚡
Target: 0.2300 – 0.2420 🚀
Stop Loss: 0.2140 ⚠️
That textbook defense at the 0.2050 support floor has completely shifted market structure on the 4h timeframe. Sellers are losing their grip as aggressive bid volume steps in to absorb every minor dip. 📊
Price action is coiling tight right beneath overhead supply, setting the stage for aggressive continuation once 0.2300 gives way. ⚡
💬 Are you positioning ahead of the breakout or waiting for confirmation above resistance? 👇
⚠️ Not financial advice. Always manage your risk. 🛡️
🏷️ #RAD #LongSetup #Crypto #Breakout #Altcoins
🔥 💎
🟢 $RAD BUYERS AWAKEN AS MOMENTUM BUILDS FOR A CLEAN BREAKOUT ACROSS RESISTANCE! ⚡
Entry: 0.2210 – 0.2240 ⚡
Target: 0.2300 – 0.2420 🚀
Stop Loss: 0.2140 ⚠️
That textbook defense at the 0.2050 support floor has completely shifted market structure on the 4h timeframe. Sellers are losing their grip as aggressive bid volume steps in to absorb every minor dip. 📊
Price action is coiling tight right beneath overhead supply, setting the stage for aggressive continuation once 0.2300 gives way. ⚡
💬 Are you positioning ahead of the breakout or waiting for confirmation above resistance? 👇
⚠️ Not financial advice. Always manage your risk. 🛡️
🏷️ #RAD #LongSetup #Crypto #Breakout #Altcoins
🔥 💎
Entry: 0.2210 – 0.2240 ⚡
Target: 0.2300 – 0.2420 🚀
Stop Loss: 0.2140 ⚠️
That textbook defense at the 0.2050 support floor has completely shifted market structure on the 4h timeframe. Sellers are losing their grip as aggressive bid volume steps in to absorb every minor dip. 📊
Price action is coiling tight right beneath overhead supply, setting the stage for aggressive continuation once 0.2300 gives way. ⚡
💬 Are you positioning ahead of the breakout or waiting for confirmation above resistance? 👇
⚠️ Not financial advice. Always manage your risk. 🛡️
🏷️ #RAD #LongSetup #Crypto #Breakout #Altcoins
🔥 💎
2


翻訳参照
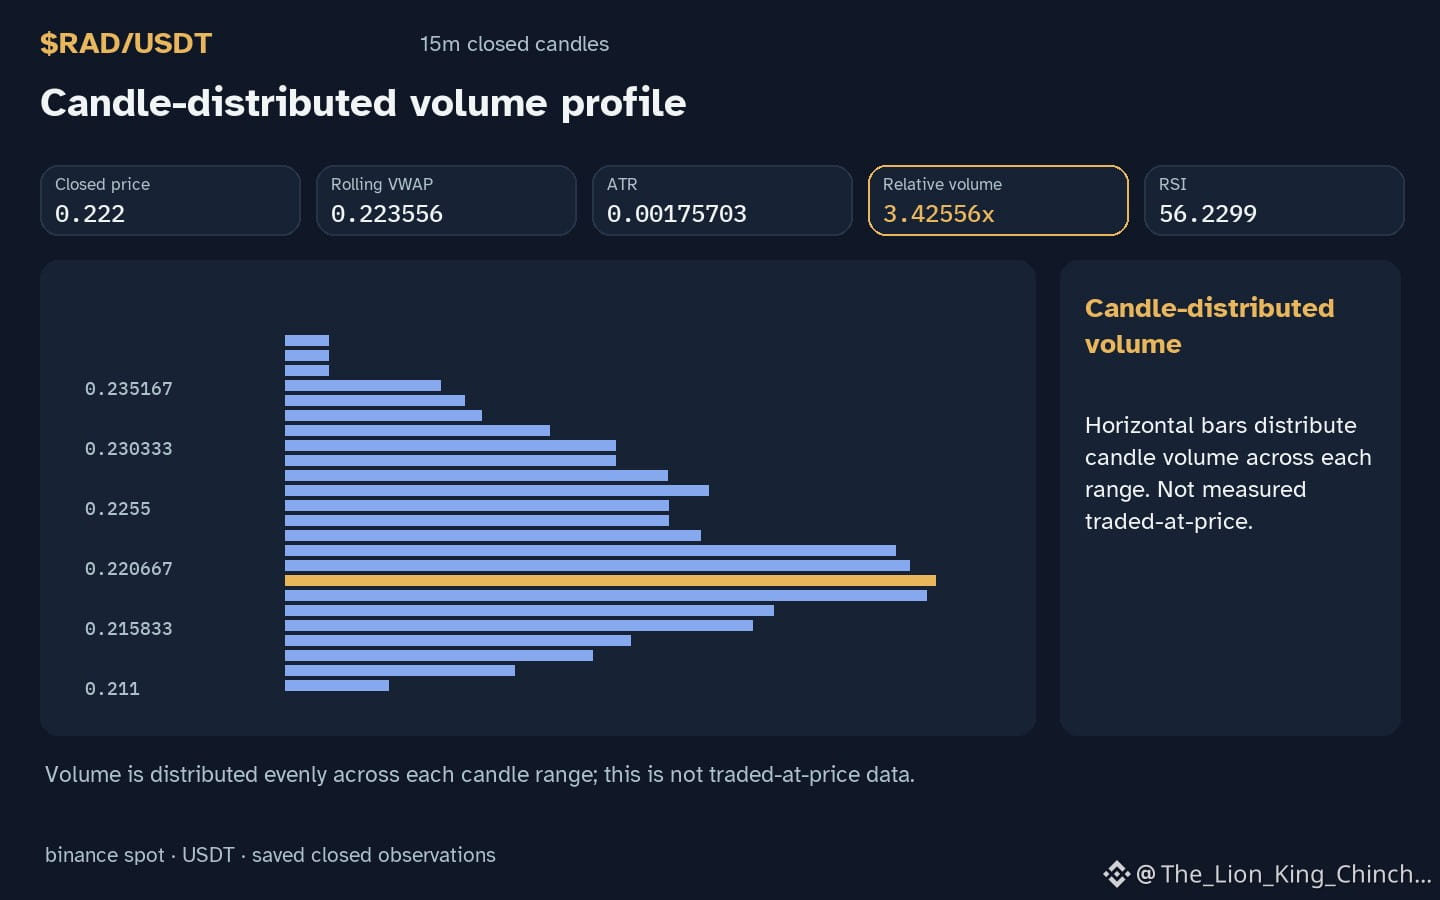
$RAD: Why Volume Can Confuse Its Direction
$RAD: Is there a one-way street between volume intensity and price direction? The watchlist stays calm while the mind rushes into a story. The habit asks more from the data than the data has offered. A candle glowing with $RAD carrying more energy than usual tempts a quick label.
Volume tells the engine hum, not the steering wheel. A rise in activity may accompany steady trades, scattered exits, or a mix of unknown participants. The engine runs, but the road has several turns. Treating extra volume as a fixed destination confuses loudness with meaning. This is a hypothetical mechanism for testing assumptions, not a declaration of what the agents actually did.
The self-check asks what would break the story. If a fall shows similar volume, the one-way rule collapses. The current rhythm shows 3.43x baseline, which is a ratio, not a verdict. This number supplies a frame and does not resolve the steering question. RSI at 56.2 measures momentum speed, not the volume itself. The two can move in awkward alignment or complete asymmetry. A high RSI with quiet volume reads differently than a high RSI with roaring volume.
The analogy helps because it forces the reader to define the measurement strictly. The analogy fails when it makes the future candle obey the current one. Close-candle evidence decides whether the direction is consistent or varied. If the recorded range flips while volume drops, the one-way claim loses its core support. The condition to reassess is finding quiet candles with decisive moves, or loud candles with sideways drift, which shatters the obvious linkage. Keep the watchlist calm by checking the steering wheel separately from the engine sound.
Probabilistic market research, not a recommendation or guaranteed return.
Watchlist contrast: $ETH has hourly direction up and volume not above its baseline; $MMT has hourly direction up and volume not above its baseline. This alone does not establish correlation.
#RAD #ETH #MMT #LearnCrypto #CryptoLearning
$RAD : Why Volume Can Confuse Its Direction
$RAD : Is there a one-way street between volume intensity and price direction? The watchlist stays calm while the mind rushes into a story. The habit asks more from the data than the data has offered. A candle glowing with $RAD carrying more energy than usual tempts a quick label.
Volume tells the engine hum, not the steering wheel. A rise in activity may accompany steady trades, scattered exits, or a mix of unknown participants. The engine runs, but the road has several turns. Treating extra volume as a fixed destination confuses loudness with meaning. This is a hypothetical mechanism for testing assumptions, not a declaration of what the agents actually did.
The self-check asks what would break the story. If a fall shows similar volume, the one-way rule collapses. The current rhythm shows 3.43x baseline, which is a ratio, not a verdict. This number supplies a frame and does not resolve the steering question. RSI at 56.2 measures momentum speed, not the volume itself. The two can move in awkward alignment or complete asymmetry. A high RSI with quiet volume reads differently than a high RSI with roaring volume.
The analogy helps because it forces the reader to define the measurement strictly. The analogy fails when it makes the future candle obey the current one. Close-candle evidence decides whether the direction is consistent or varied. If the recorded range flips while volume drops, the one-way claim loses its core support. The condition to reassess is finding quiet candles with decisive moves, or loud candles with sideways drift, which shatters the obvious linkage. Keep the watchlist calm by checking the steering wheel separately from the engine sound.
Probabilistic market research, not a recommendation or guaranteed return.
Watchlist contrast: $ETH has hourly direction up and volume not above its baseline; $MMT has hourly direction up and volume not above its baseline. This alone does not establish correlation.
#RAD #ETH #MMT #LearnCrypto #CryptoLearning
$RAD : Is there a one-way street between volume intensity and price direction? The watchlist stays calm while the mind rushes into a story. The habit asks more from the data than the data has offered. A candle glowing with $RAD carrying more energy than usual tempts a quick label.
Volume tells the engine hum, not the steering wheel. A rise in activity may accompany steady trades, scattered exits, or a mix of unknown participants. The engine runs, but the road has several turns. Treating extra volume as a fixed destination confuses loudness with meaning. This is a hypothetical mechanism for testing assumptions, not a declaration of what the agents actually did.
The self-check asks what would break the story. If a fall shows similar volume, the one-way rule collapses. The current rhythm shows 3.43x baseline, which is a ratio, not a verdict. This number supplies a frame and does not resolve the steering question. RSI at 56.2 measures momentum speed, not the volume itself. The two can move in awkward alignment or complete asymmetry. A high RSI with quiet volume reads differently than a high RSI with roaring volume.
The analogy helps because it forces the reader to define the measurement strictly. The analogy fails when it makes the future candle obey the current one. Close-candle evidence decides whether the direction is consistent or varied. If the recorded range flips while volume drops, the one-way claim loses its core support. The condition to reassess is finding quiet candles with decisive moves, or loud candles with sideways drift, which shatters the obvious linkage. Keep the watchlist calm by checking the steering wheel separately from the engine sound.
Probabilistic market research, not a recommendation or guaranteed return.
Watchlist contrast: $ETH has hourly direction up and volume not above its baseline; $MMT has hourly direction up and volume not above its baseline. This alone does not establish correlation.
#RAD #ETH #MMT #LearnCrypto #CryptoLearning
97

·
--
ブリッシュ
翻訳参照
#RAD #bitcoin piyasada btc düşüş hareketi yaşadı ama seçtiğimiz coinler güzel trade karı bıraktı. Bunlardan biride yüzümüzü hep güldüren rad oldu şimdi bitcoin yeqinki 82k ya doğru bir hareket etmek isteyecek rad nir önceki yükselişdeki yerine tekrar gelirse 0.42 bölgelerine biz durmadan trade ile 4x bir kar yeniden yakalaya biliriz
#RAD #bitcoin piyasada btc düşüş hareketi yaşadı ama seçtiğimiz coinler güzel trade karı bıraktı. Bunlardan biride yüzümüzü hep güldüren rad oldu şimdi bitcoin yeqinki 82k ya doğru bir hareket etmek isteyecek rad nir önceki yükselişdeki yerine tekrar gelirse 0.42 bölgelerine biz durmadan trade ile 4x bir kar yeniden yakalaya biliriz
124

·
--
$RAD +2.80% | $HEI +2.68% | $CAKE +1.96%
#RAD は0.2200ドルまで小幅に上昇し、取引高230万ドルで+2.80%となりました。この緩やかな上昇は短期的な買い圧力を示唆していますが、ブレイクアウトを確認するほど大きな動きではありません。
#HEI は0.0804ドルまで小幅に上昇し、同じく取引高230万ドルで+2.68%となりました。RADと連動した動きは、個別の関心というより、セクター全体の一時的な変動を示している可能性があります。
#CAKE は1.62ドルまで上昇し、取引高240万ドルで+1.96%となりました。上昇ペースが緩やかなのは、最近の上昇を受けた利益確定売りを反映しているのかもしれませんが、取引高は引き続き価格上昇を後押ししています。
🪙 3銘柄に共通するこの取引高の動きが、持続的な勢いにつながるか注目しましょう。
#Write2Earn #Binance
$RAD +2.80% | $HEI +2.68% | $CAKE +1.96%
#RAD は0.2200ドルまで小幅に上昇し、取引高230万ドルで+2.80%となりました。この緩やかな上昇は短期的な買い圧力を示唆していますが、ブレイクアウトを確認するほど大きな動きではありません。
#HEI は0.0804ドルまで小幅に上昇し、同じく取引高230万ドルで+2.68%となりました。RADと連動した動きは、個別の関心というより、セクター全体の一時的な変動を示している可能性があります。
#CAKE は1.62ドルまで上昇し、取引高240万ドルで+1.96%となりました。上昇ペースが緩やかなのは、最近の上昇を受けた利益確定売りを反映しているのかもしれませんが、取引高は引き続き価格上昇を後押ししています。
🪙 3銘柄に共通するこの取引高の動きが、持続的な勢いにつながるか注目しましょう。
#Write2Earn #Binance
#RAD は0.2200ドルまで小幅に上昇し、取引高230万ドルで+2.80%となりました。この緩やかな上昇は短期的な買い圧力を示唆していますが、ブレイクアウトを確認するほど大きな動きではありません。
#HEI は0.0804ドルまで小幅に上昇し、同じく取引高230万ドルで+2.68%となりました。RADと連動した動きは、個別の関心というより、セクター全体の一時的な変動を示している可能性があります。
#CAKE は1.62ドルまで上昇し、取引高240万ドルで+1.96%となりました。上昇ペースが緩やかなのは、最近の上昇を受けた利益確定売りを反映しているのかもしれませんが、取引高は引き続き価格上昇を後押ししています。
🪙 3銘柄に共通するこの取引高の動きが、持続的な勢いにつながるか注目しましょう。
#Write2Earn #Binance
4

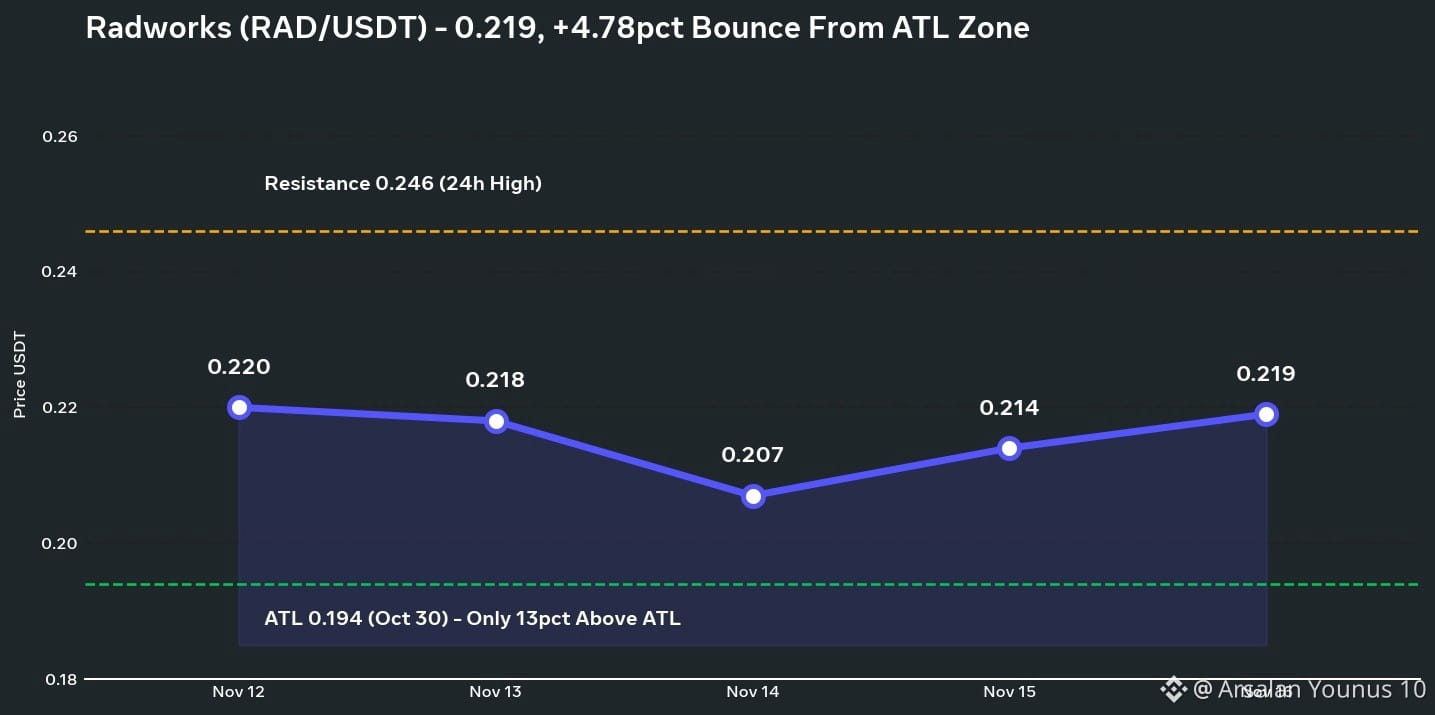
> $RAD $0.219 — 分散型GitHub、ATLをわずか13%上回る!*
> Radworks(RAD/USDT)は現在 *∼$0.219* で取引されており、*今日は+4.78%*、*5日間で+0.9%* — 今週値上がりしている数少ないコインのひとつ!
> *RADとは?*
> Radworks(旧称Radicle)は、*分散型GitHub*です。P2Pでコードを共同開発でき、Microsoftも中央サーバーも不要。開発者が自分のコードを所有します。コミュニティ主導で運営され、Ethereum上に構築されています。2021年2月にローンチ。
> *注目ポイントは?*
> 1. ATL圏:*$0.194(10月30日のATL)*まで下落し、現在は*ATLをわずか+13%上回る水準* — 投げ売り圏
> 2. 底堅さ:BTC/ETHが急落するなか、RADは3日連続で$0.20のサポートを維持($0.200、$0.202、$0.209)
> 3. 低時価総額の注目銘柄:時価総額はわずか*∼$13M* — 10倍になっても時価総額は$130M。小型銘柄は、出来高が増えれば大きく動く可能性あり
> *重要価格帯:*
> サポート:$0.209 -\u003e *$0.200*(心理的節目) -\u003e $0.194(ATL)
> レジスタンス:* $0.246*(24時間高値) -\u003e $0.266 -\u003e $0.30
> *統計:*
> 時価総額:*∼$13M* | 順位 #973
> 24時間取引高:*$12.18M* — 時価総額のほぼ100%が取引!マイクロキャップとしては非常に活発
> Binance取引高:$3.4M(取引所トップ)
> 流通量:59.05M / 100M RAD(59%)
> ATH:*$27.61(2021年4月15日)* — 現在は*-99.2%下落*
> ATL:$0.194(2026年10月30日)
> 1か月:-21.6% | 年初来:-27.88% | 1年:-38.19%
> *取引アイデア:*
> ハイリスク・ハイリターンのマイクロキャップ。失ってもよい資金だけで購入を。$0.20を維持すれば$0.246まで反発。$0.194を割れば新たなATL、撤退。
> ATHから-99%下落したコインを買いますか?
> コメントしてね 👇
> #RAD #BinanceSquareFamily #HKPlansDigitalAssetRegulatoryBillByYearEnd #cryptouniverseofficial
{spot}(RADUSDT)
> $RAD $0.219 — 分散型GitHub、ATLをわずか13%上回る!*
> Radworks(RAD/USDT)は現在 *∼$0.219* で取引されており、*今日は+4.78%*、*5日間で+0.9%* — 今週値上がりしている数少ないコインのひとつ!
> *RADとは?*
> Radworks(旧称Radicle)は、*分散型GitHub*です。P2Pでコードを共同開発でき、Microsoftも中央サーバーも不要。開発者が自分のコードを所有します。コミュニティ主導で運営され、Ethereum上に構築されています。2021年2月にローンチ。
> *注目ポイントは?*
> 1. ATL圏:*$0.194(10月30日のATL)*まで下落し、現在は*ATLをわずか+13%上回る水準* — 投げ売り圏
> 2. 底堅さ:BTC/ETHが急落するなか、RADは3日連続で$0.20のサポートを維持($0.200、$0.202、$0.209)
> 3. 低時価総額の注目銘柄:時価総額はわずか*∼$13M* — 10倍になっても時価総額は$130M。小型銘柄は、出来高が増えれば大きく動く可能性あり
> *重要価格帯:*
> サポート:$0.209 -\u003e *$0.200*(心理的節目) -\u003e $0.194(ATL)
> レジスタンス:* $0.246*(24時間高値) -\u003e $0.266 -\u003e $0.30
> *統計:*
> 時価総額:*∼$13M* | 順位 #973
> 24時間取引高:*$12.18M* — 時価総額のほぼ100%が取引!マイクロキャップとしては非常に活発
> Binance取引高:$3.4M(取引所トップ)
> 流通量:59.05M / 100M RAD(59%)
> ATH:*$27.61(2021年4月15日)* — 現在は*-99.2%下落*
> ATL:$0.194(2026年10月30日)
> 1か月:-21.6% | 年初来:-27.88% | 1年:-38.19%
> *取引アイデア:*
> ハイリスク・ハイリターンのマイクロキャップ。失ってもよい資金だけで購入を。$0.20を維持すれば$0.246まで反発。$0.194を割れば新たなATL、撤退。
> ATHから-99%下落したコインを買いますか?
> コメントしてね 👇
> #RAD #BinanceSquareFamily #HKPlansDigitalAssetRegulatoryBillByYearEnd #cryptouniverseofficial
> Radworks(RAD/USDT)は現在 *∼$0.219* で取引されており、*今日は+4.78%*、*5日間で+0.9%* — 今週値上がりしている数少ないコインのひとつ!
> *RADとは?*
> Radworks(旧称Radicle)は、*分散型GitHub*です。P2Pでコードを共同開発でき、Microsoftも中央サーバーも不要。開発者が自分のコードを所有します。コミュニティ主導で運営され、Ethereum上に構築されています。2021年2月にローンチ。
> *注目ポイントは?*
> 1. ATL圏:*$0.194(10月30日のATL)*まで下落し、現在は*ATLをわずか+13%上回る水準* — 投げ売り圏
> 2. 底堅さ:BTC/ETHが急落するなか、RADは3日連続で$0.20のサポートを維持($0.200、$0.202、$0.209)
> 3. 低時価総額の注目銘柄:時価総額はわずか*∼$13M* — 10倍になっても時価総額は$130M。小型銘柄は、出来高が増えれば大きく動く可能性あり
> *重要価格帯:*
> サポート:$0.209 -\u003e *$0.200*(心理的節目) -\u003e $0.194(ATL)
> レジスタンス:* $0.246*(24時間高値) -\u003e $0.266 -\u003e $0.30
> *統計:*
> 時価総額:*∼$13M* | 順位 #973
> 24時間取引高:*$12.18M* — 時価総額のほぼ100%が取引!マイクロキャップとしては非常に活発
> Binance取引高:$3.4M(取引所トップ)
> 流通量:59.05M / 100M RAD(59%)
> ATH:*$27.61(2021年4月15日)* — 現在は*-99.2%下落*
> ATL:$0.194(2026年10月30日)
> 1か月:-21.6% | 年初来:-27.88% | 1年:-38.19%
> *取引アイデア:*
> ハイリスク・ハイリターンのマイクロキャップ。失ってもよい資金だけで購入を。$0.20を維持すれば$0.246まで反発。$0.194を割れば新たなATL、撤退。
> ATHから-99%下落したコインを買いますか?
> コメントしてね 👇
> #RAD #BinanceSquareFamily #HKPlansDigitalAssetRegulatoryBillByYearEnd #cryptouniverseofficial
juliusjulius:
sim , compraria e como já estou comprado , e vc está em uma análise perfeita
4
296

·
--
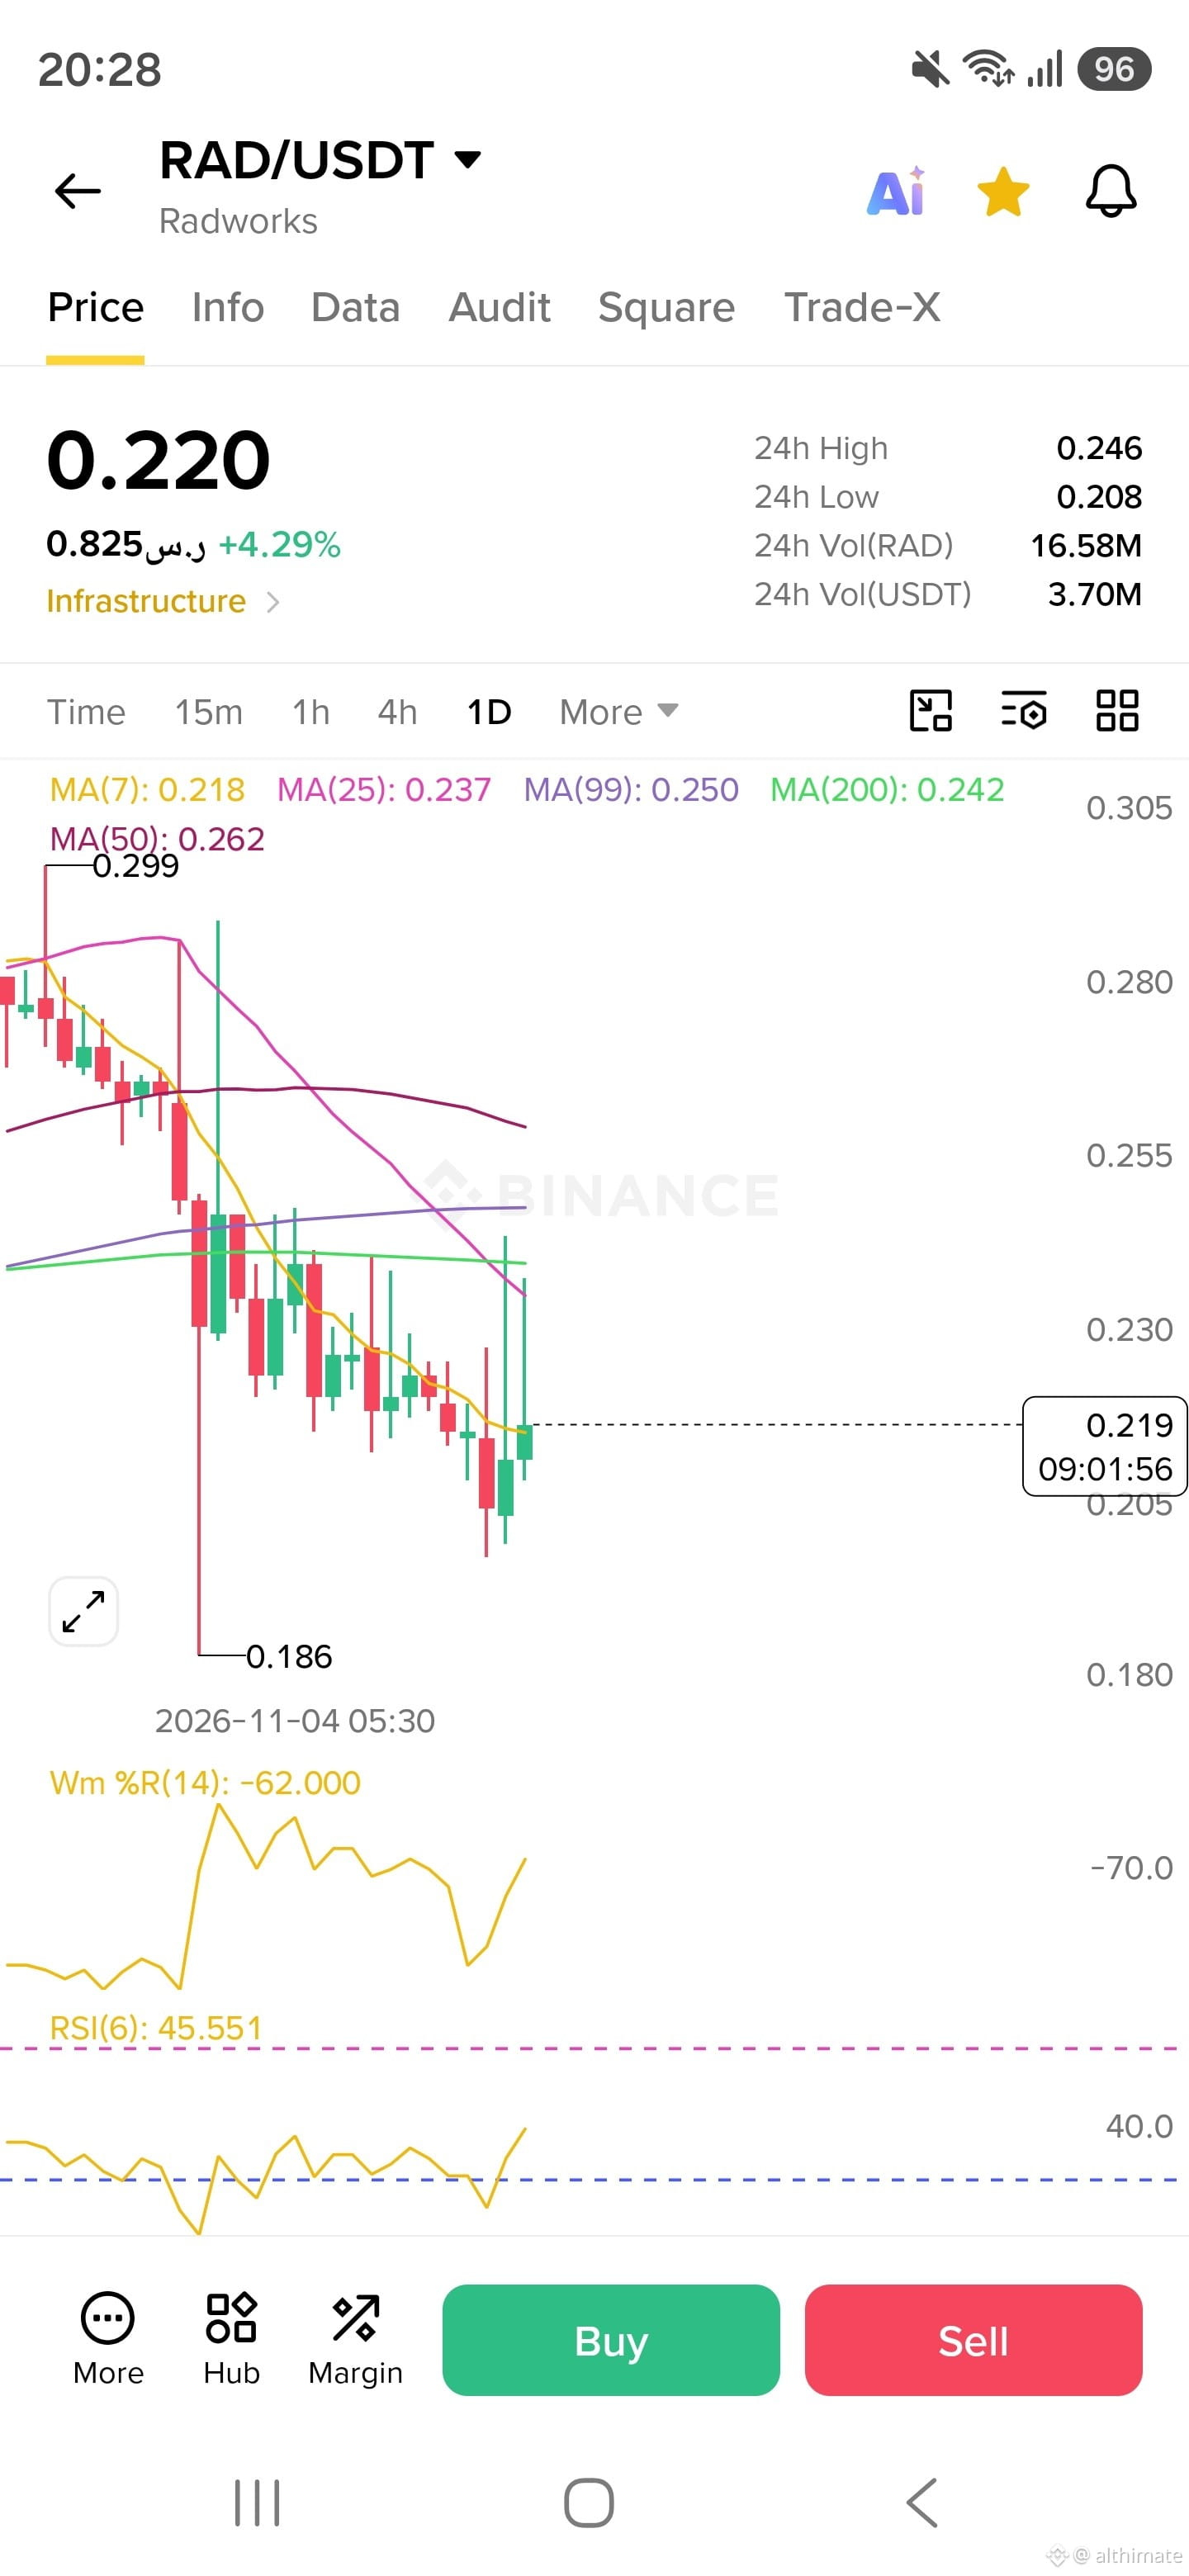
フィードが気づく前に捉えた。$RAD 👀
板がようやく動き始めた頃、価格は約$0.2190で推移していた。24時間で4.79%上昇、取引高は$3.45Mで、出来高は20日平均の2.1倍。
注目しているのはそこ。
4時間足の値動きはわずか+0.5%、RSIは53、資金調達率は0.000%で横ばい。だから、まだ過熱したパーペチュアル先物のお祭り騒ぎというわけではない。それでも価格は20日移動平均線と50日移動平均線を下回っていて、大きなトレンドが明確に反転したとは言えない。
$XRPとは違う展開。
$0.22では、強気に動く前にその水準をしっかり維持できるか見たい。そこで跳ね返されるなら、陽線を追いかけたりはしない。😅
RADについて、何か見落としてる?
#RAD #CryptoNews #暗号資産
フィードが気づく前に捉えた。$RAD 👀
板がようやく動き始めた頃、価格は約$0.2190で推移していた。24時間で4.79%上昇、取引高は$3.45Mで、出来高は20日平均の2.1倍。
注目しているのはそこ。
4時間足の値動きはわずか+0.5%、RSIは53、資金調達率は0.000%で横ばい。だから、まだ過熱したパーペチュアル先物のお祭り騒ぎというわけではない。それでも価格は20日移動平均線と50日移動平均線を下回っていて、大きなトレンドが明確に反転したとは言えない。
$XRP とは違う展開。
$0.22では、強気に動く前にその水準をしっかり維持できるか見たい。そこで跳ね返されるなら、陽線を追いかけたりはしない。😅
RADについて、何か見落としてる?
#RAD #CryptoNews #暗号資産
板がようやく動き始めた頃、価格は約$0.2190で推移していた。24時間で4.79%上昇、取引高は$3.45Mで、出来高は20日平均の2.1倍。
注目しているのはそこ。
4時間足の値動きはわずか+0.5%、RSIは53、資金調達率は0.000%で横ばい。だから、まだ過熱したパーペチュアル先物のお祭り騒ぎというわけではない。それでも価格は20日移動平均線と50日移動平均線を下回っていて、大きなトレンドが明確に反転したとは言えない。
$XRP とは違う展開。
$0.22では、強気に動く前にその水準をしっかり維持できるか見たい。そこで跳ね返されるなら、陽線を追いかけたりはしない。😅
RADについて、何か見落としてる?
#RAD #CryptoNews #暗号資産

·
--
ブリッシュ
🚀 RADUSDT 現物
🟢 エントリー: 0.210 – 0.220
🎯 目標:
T1: 0.250
T2: 0.300
T3: 0.400
$RAD
$SOL $XRP
{spot}(RADUSDT)
#AnthropicIPOTestsInvestorAppetiteForAI #RAD
🚀 RADUSDT 現物
🟢 エントリー: 0.210 – 0.220
🎯 目標:
T1: 0.250
T2: 0.300
T3: 0.400
$RAD
$SOL $XRP
#AnthropicIPOTestsInvestorAppetiteForAI #RAD
🟢 エントリー: 0.210 – 0.220
🎯 目標:
T1: 0.250
T2: 0.300
T3: 0.400
$RAD
$SOL $XRP
#AnthropicIPOTestsInvestorAppetiteForAI #RAD
juliusjulius:
boa tarde amigo , eu concordo mas está demorando um pouco , mas está firme.
1
221

·
--
翻訳参照
$RAD +6.60% | $SOXSB +5.85% | $ASTER +4.33%
#RAD slipped up to $0.2260, up +6.60% on $3.5 M of volume. Its sovereign developer stack aims to let creators host, collaborate and reward open‑source code, a narrative that could draw more dev‑funding.
#SOXSB nudged higher to $56.97, gaining +5.85% with $3.4 M traded. The modest volume suggests the move may be driven by short‑term positioning rather than a fundamental shift.
#ASTER rose to $0.5489, up +4.33% on a hefty $58.9 M of volume. The decentralized perpetual exchange’s hidden‑order feature is sparking interest across multiple chains, fueling the buying pressure.
Watch the disparity between SOXSB’s light volume and ASTER’s deep liquidity; it may hint at where sustained buying power is concentrating.
#Write2Earn #Binance
$RAD +6.60% | $SOXSB +5.85% | $ASTER +4.33%
#RAD slipped up to $0.2260, up +6.60% on $3.5 M of volume. Its sovereign developer stack aims to let creators host, collaborate and reward open‑source code, a narrative that could draw more dev‑funding.
#SOXSB nudged higher to $56.97, gaining +5.85% with $3.4 M traded. The modest volume suggests the move may be driven by short‑term positioning rather than a fundamental shift.
#ASTER rose to $0.5489, up +4.33% on a hefty $58.9 M of volume. The decentralized perpetual exchange’s hidden‑order feature is sparking interest across multiple chains, fueling the buying pressure.
Watch the disparity between SOXSB’s light volume and ASTER’s deep liquidity; it may hint at where sustained buying power is concentrating.
#Write2Earn #Binance
#RAD slipped up to $0.2260, up +6.60% on $3.5 M of volume. Its sovereign developer stack aims to let creators host, collaborate and reward open‑source code, a narrative that could draw more dev‑funding.
#SOXSB nudged higher to $56.97, gaining +5.85% with $3.4 M traded. The modest volume suggests the move may be driven by short‑term positioning rather than a fundamental shift.
#ASTER rose to $0.5489, up +4.33% on a hefty $58.9 M of volume. The decentralized perpetual exchange’s hidden‑order feature is sparking interest across multiple chains, fueling the buying pressure.
Watch the disparity between SOXSB’s light volume and ASTER’s deep liquidity; it may hint at where sustained buying power is concentrating.
#Write2Earn #Binance
4
·
--
🚨 $RAD 強気の勢いが加速する中、重要な流動性ゾーンを奪還 📈
エントリー:$0.225–$0.231 ⚡
目標:$0.235、$0.240、$0.246 🚀
損切り:$0.218 ⚠️
$RAD の機関投資家の注文フローは、$0.220の水準を上回る明確な吸収局面を示しており、流動性の薄いプールを一掃しています。📊 買い手は、より高いレジスタンス帯に向けた着実な続伸を後押しするため、奪還した構造的水準を積極的に守っています。⚡
オーダーブロックの再テストは、マクロのスイングポジションを構築するうえで、リスクを明確に設定できる機会となります。💡 この構造的な水準の奪還に合わせて段階的に買い増しますか?それとも、$0.235を上回る日足終値が確認されるまで待ちますか?🤔
⚠️ 金融アドバイスではありません。常にリスク管理を行ってください。🛡️
🏷️ #RAD #SmartMoney #Crypto #BreakoutSetup
🦈 💎
🚨 $RAD 強気の勢いが加速する中、重要な流動性ゾーンを奪還 📈
エントリー:$0.225–$0.231 ⚡
目標:$0.235、$0.240、$0.246 🚀
損切り:$0.218 ⚠️
$RAD の機関投資家の注文フローは、$0.220の水準を上回る明確な吸収局面を示しており、流動性の薄いプールを一掃しています。📊 買い手は、より高いレジスタンス帯に向けた着実な続伸を後押しするため、奪還した構造的水準を積極的に守っています。⚡
オーダーブロックの再テストは、マクロのスイングポジションを構築するうえで、リスクを明確に設定できる機会となります。💡 この構造的な水準の奪還に合わせて段階的に買い増しますか?それとも、$0.235を上回る日足終値が確認されるまで待ちますか?🤔
⚠️ 金融アドバイスではありません。常にリスク管理を行ってください。🛡️
🏷️ #RAD #SmartMoney #Crypto #BreakoutSetup
🦈 💎
エントリー:$0.225–$0.231 ⚡
目標:$0.235、$0.240、$0.246 🚀
損切り:$0.218 ⚠️
$RAD の機関投資家の注文フローは、$0.220の水準を上回る明確な吸収局面を示しており、流動性の薄いプールを一掃しています。📊 買い手は、より高いレジスタンス帯に向けた着実な続伸を後押しするため、奪還した構造的水準を積極的に守っています。⚡
オーダーブロックの再テストは、マクロのスイングポジションを構築するうえで、リスクを明確に設定できる機会となります。💡 この構造的な水準の奪還に合わせて段階的に買い増しますか?それとも、$0.235を上回る日足終値が確認されるまで待ちますか?🤔
⚠️ 金融アドバイスではありません。常にリスク管理を行ってください。🛡️
🏷️ #RAD #SmartMoney #Crypto #BreakoutSetup
🦈 💎
4
·
--
ブリッシュ
翻訳参照
While others are with their wallets
Check this coin out $RAD
{spot}(RADUSDT)
Are you grabbing $RAD at $0.22 before the next leg up to $1?
{spot}(USD1USDT)
Drop your price target below! 👇
#RAD #Altcoins #CryptoInvesting💰📈📊 #LowCapGems #BİNANCESQUARE
While others are with their wallets
Check this coin out $RAD
Are you grabbing $RAD at $0.22 before the next leg up to $1?
Drop your price target below! 👇
#RAD #Altcoins #CryptoInvesting💰📈📊 #LowCapGems #BİNANCESQUARE
Check this coin out $RAD
Are you grabbing $RAD at $0.22 before the next leg up to $1?
Drop your price target below! 👇
#RAD #Altcoins #CryptoInvesting💰📈📊 #LowCapGems #BİNANCESQUARE
277

·
--
翻訳参照
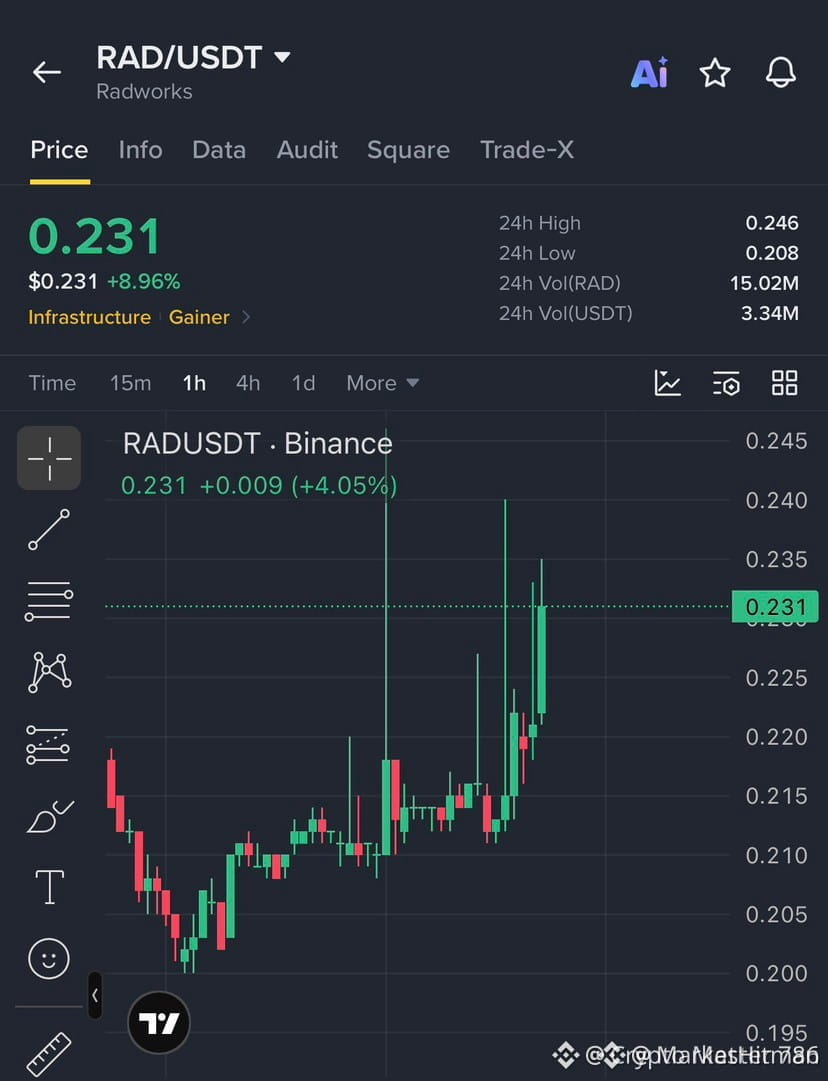
🚀 $RAD BUYERS ARE TIGHTENING THE COIL AS MOMENTUM BUILDS FOR A BREAKOUT ⚡
Entry: $0.225–$0.231 🟢
Target: $0.235 / $0.240 / $0.246 🚀
Stop Loss: $0.218 ⚠️
Sellers are losing their grip as price action curls upward from the recent lows. Volume is starting to expand nicely across the lower timeframes, showing genuine accumulation rather than empty air. 📊
Holding that $0.220 floor was the litmus test bulls needed to prove their commitment. Now the order book is thinning out toward the upper targets, setting the stage for a clean expansion if momentum holds. ⚡
💬 Are you positioning ahead of the breakout or waiting for a confirmed retest? 👇
⚠️ Not financial advice. Always manage your risk. 🛡️
🏷️ #RAD #Momentum #Breakout #Crypto
🔥 💎
🚀 $RAD BUYERS ARE TIGHTENING THE COIL AS MOMENTUM BUILDS FOR A BREAKOUT ⚡
Entry: $0.225–$0.231 🟢
Target: $0.235 / $0.240 / $0.246 🚀
Stop Loss: $0.218 ⚠️
Sellers are losing their grip as price action curls upward from the recent lows. Volume is starting to expand nicely across the lower timeframes, showing genuine accumulation rather than empty air. 📊
Holding that $0.220 floor was the litmus test bulls needed to prove their commitment. Now the order book is thinning out toward the upper targets, setting the stage for a clean expansion if momentum holds. ⚡
💬 Are you positioning ahead of the breakout or waiting for a confirmed retest? 👇
⚠️ Not financial advice. Always manage your risk. 🛡️
🏷️ #RAD #Momentum #Breakout #Crypto
🔥 💎
Entry: $0.225–$0.231 🟢
Target: $0.235 / $0.240 / $0.246 🚀
Stop Loss: $0.218 ⚠️
Sellers are losing their grip as price action curls upward from the recent lows. Volume is starting to expand nicely across the lower timeframes, showing genuine accumulation rather than empty air. 📊
Holding that $0.220 floor was the litmus test bulls needed to prove their commitment. Now the order book is thinning out toward the upper targets, setting the stage for a clean expansion if momentum holds. ⚡
💬 Are you positioning ahead of the breakout or waiting for a confirmed retest? 👇
⚠️ Not financial advice. Always manage your risk. 🛡️
🏷️ #RAD #Momentum #Breakout #Crypto
🔥 💎
5

翻訳参照
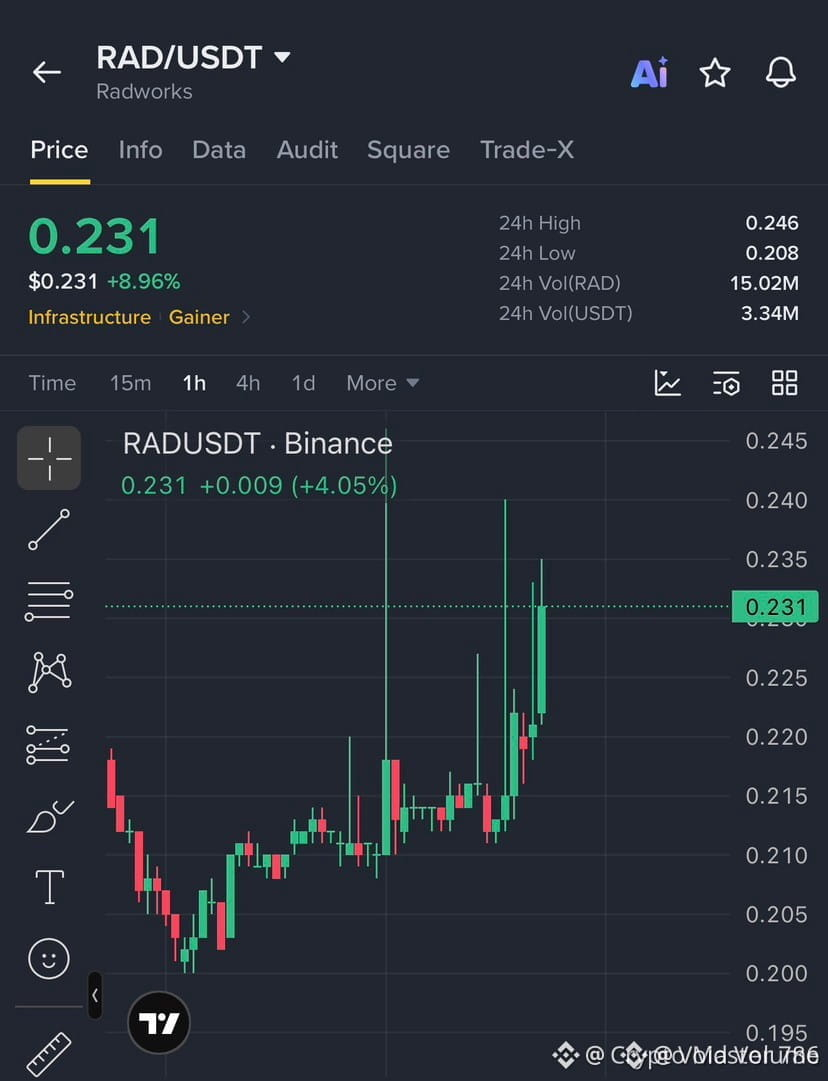
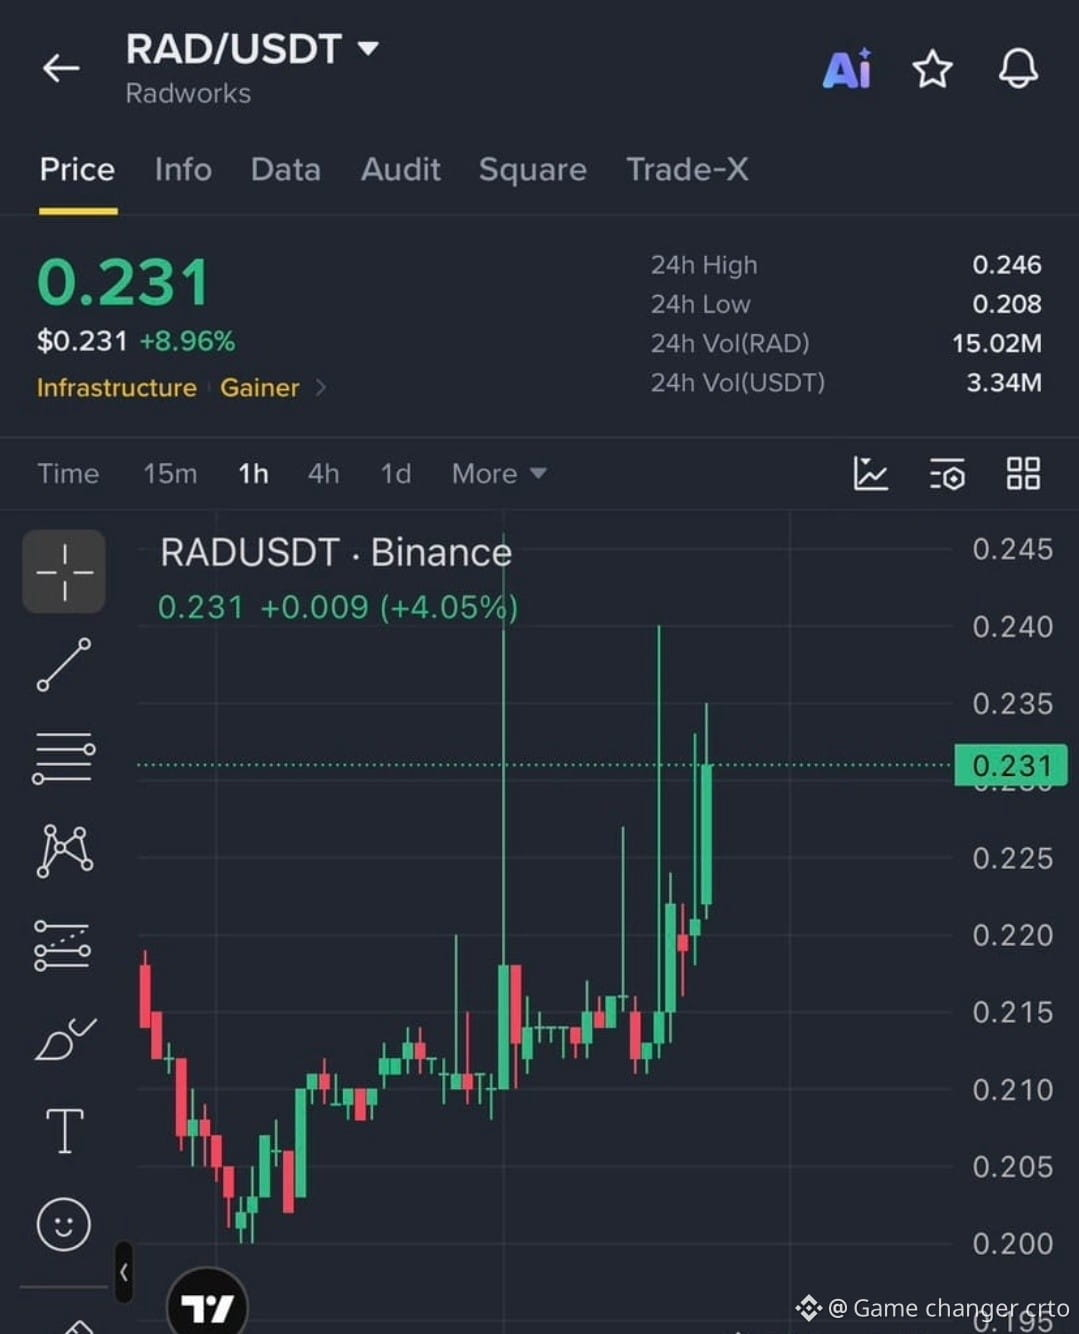
$RAD (Radworks) – Bullish Momentum!
🔥 Price: $0.231 (+8.96%) 📈 24H High: $0.246 📉 24H Low: $0.208 💰 24H Volume: $3.34M
$RAD is showing strong buying pressure! 👀
Watch the $0.246 resistance for a potential breakout.
DYOR | NFA ⚠️
#RAD #Radworks #Crypto #Infrastructure #AI #Binance
$RAD (Radworks) – Bullish Momentum!
🔥 Price: $0.231 (+8.96%) 📈 24H High: $0.246 📉 24H Low: $0.208 💰 24H Volume: $3.34M
$RAD is showing strong buying pressure! 👀
Watch the $0.246 resistance for a potential breakout.
DYOR | NFA ⚠️
#RAD #Radworks #Crypto #Infrastructure #AI #Binance
🔥 Price: $0.231 (+8.96%) 📈 24H High: $0.246 📉 24H Low: $0.208 💰 24H Volume: $3.34M
$RAD is showing strong buying pressure! 👀
Watch the $0.246 resistance for a potential breakout.
DYOR | NFA ⚠️
#RAD #Radworks #Crypto #Infrastructure #AI #Binance
1
23

·
--
翻訳参照
$RAD looks ready to go up from here
Buying $RAD between 0.22537 and 0.23116
Invalid below 0.20714
Taking profit at 0.26429 0.28714 0.32143
Trading volume is 8.8 times higher than normal
Up 8.5 percent today and holding strong
Price is in the zone right now
Tap $RAD to buy
Taking it or watching it
#RAD #TradingSignals
$RAD looks ready to go up from here
Buying $RAD between 0.22537 and 0.23116
Invalid below 0.20714
Taking profit at 0.26429 0.28714 0.32143
Trading volume is 8.8 times higher than normal
Up 8.5 percent today and holding strong
Price is in the zone right now
Tap $RAD to buy
Taking it or watching it
#RAD #TradingSignals
Buying $RAD between 0.22537 and 0.23116
Invalid below 0.20714
Taking profit at 0.26429 0.28714 0.32143
Trading volume is 8.8 times higher than normal
Up 8.5 percent today and holding strong
Price is in the zone right now
Tap $RAD to buy
Taking it or watching it
#RAD #TradingSignals
4
·
--
$RAD +8.45% | $SOXSB +7.30% | $PROM +4.28%
#RADの価格は0.2310ドルに小幅上昇し、取引高330万ドルで+8.45%となりました。主権的な開発者向けスタックを構築するというプロジェクトの取り組みは、より多くのオープンソース貢献者を引きつける可能性があります。
#SOXSB は57.78ドルまで上昇し、同じく330万ドルの取引高で+7.30%となりました。取引高が控えめなことから、少数の大口投資家が値動きを主導している可能性があります。
#PROM は5.19ドルまで上昇し、取引高160万ドルで+4.28%となりました。このトークンの売買高が低いことは、現時点で市場の厚みが比較的乏しいことを示唆しています。
🔍 RADの開発者向けスタックというストーリーが、継続的な買い圧力につながるかどうかが注目されます。
#Write2Earn #Binance
$RAD +8.45% | $SOXSB +7.30% | $PROM +4.28%
#RADの価格は0.2310ドルに小幅上昇し、取引高330万ドルで+8.45%となりました。主権的な開発者向けスタックを構築するというプロジェクトの取り組みは、より多くのオープンソース貢献者を引きつける可能性があります。
#SOXSB は57.78ドルまで上昇し、同じく330万ドルの取引高で+7.30%となりました。取引高が控えめなことから、少数の大口投資家が値動きを主導している可能性があります。
#PROM は5.19ドルまで上昇し、取引高160万ドルで+4.28%となりました。このトークンの売買高が低いことは、現時点で市場の厚みが比較的乏しいことを示唆しています。
🔍 RADの開発者向けスタックというストーリーが、継続的な買い圧力につながるかどうかが注目されます。
#Write2Earn #Binance
#RADの価格は0.2310ドルに小幅上昇し、取引高330万ドルで+8.45%となりました。主権的な開発者向けスタックを構築するというプロジェクトの取り組みは、より多くのオープンソース貢献者を引きつける可能性があります。
#SOXSB は57.78ドルまで上昇し、同じく330万ドルの取引高で+7.30%となりました。取引高が控えめなことから、少数の大口投資家が値動きを主導している可能性があります。
#PROM は5.19ドルまで上昇し、取引高160万ドルで+4.28%となりました。このトークンの売買高が低いことは、現時点で市場の厚みが比較的乏しいことを示唆しています。
🔍 RADの開発者向けスタックというストーリーが、継続的な買い圧力につながるかどうかが注目されます。
#Write2Earn #Binance
4

·
--
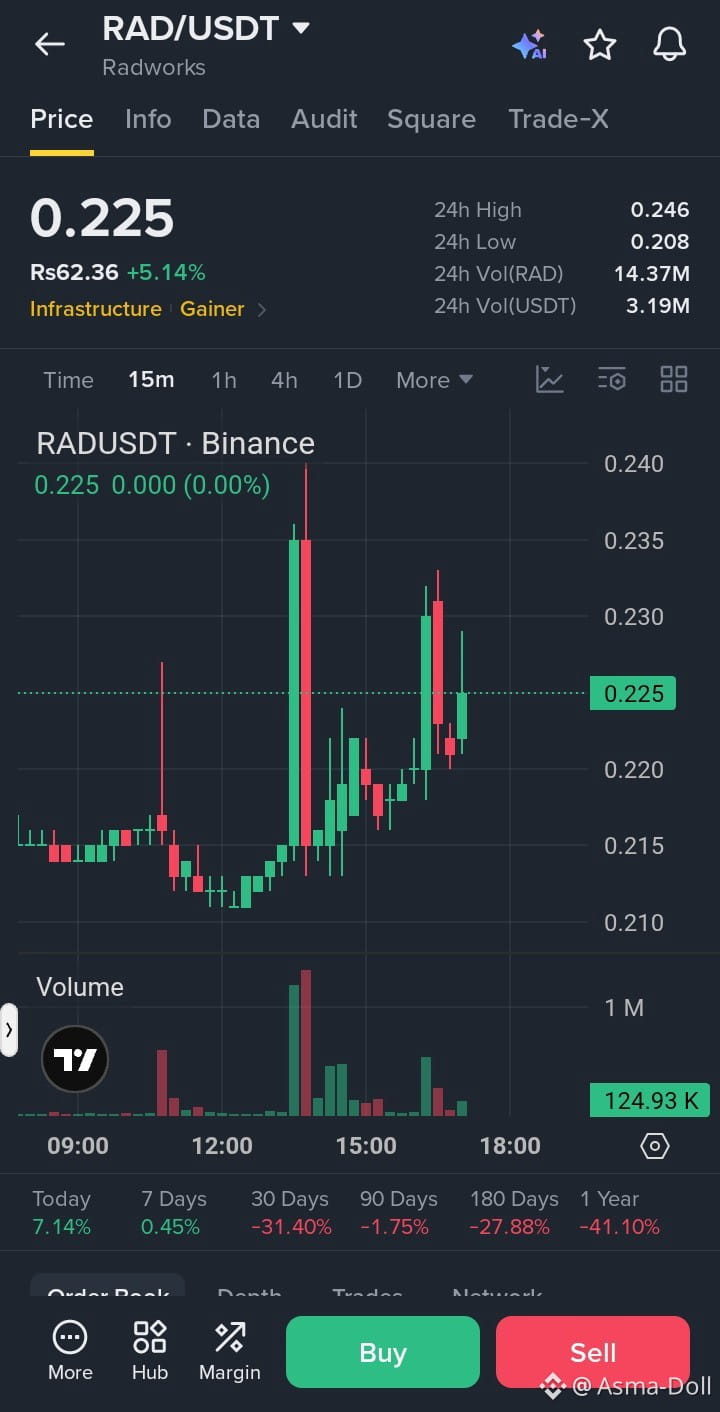
📉 $RAD /USDT – ショートシグナル
エントリーゾーン: $0.2240 – $0.2280
損切り (SL): $0.2380
利確目標:
* TP1: $0.2180
* TP2: $0.2120
* TP3: $0.2050
取引はこちら $RAD
{spot}(RADUSDT)
分析:
* $0.246のレジスタンス付近で強い反落。
* 価格は上昇の勢いを維持できずにいる。
* 直近30日間のパフォーマンスは-31.40%で、市場全体の弱さを示している。
* 現在の反発は売り圧力に直面する可能性がある。
* $0.220を下抜けると、さらに下落する可能性がある。
確認事項: ショートエントリーの前に、売り出来高の増加を伴う15分足のローソク足が、$0.220を明確に下回って確定するのを待ちましょう。
リスクリワード: エントリー価格に応じて、各目標の比率はおよそ1:0.5~1:1.4です。TP3が最も高いリターンを見込めます。
⚠️ 価格を追いかけてエントリーするのは避けましょう。確認を待ち、リスクを慎重に管理してください。
#RAD #RADUSDT #BinanceFutures #CryptoSignals #ShortSetup
📉 $RAD /USDT – ショートシグナル
エントリーゾーン: $0.2240 – $0.2280
損切り (SL): $0.2380
利確目標:
* TP1: $0.2180
* TP2: $0.2120
* TP3: $0.2050
取引はこちら $RAD
分析:
* $0.246のレジスタンス付近で強い反落。
* 価格は上昇の勢いを維持できずにいる。
* 直近30日間のパフォーマンスは-31.40%で、市場全体の弱さを示している。
* 現在の反発は売り圧力に直面する可能性がある。
* $0.220を下抜けると、さらに下落する可能性がある。
確認事項: ショートエントリーの前に、売り出来高の増加を伴う15分足のローソク足が、$0.220を明確に下回って確定するのを待ちましょう。
リスクリワード: エントリー価格に応じて、各目標の比率はおよそ1:0.5~1:1.4です。TP3が最も高いリターンを見込めます。
⚠️ 価格を追いかけてエントリーするのは避けましょう。確認を待ち、リスクを慎重に管理してください。
#RAD #RADUSDT #BinanceFutures #CryptoSignals #ShortSetup
エントリーゾーン: $0.2240 – $0.2280
損切り (SL): $0.2380
利確目標:
* TP1: $0.2180
* TP2: $0.2120
* TP3: $0.2050
取引はこちら $RAD
分析:
* $0.246のレジスタンス付近で強い反落。
* 価格は上昇の勢いを維持できずにいる。
* 直近30日間のパフォーマンスは-31.40%で、市場全体の弱さを示している。
* 現在の反発は売り圧力に直面する可能性がある。
* $0.220を下抜けると、さらに下落する可能性がある。
確認事項: ショートエントリーの前に、売り出来高の増加を伴う15分足のローソク足が、$0.220を明確に下回って確定するのを待ちましょう。
リスクリワード: エントリー価格に応じて、各目標の比率はおよそ1:0.5~1:1.4です。TP3が最も高いリターンを見込めます。
⚠️ 価格を追いかけてエントリーするのは避けましょう。確認を待ち、リスクを慎重に管理してください。
#RAD #RADUSDT #BinanceFutures #CryptoSignals #ShortSetup
42
·
--
$RAD +2.37% | $LDO +1.86% | $WLD +1.76%
#RAD は$0.2160で推移し、出来高300万ドルで+2.37%上昇しています。開発者がオープンソースプロジェクトをホストし、共同作業し、収益を得られるようにする独自の開発者向けスタックが、緩やかな上昇を後押しする可能性があります。
#LDO は$0.2786で取引され、出来高110万ドルで+1.86%上昇しました。取引の流れは穏やかで、急激な急増はないものの、安定した関心がうかがえます。
#WLD は$0.2656まで上昇し、比較的堅調な出来高910万ドルを伴って+1.76%となり、より幅広い市場参加を示しています。
👀 RADの開発者中心のストーリーが、出来高の大きいWLDに対してどのように展開するか注目しましょう。トレーダーの関心の移り変わりを示す可能性があります。
#Write2Earn #Binance
$RAD +2.37% | $LDO +1.86% | $WLD +1.76%
#RAD は$0.2160で推移し、出来高300万ドルで+2.37%上昇しています。開発者がオープンソースプロジェクトをホストし、共同作業し、収益を得られるようにする独自の開発者向けスタックが、緩やかな上昇を後押しする可能性があります。
#LDO は$0.2786で取引され、出来高110万ドルで+1.86%上昇しました。取引の流れは穏やかで、急激な急増はないものの、安定した関心がうかがえます。
#WLD は$0.2656まで上昇し、比較的堅調な出来高910万ドルを伴って+1.76%となり、より幅広い市場参加を示しています。
👀 RADの開発者中心のストーリーが、出来高の大きいWLDに対してどのように展開するか注目しましょう。トレーダーの関心の移り変わりを示す可能性があります。
#Write2Earn #Binance
#RAD は$0.2160で推移し、出来高300万ドルで+2.37%上昇しています。開発者がオープンソースプロジェクトをホストし、共同作業し、収益を得られるようにする独自の開発者向けスタックが、緩やかな上昇を後押しする可能性があります。
#LDO は$0.2786で取引され、出来高110万ドルで+1.86%上昇しました。取引の流れは穏やかで、急激な急増はないものの、安定した関心がうかがえます。
#WLD は$0.2656まで上昇し、比較的堅調な出来高910万ドルを伴って+1.76%となり、より幅広い市場参加を示しています。
👀 RADの開発者中心のストーリーが、出来高の大きいWLDに対してどのように展開するか注目しましょう。トレーダーの関心の移り変わりを示す可能性があります。
#Write2Earn #Binance
9
ログインして、さらにコンテンツを読む
厳選トピックで世界の暗号資産トレーダーの仲間入り
⚡️ 暗号資産に関する最新かつ有益な情報が見つかります。
💬 世界最大の暗号資産取引所から信頼されています。
👍 認証を受けたクリエイターから、有益なインサイトを得られます。
メール / 電話番号
トレンドトピック
1
#IsAnthropic’s$1.5TMarketCapJustified?
閲覧回数 11,732
97人が討論中
2
#BTCRemainsUnderPressureAfterHawkishFOMCMinutes
閲覧回数 253,730
2,123人が討論中
3
#NvidiaBoardReportedlySplitOverHuang’sReturn
閲覧回数 123,695
1,145人が討論中
4
#StrategySTRCPreferredSlips3.65%Below$100Par
閲覧回数 8,314
80人が討論中
5
#MASToUpgradeSGDTestnetToSGDigitalLedger
閲覧回数 23,286
276人が討論中
6
#CanGTA6'sLaunchLiftTTWOShares?
閲覧回数 89,405
829人が討論中
7
#Solana2027RoadmapTargetsDoubleComputeCapacity
閲覧回数 10,141
142人が討論中
8
#InjectiveTokenizedRealEstateMortgagesTop$1.5B
閲覧回数 1,213
29人が討論中
9
#TetherMakesStrategicInvestmentInSCRYPT
閲覧回数 7,306
113人が討論中
10
#CapitalGroupAdds1264500StrategyShares
閲覧回数 32,693
244人が討論中