

#nvidiaaicapitalchain
nvidiaaicapitalchain
閲覧回数 143
5人が討論中
注目
最新

BTC vs $ETH — なぜ資本がイーサリアムへ向かい始めているのか?
$BTC が厳しいレンジに張り付いている中、注目は徐々に $ETH に移っています。
大きな変化は価格だけではありません——それは「物語」です。
イーサリアムは、単なる別の暗号資産ではなく、オンチェーン・ファイナンスの中核インフラとしてますます位置づけられています。
ステーブルコインの決済、トークン化された現実世界の資産、DeFi、そして機関投資家のユースケースが、イーサリアム・エコシステムの周りで拡大しています。
しかし、それは ETH の急騰を保証するものではありません。
重要なのは、資本が実際に物語に付いてくるかどうかです。👀
#OpenAIAnthropicRace
#WeakConsumptionFedSplit
#NvidiaAICapitalChain
BTC vs $ETH — なぜ資本がイーサリアムへ向かい始めているのか?
$BTC が厳しいレンジに張り付いている中、注目は徐々に $ETH に移っています。
大きな変化は価格だけではありません——それは「物語」です。
イーサリアムは、単なる別の暗号資産ではなく、オンチェーン・ファイナンスの中核インフラとしてますます位置づけられています。
ステーブルコインの決済、トークン化された現実世界の資産、DeFi、そして機関投資家のユースケースが、イーサリアム・エコシステムの周りで拡大しています。
しかし、それは ETH の急騰を保証するものではありません。
重要なのは、資本が実際に物語に付いてくるかどうかです。👀
#OpenAIAnthropicRace
#WeakConsumptionFedSplit
#NvidiaAICapitalChain
$BTC が厳しいレンジに張り付いている中、注目は徐々に $ETH に移っています。
大きな変化は価格だけではありません——それは「物語」です。
イーサリアムは、単なる別の暗号資産ではなく、オンチェーン・ファイナンスの中核インフラとしてますます位置づけられています。
ステーブルコインの決済、トークン化された現実世界の資産、DeFi、そして機関投資家のユースケースが、イーサリアム・エコシステムの周りで拡大しています。
しかし、それは ETH の急騰を保証するものではありません。
重要なのは、資本が実際に物語に付いてくるかどうかです。👀
#OpenAIAnthropicRace
#WeakConsumptionFedSplit
#NvidiaAICapitalChain
39

·
--
🚀 Nvidiaは小売市場の実力者になりつつあります。
個人投資家は過去1年間で$NVDA に$27B+を投じており、AIインフラ分野への強い確信を示しています。
より大きなシグナル:個人資本は、構造的な成長、大規模なデータセンター需要、そして支配的なチップ経済性を備えたAIリーダーへと、ますます向かっています。
$NVDA は今、個人投資家のお気に入りのAI資産なのでしょうか?
$XNVDA #NvidiaAICapitalChain $AAPL #SP500EarningsGap #NvidiaAICapitalChain
🚀 Nvidiaは小売市場の実力者になりつつあります。
個人投資家は過去1年間で$NVDA に$27B+を投じており、AIインフラ分野への強い確信を示しています。
より大きなシグナル:個人資本は、構造的な成長、大規模なデータセンター需要、そして支配的なチップ経済性を備えたAIリーダーへと、ますます向かっています。
$NVDA は今、個人投資家のお気に入りのAI資産なのでしょうか?
$XNVDA #NvidiaAICapitalChain $AAPL #SP500EarningsGap #NvidiaAICapitalChain
個人投資家は過去1年間で$NVDA に$27B+を投じており、AIインフラ分野への強い確信を示しています。
より大きなシグナル:個人資本は、構造的な成長、大規模なデータセンター需要、そして支配的なチップ経済性を備えたAIリーダーへと、ますます向かっています。
$NVDA は今、個人投資家のお気に入りのAI資産なのでしょうか?
$XNVDA #NvidiaAICapitalChain $AAPL #SP500EarningsGap #NvidiaAICapitalChain
2
11
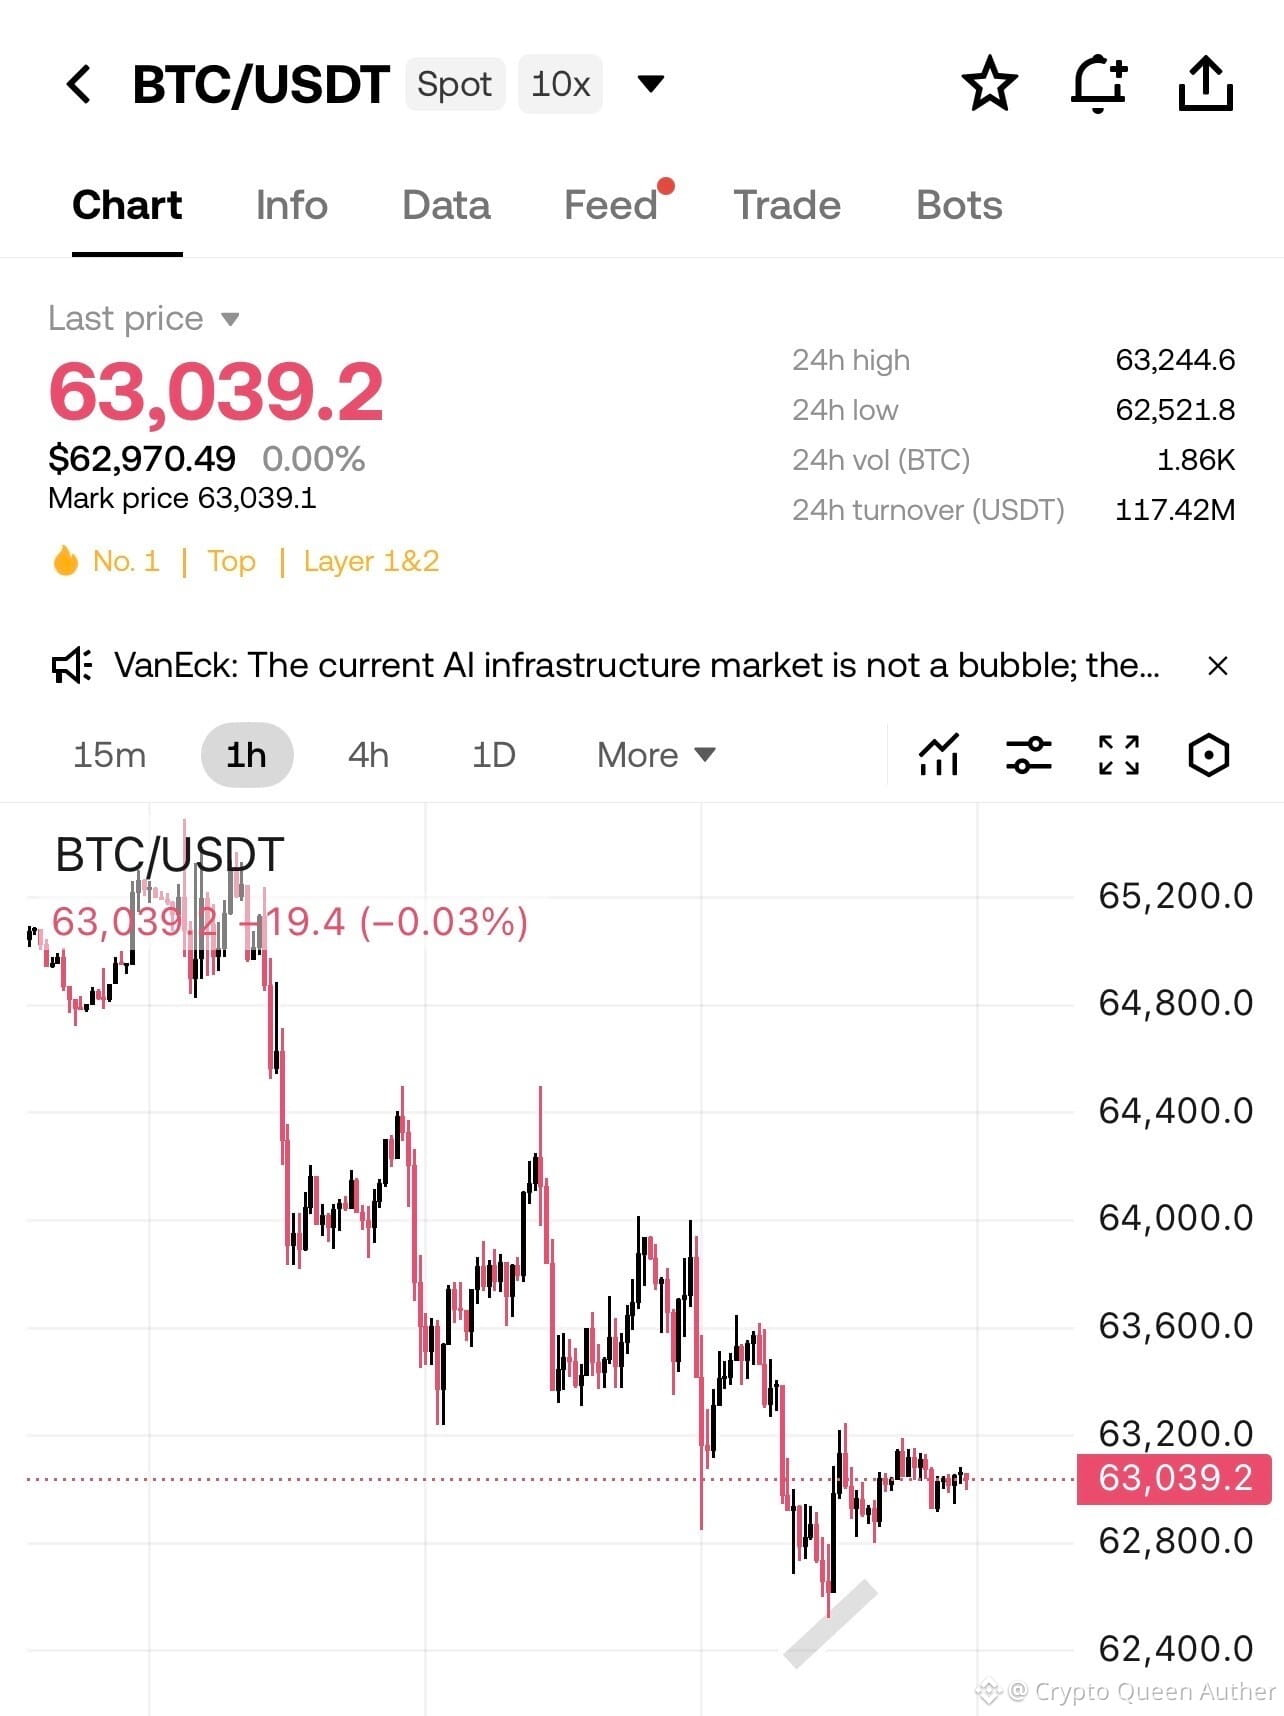
$BTC / USDT — 市場はいまだ動く理由を待っている
BTCは約$63,039前後で推移しており、本日の値動きはおおよそ$62.52K〜$63.24Kの範囲に収まっています。
チャートが圧縮されています。これはたいてい、ひとつの意味を持ちます――市場は“動くための理由”を待っているのです。
いま私が注目しているのは3つの水準です。
$63.2K〜$63.4K — 短期のレジスタンス
$62.8K — 近いサポート
$62.5K — 重要な下方ライン
もしBTCが$63.4Kを取り戻し、それを維持できるなら、次のテストは約$64Kあたりになりそうです。
しかし、$62.5Kが出来高を伴って下抜けするなら、もう一段下への動きの可能性を無視はしません。
現時点では、明確なトレンドはありません。
最良の取引は、単にBTCがこのレンジを離れて、実際に主導権を握っているのがどちらかを示すのを待つことかもしれません。
予想ではありません。水準と確認だけです。
#BTC
#WeakConsumptionFedSplit #NvidiaAICapitalChain #SKHynixCapexSurge
$BTC / USDT — 市場はいまだ動く理由を待っている
BTCは約$63,039前後で推移しており、本日の値動きはおおよそ$62.52K〜$63.24Kの範囲に収まっています。
チャートが圧縮されています。これはたいてい、ひとつの意味を持ちます――市場は“動くための理由”を待っているのです。
いま私が注目しているのは3つの水準です。
$63.2K〜$63.4K — 短期のレジスタンス
$62.8K — 近いサポート
$62.5K — 重要な下方ライン
もしBTCが$63.4Kを取り戻し、それを維持できるなら、次のテストは約$64Kあたりになりそうです。
しかし、$62.5Kが出来高を伴って下抜けするなら、もう一段下への動きの可能性を無視はしません。
現時点では、明確なトレンドはありません。
最良の取引は、単にBTCがこのレンジを離れて、実際に主導権を握っているのがどちらかを示すのを待つことかもしれません。
予想ではありません。水準と確認だけです。
#BTC
#WeakConsumptionFedSplit #NvidiaAICapitalChain #SKHynixCapexSurge
BTCは約$63,039前後で推移しており、本日の値動きはおおよそ$62.52K〜$63.24Kの範囲に収まっています。
チャートが圧縮されています。これはたいてい、ひとつの意味を持ちます――市場は“動くための理由”を待っているのです。
いま私が注目しているのは3つの水準です。
$63.2K〜$63.4K — 短期のレジスタンス
$62.8K — 近いサポート
$62.5K — 重要な下方ライン
もしBTCが$63.4Kを取り戻し、それを維持できるなら、次のテストは約$64Kあたりになりそうです。
しかし、$62.5Kが出来高を伴って下抜けするなら、もう一段下への動きの可能性を無視はしません。
現時点では、明確なトレンドはありません。
最良の取引は、単にBTCがこのレンジを離れて、実際に主導権を握っているのがどちらかを示すのを待つことかもしれません。
予想ではありません。水準と確認だけです。
#BTC
#WeakConsumptionFedSplit #NvidiaAICapitalChain #SKHynixCapexSurge
17
翻訳参照
🔍 $SNDK — 99% Down Doesn’t Automatically Mean Bottom
A 99%+ drawdown can make an asset look extremely cheap, but price decline alone is not proof of a bottom.
For $SNDK , the real question is whether sellers are finally exhausted and genuine demand is returning.
Key factors still matter:
🔓 Token unlocks: New supply can continue creating selling pressure.
⚠️ Liquidations: Leveraged positions can amplify downside volatility.
📉 Weak demand: Without sustained buyers, rallies can quickly fade.
💰 Liquidity rotation: $BICO , $BEAT, $ALLO, $KAITO and $APR have shown stronger reactions as speculative liquidity returned.
🚨 What would make $SNDK interesting?
I would look for three confirmations together:
1. Selling pressure decreases
Large sell-offs become less aggressive and downside wicks begin getting absorbed.
2. Accumulation increases
Higher trading activity starts occurring around stable price levels rather than during panic selling.
3. Volume expands with price
A breakout accompanied by meaningful volume is much more convincing than a sudden low-volume spike.
The important distinction is:
99% down ≠ bottom.
A genuine bottom usually needs evidence that supply is being absorbed and demand is becoming persistent.
Until that happens, a major $SNDK recovery remains a high-risk speculative trade, not a confirmed reversal.
#SP500Nears8000 #WeakConsumptionFedSplit #NvidiaAICapitalChain
🔍 $SNDK — 99% Down Doesn’t Automatically Mean Bottom
A 99%+ drawdown can make an asset look extremely cheap, but price decline alone is not proof of a bottom.
For $SNDK , the real question is whether sellers are finally exhausted and genuine demand is returning.
Key factors still matter:
🔓 Token unlocks: New supply can continue creating selling pressure.
⚠️ Liquidations: Leveraged positions can amplify downside volatility.
📉 Weak demand: Without sustained buyers, rallies can quickly fade.
💰 Liquidity rotation: $BICO , $BEAT, $ALLO, $KAITO and $APR have shown stronger reactions as speculative liquidity returned.
🚨 What would make $SNDK interesting?
I would look for three confirmations together:
1. Selling pressure decreases
Large sell-offs become less aggressive and downside wicks begin getting absorbed.
2. Accumulation increases
Higher trading activity starts occurring around stable price levels rather than during panic selling.
3. Volume expands with price
A breakout accompanied by meaningful volume is much more convincing than a sudden low-volume spike.
The important distinction is:
99% down ≠ bottom.
A genuine bottom usually needs evidence that supply is being absorbed and demand is becoming persistent.
Until that happens, a major $SNDK recovery remains a high-risk speculative trade, not a confirmed reversal.
#SP500Nears8000 #WeakConsumptionFedSplit #NvidiaAICapitalChain
A 99%+ drawdown can make an asset look extremely cheap, but price decline alone is not proof of a bottom.
For $SNDK , the real question is whether sellers are finally exhausted and genuine demand is returning.
Key factors still matter:
🔓 Token unlocks: New supply can continue creating selling pressure.
⚠️ Liquidations: Leveraged positions can amplify downside volatility.
📉 Weak demand: Without sustained buyers, rallies can quickly fade.
💰 Liquidity rotation: $BICO , $BEAT, $ALLO, $KAITO and $APR have shown stronger reactions as speculative liquidity returned.
🚨 What would make $SNDK interesting?
I would look for three confirmations together:
1. Selling pressure decreases
Large sell-offs become less aggressive and downside wicks begin getting absorbed.
2. Accumulation increases
Higher trading activity starts occurring around stable price levels rather than during panic selling.
3. Volume expands with price
A breakout accompanied by meaningful volume is much more convincing than a sudden low-volume spike.
The important distinction is:
99% down ≠ bottom.
A genuine bottom usually needs evidence that supply is being absorbed and demand is becoming persistent.
Until that happens, a major $SNDK recovery remains a high-risk speculative trade, not a confirmed reversal.
#SP500Nears8000 #WeakConsumptionFedSplit #NvidiaAICapitalChain
161
ログインして、さらにコンテンツを読む
厳選トピックで世界の暗号資産トレーダーの仲間入り
⚡️ 暗号資産に関する最新かつ有益な情報が見つかります。
💬 世界最大の暗号資産取引所から信頼されています。
👍 認証を受けたクリエイターから、有益なインサイトを得られます。
メール / 電話番号
トレンドトピック
1
#SECProposesCryptoCustodyRules
閲覧回数 4,579
100人が討論中
2
#SECApproves3xLongCryptoCommodityETPs
閲覧回数 6,825
139人が討論中
3
#G7PlansToReleaseUpTo100MBarrelsOilDiesel
閲覧回数 8,150
181人が討論中
4
#ICBASuesOCCOverCryptoBankCharters
閲覧回数 6,734
119人が討論中
5
#USStocksCloseHigherOnWeakJobsData
閲覧回数 6,303
100人が討論中
6
#AnchorageReportedlyCuts17%Workforce
閲覧回数 237
34人が討論中
7
#NFPWatch
閲覧回数 11M
19,588人が討論中
8
#NEARIntentsRecovers$3.8MAfterAttack
閲覧回数 0
0人が討論中
9
#BlastToGraduallyShutDownItsL2Network
閲覧回数 531
37人が討論中
10
#BitcoinFundingRateTriplesTo10%
閲覧回数 222,024
1,381人が討論中