
#int
int
閲覧回数 26,069
67人が討論中
注目
最新

🚨$INTC 🚨 雄獣が目覚めた!
➡️ 市場アラート:$INTC (Intel)で大規模な反発!
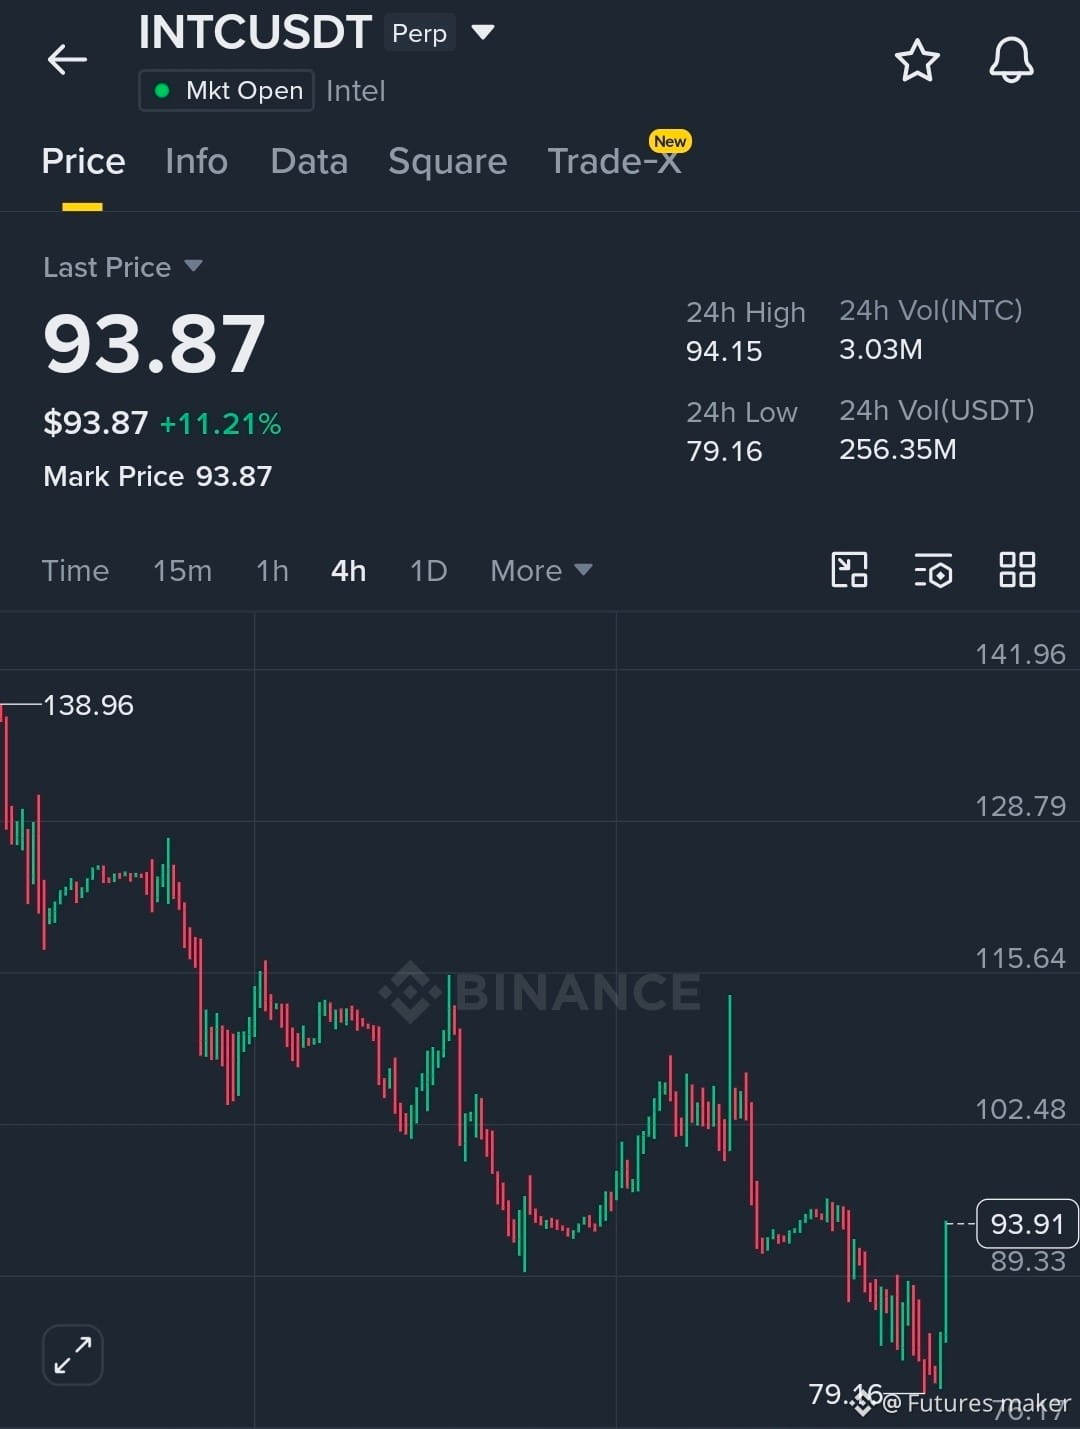
-ライブの4時間足チャートを見ると、$INTC は爆発的な上昇の反転を見せており、+11.21%上昇して$93.87で取引されています。24時間安値の$79.16まで急落した後、強い攻勢的な買いが入って$94.15の高値へ押し上げられています。これには、驚異的な取引量(256.35M USDT)が後押ししています。
➡️➡️ トレーダーへの影響:
激しい反発:安値からの急な緑の足が、強烈な買い手の参入と、主要な短期回復を引き起こす合図を示しています。
➡️➡️ リスク管理:高いボラティリティは、価格の急変を意味します。利益を確保し、資金を守り、注文板を注意深く監視してください!
#INT #Intel #CryptoTrading #BinanceSquare
🚨$INTC 🚨 雄獣が目覚めた!
➡️ 市場アラート:$INTC (Intel)で大規模な反発!
-ライブの4時間足チャートを見ると、$INTC は爆発的な上昇の反転を見せており、+11.21%上昇して$93.87で取引されています。24時間安値の$79.16まで急落した後、強い攻勢的な買いが入って$94.15の高値へ押し上げられています。これには、驚異的な取引量(256.35M USDT)が後押ししています。
➡️➡️ トレーダーへの影響:
激しい反発:安値からの急な緑の足が、強烈な買い手の参入と、主要な短期回復を引き起こす合図を示しています。
➡️➡️ リスク管理:高いボラティリティは、価格の急変を意味します。利益を確保し、資金を守り、注文板を注意深く監視してください!
#INT #Intel #CryptoTrading #BinanceSquare
➡️ 市場アラート:$INTC (Intel)で大規模な反発!
-ライブの4時間足チャートを見ると、$INTC は爆発的な上昇の反転を見せており、+11.21%上昇して$93.87で取引されています。24時間安値の$79.16まで急落した後、強い攻勢的な買いが入って$94.15の高値へ押し上げられています。これには、驚異的な取引量(256.35M USDT)が後押ししています。
➡️➡️ トレーダーへの影響:
激しい反発:安値からの急な緑の足が、強烈な買い手の参入と、主要な短期回復を引き起こす合図を示しています。
➡️➡️ リスク管理:高いボラティリティは、価格の急変を意味します。利益を確保し、資金を守り、注文板を注意深く監視してください!
#INT #Intel #CryptoTrading #BinanceSquare

10

·
--
ブリッシュ
🚀 $INIT 強い回復モメンタムを示す
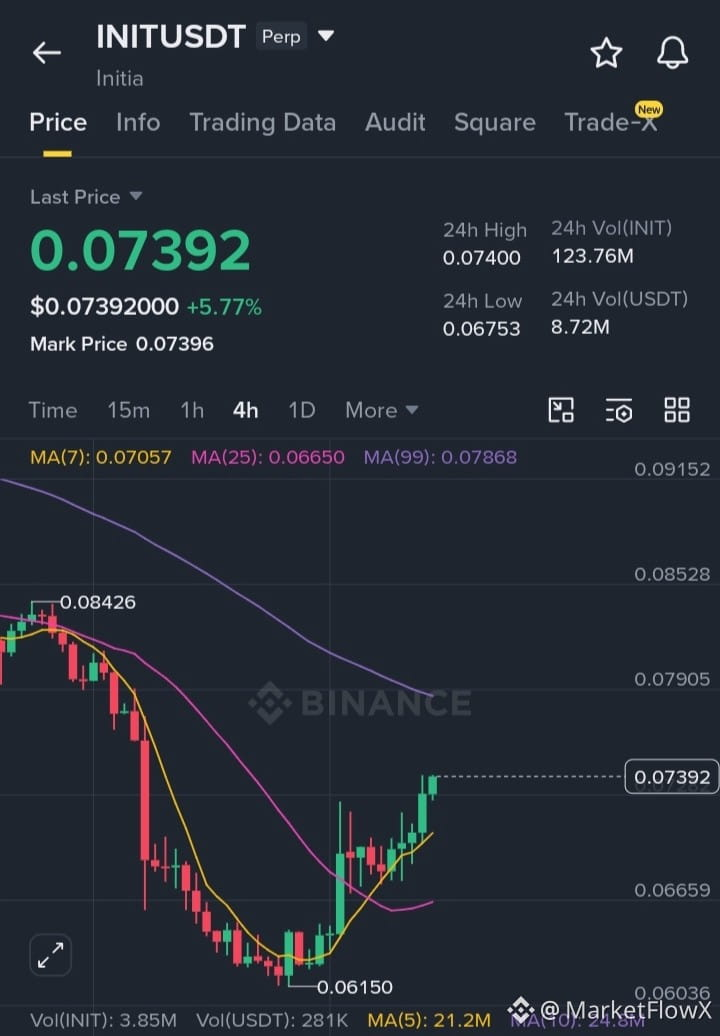
長期間の売り圧力の後、$INIT は力を取り戻し始め、より健康的なマーケット構造で取引されています。バイヤーたちは自信を持ってキーレジスタンスゾーンを突破し、強気のモメンタムを再構築しています。
📈 トレードセットアップ
エントリー $0.0735 – $0.0745
ストップロス $0.0690
🎯 ターゲット:
TP1: $0.0780
TP2: $0.0820
TP3: $0.0880
このセットアップが際立つ理由:
1. 最近の安値からの強いリバウンド
2. 複数のレジスタンスレベルを回復
3. 動きに対するボリュームの上昇
4. バイヤーが積極的にプルバックを守っている
最近の価格アクションは、市場に自信が戻っていることを示唆しています。もしモメンタムが強いままであれば、#Int は回復を続け、強さを求めるトレーダーたちから追加の注目を集めるかもしれません。
$INIT を買って取引しよう
{future}(INITUSDT)
🚀 $INIT 強い回復モメンタムを示す
長期間の売り圧力の後、$INIT は力を取り戻し始め、より健康的なマーケット構造で取引されています。バイヤーたちは自信を持ってキーレジスタンスゾーンを突破し、強気のモメンタムを再構築しています。
📈 トレードセットアップ
エントリー $0.0735 – $0.0745
ストップロス $0.0690
🎯 ターゲット:
TP1: $0.0780
TP2: $0.0820
TP3: $0.0880
このセットアップが際立つ理由:
1. 最近の安値からの強いリバウンド
2. 複数のレジスタンスレベルを回復
3. 動きに対するボリュームの上昇
4. バイヤーが積極的にプルバックを守っている
最近の価格アクションは、市場に自信が戻っていることを示唆しています。もしモメンタムが強いままであれば、#Int は回復を続け、強さを求めるトレーダーたちから追加の注目を集めるかもしれません。
$INIT を買って取引しよう
長期間の売り圧力の後、$INIT は力を取り戻し始め、より健康的なマーケット構造で取引されています。バイヤーたちは自信を持ってキーレジスタンスゾーンを突破し、強気のモメンタムを再構築しています。
📈 トレードセットアップ
エントリー $0.0735 – $0.0745
ストップロス $0.0690
🎯 ターゲット:
TP1: $0.0780
TP2: $0.0820
TP3: $0.0880
このセットアップが際立つ理由:
1. 最近の安値からの強いリバウンド
2. 複数のレジスタンスレベルを回復
3. 動きに対するボリュームの上昇
4. バイヤーが積極的にプルバックを守っている
最近の価格アクションは、市場に自信が戻っていることを示唆しています。もしモメンタムが強いままであれば、#Int は回復を続け、強さを求めるトレーダーたちから追加の注目を集めるかもしれません。
$INIT を買って取引しよう
1
193

#INT
*INIT/USDT 1D:$0.0699 ベース・テスト → $0.3209 爆発ゾーン($0.0708が維持されれば)*
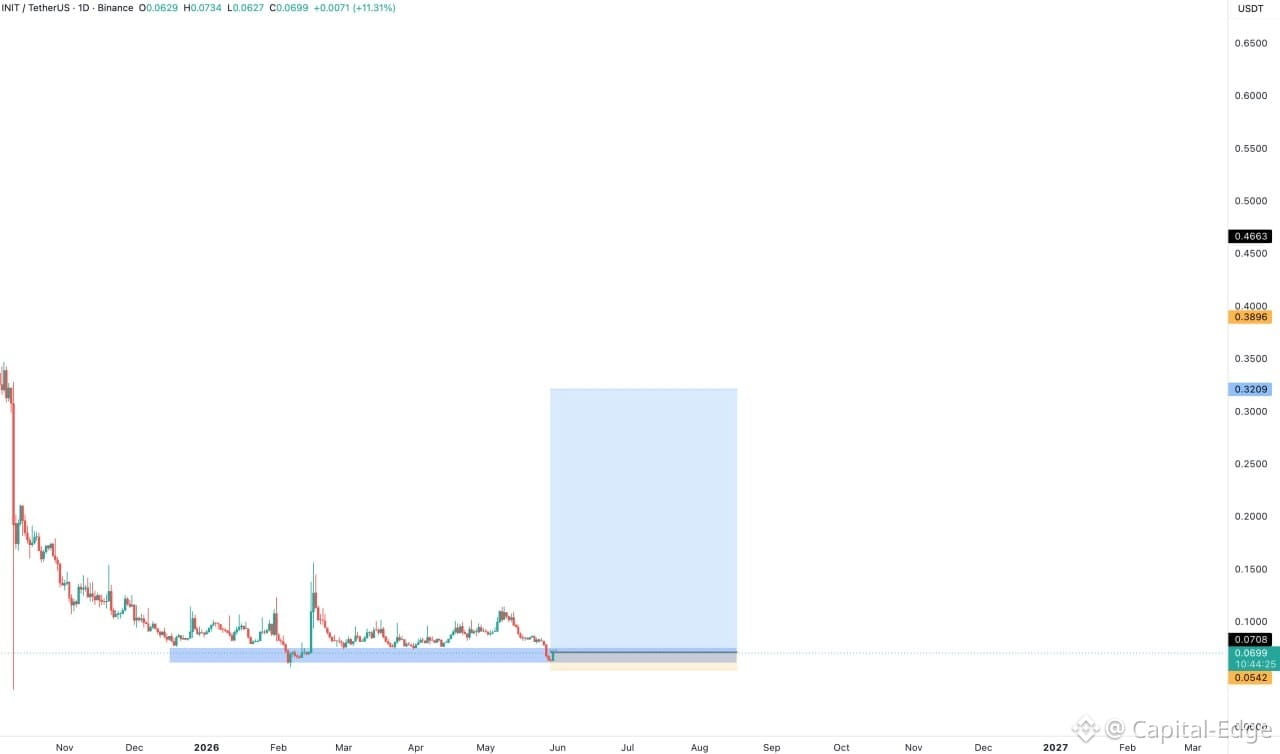
BinanceでのINIT 1Dローソク足は$0.0699で開始し、本日+11.31%。2025年11月から続く下落トレンドの末、いま価格は$0.0708のグレー線をテストしている。これは2025年12月から保持されてきた同じベースだ。チャートでは、サポートが維持されれば$0.3209まで到達する巨大な青いボックスが投影されている。
*重要情報+チャートからの新分析:*
*1. $0.0542〜$0.0708=2025年12月以降の蓄積ベース*
2025年12月〜2026年5月の青い水平ボックス=6か月のレンジ。価格は$0.0542のオレンジ水準へ複数回“刺さった”が、終値で割り込むことはなかった。これが「蓄積」だ。小口(個人)投資家が焦れて投げる一方で、賢い資金が買っている。ローソク足に残り「10:44:25」=日足の終値がベースの維持かブレイクかを決める。
*2. $0.3209 青いボックス=計測(メジャードムーブ)ターゲット*
$0.0708の上にある大きな青い長方形=チャート投影ゾーン。6か月ベース($0.0708→$0.0542)の高さと同じ分だけ上方向へ伸び、$0.3209が射程。INITが$0.0708をブレイクして終値で上回るなら、テクニカル目標は現在値から4.5倍。さらに上の黄色$0.3896は、勢いが続く場合の次のレジスタンス。
*3. $0.4663 黒いレベル=完全回復ゾーン*
黒のラベル上端が$0.4663で、2025年11月の下落局面での過去高値。チャート構造:ベース$0.07 → ブレイクアウト$0.32 → トレンド$0.39〜$0.46。ただし最初のハードルは$0.0708。日足の終値でそれを上回るまでは、INITは「本気で証明しろ(prove it)」モードのまま。日足の終値が$0.0542(オレンジ)を下回ればベースは失敗、新安値の可能性が高い。
*プロ洞察:「ロング・ベース=大きなムーブ」ルール*
6か月のレンジ+出来高の乾き+サポートでのリバウンド=典型的なブレイクアウト準備形。価格は$0.35→$0.0542まで下落(-85%)。そしていまベースを形成中。$0.0708がサポートに反転すれば、$0.35で捕まっていた売り勢が$0.07〜$0.10で買い手に回り、青いボックス$0.32までの素早い上昇を後押しする。ただし低時価総額=ボラティリティが高い。上下ともに10%級のローソク足が出る。
*クイック・レベル:*
- *サポート/ベース*: $0.0708 グレー。終値が上回れば強気転換
- *無効化*: $0.0542 オレンジ。終値が下回れば弱気。ロングは回避
- *ブレイクアウト目標*: $0.3209 青いボックス。ベースから計測移動で4.5倍
- *次のレジスタンス*: $0.3896 黄色、その次に$0.4663 黒(直近の過去高)
#INT
*INIT/USDT 1D:$0.0699 ベース・テスト → $0.3209 爆発ゾーン($0.0708が維持されれば)*
BinanceでのINIT 1Dローソク足は$0.0699で開始し、本日+11.31%。2025年11月から続く下落トレンドの末、いま価格は$0.0708のグレー線をテストしている。これは2025年12月から保持されてきた同じベースだ。チャートでは、サポートが維持されれば$0.3209まで到達する巨大な青いボックスが投影されている。
*重要情報+チャートからの新分析:*
*1. $0.0542〜$0.0708=2025年12月以降の蓄積ベース*
2025年12月〜2026年5月の青い水平ボックス=6か月のレンジ。価格は$0.0542のオレンジ水準へ複数回“刺さった”が、終値で割り込むことはなかった。これが「蓄積」だ。小口(個人)投資家が焦れて投げる一方で、賢い資金が買っている。ローソク足に残り「10:44:25」=日足の終値がベースの維持かブレイクかを決める。
*2. $0.3209 青いボックス=計測(メジャードムーブ)ターゲット*
$0.0708の上にある大きな青い長方形=チャート投影ゾーン。6か月ベース($0.0708→$0.0542)の高さと同じ分だけ上方向へ伸び、$0.3209が射程。INITが$0.0708をブレイクして終値で上回るなら、テクニカル目標は現在値から4.5倍。さらに上の黄色$0.3896は、勢いが続く場合の次のレジスタンス。
*3. $0.4663 黒いレベル=完全回復ゾーン*
黒のラベル上端が$0.4663で、2025年11月の下落局面での過去高値。チャート構造:ベース$0.07 → ブレイクアウト$0.32 → トレンド$0.39〜$0.46。ただし最初のハードルは$0.0708。日足の終値でそれを上回るまでは、INITは「本気で証明しろ(prove it)」モードのまま。日足の終値が$0.0542(オレンジ)を下回ればベースは失敗、新安値の可能性が高い。
*プロ洞察:「ロング・ベース=大きなムーブ」ルール*
6か月のレンジ+出来高の乾き+サポートでのリバウンド=典型的なブレイクアウト準備形。価格は$0.35→$0.0542まで下落(-85%)。そしていまベースを形成中。$0.0708がサポートに反転すれば、$0.35で捕まっていた売り勢が$0.07〜$0.10で買い手に回り、青いボックス$0.32までの素早い上昇を後押しする。ただし低時価総額=ボラティリティが高い。上下ともに10%級のローソク足が出る。
*クイック・レベル:*
- *サポート/ベース*: $0.0708 グレー。終値が上回れば強気転換
- *無効化*: $0.0542 オレンジ。終値が下回れば弱気。ロングは回避
- *ブレイクアウト目標*: $0.3209 青いボックス。ベースから計測移動で4.5倍
- *次のレジスタンス*: $0.3896 黄色、その次に$0.4663 黒(直近の過去高)
*INIT/USDT 1D:$0.0699 ベース・テスト → $0.3209 爆発ゾーン($0.0708が維持されれば)*
BinanceでのINIT 1Dローソク足は$0.0699で開始し、本日+11.31%。2025年11月から続く下落トレンドの末、いま価格は$0.0708のグレー線をテストしている。これは2025年12月から保持されてきた同じベースだ。チャートでは、サポートが維持されれば$0.3209まで到達する巨大な青いボックスが投影されている。
*重要情報+チャートからの新分析:*
*1. $0.0542〜$0.0708=2025年12月以降の蓄積ベース*
2025年12月〜2026年5月の青い水平ボックス=6か月のレンジ。価格は$0.0542のオレンジ水準へ複数回“刺さった”が、終値で割り込むことはなかった。これが「蓄積」だ。小口(個人)投資家が焦れて投げる一方で、賢い資金が買っている。ローソク足に残り「10:44:25」=日足の終値がベースの維持かブレイクかを決める。
*2. $0.3209 青いボックス=計測(メジャードムーブ)ターゲット*
$0.0708の上にある大きな青い長方形=チャート投影ゾーン。6か月ベース($0.0708→$0.0542)の高さと同じ分だけ上方向へ伸び、$0.3209が射程。INITが$0.0708をブレイクして終値で上回るなら、テクニカル目標は現在値から4.5倍。さらに上の黄色$0.3896は、勢いが続く場合の次のレジスタンス。
*3. $0.4663 黒いレベル=完全回復ゾーン*
黒のラベル上端が$0.4663で、2025年11月の下落局面での過去高値。チャート構造:ベース$0.07 → ブレイクアウト$0.32 → トレンド$0.39〜$0.46。ただし最初のハードルは$0.0708。日足の終値でそれを上回るまでは、INITは「本気で証明しろ(prove it)」モードのまま。日足の終値が$0.0542(オレンジ)を下回ればベースは失敗、新安値の可能性が高い。
*プロ洞察:「ロング・ベース=大きなムーブ」ルール*
6か月のレンジ+出来高の乾き+サポートでのリバウンド=典型的なブレイクアウト準備形。価格は$0.35→$0.0542まで下落(-85%)。そしていまベースを形成中。$0.0708がサポートに反転すれば、$0.35で捕まっていた売り勢が$0.07〜$0.10で買い手に回り、青いボックス$0.32までの素早い上昇を後押しする。ただし低時価総額=ボラティリティが高い。上下ともに10%級のローソク足が出る。
*クイック・レベル:*
- *サポート/ベース*: $0.0708 グレー。終値が上回れば強気転換
- *無効化*: $0.0542 オレンジ。終値が下回れば弱気。ロングは回避
- *ブレイクアウト目標*: $0.3209 青いボックス。ベースから計測移動で4.5倍
- *次のレジスタンス*: $0.3896 黄色、その次に$0.4663 黒(直近の過去高)
85
·
--
ブリッシュ
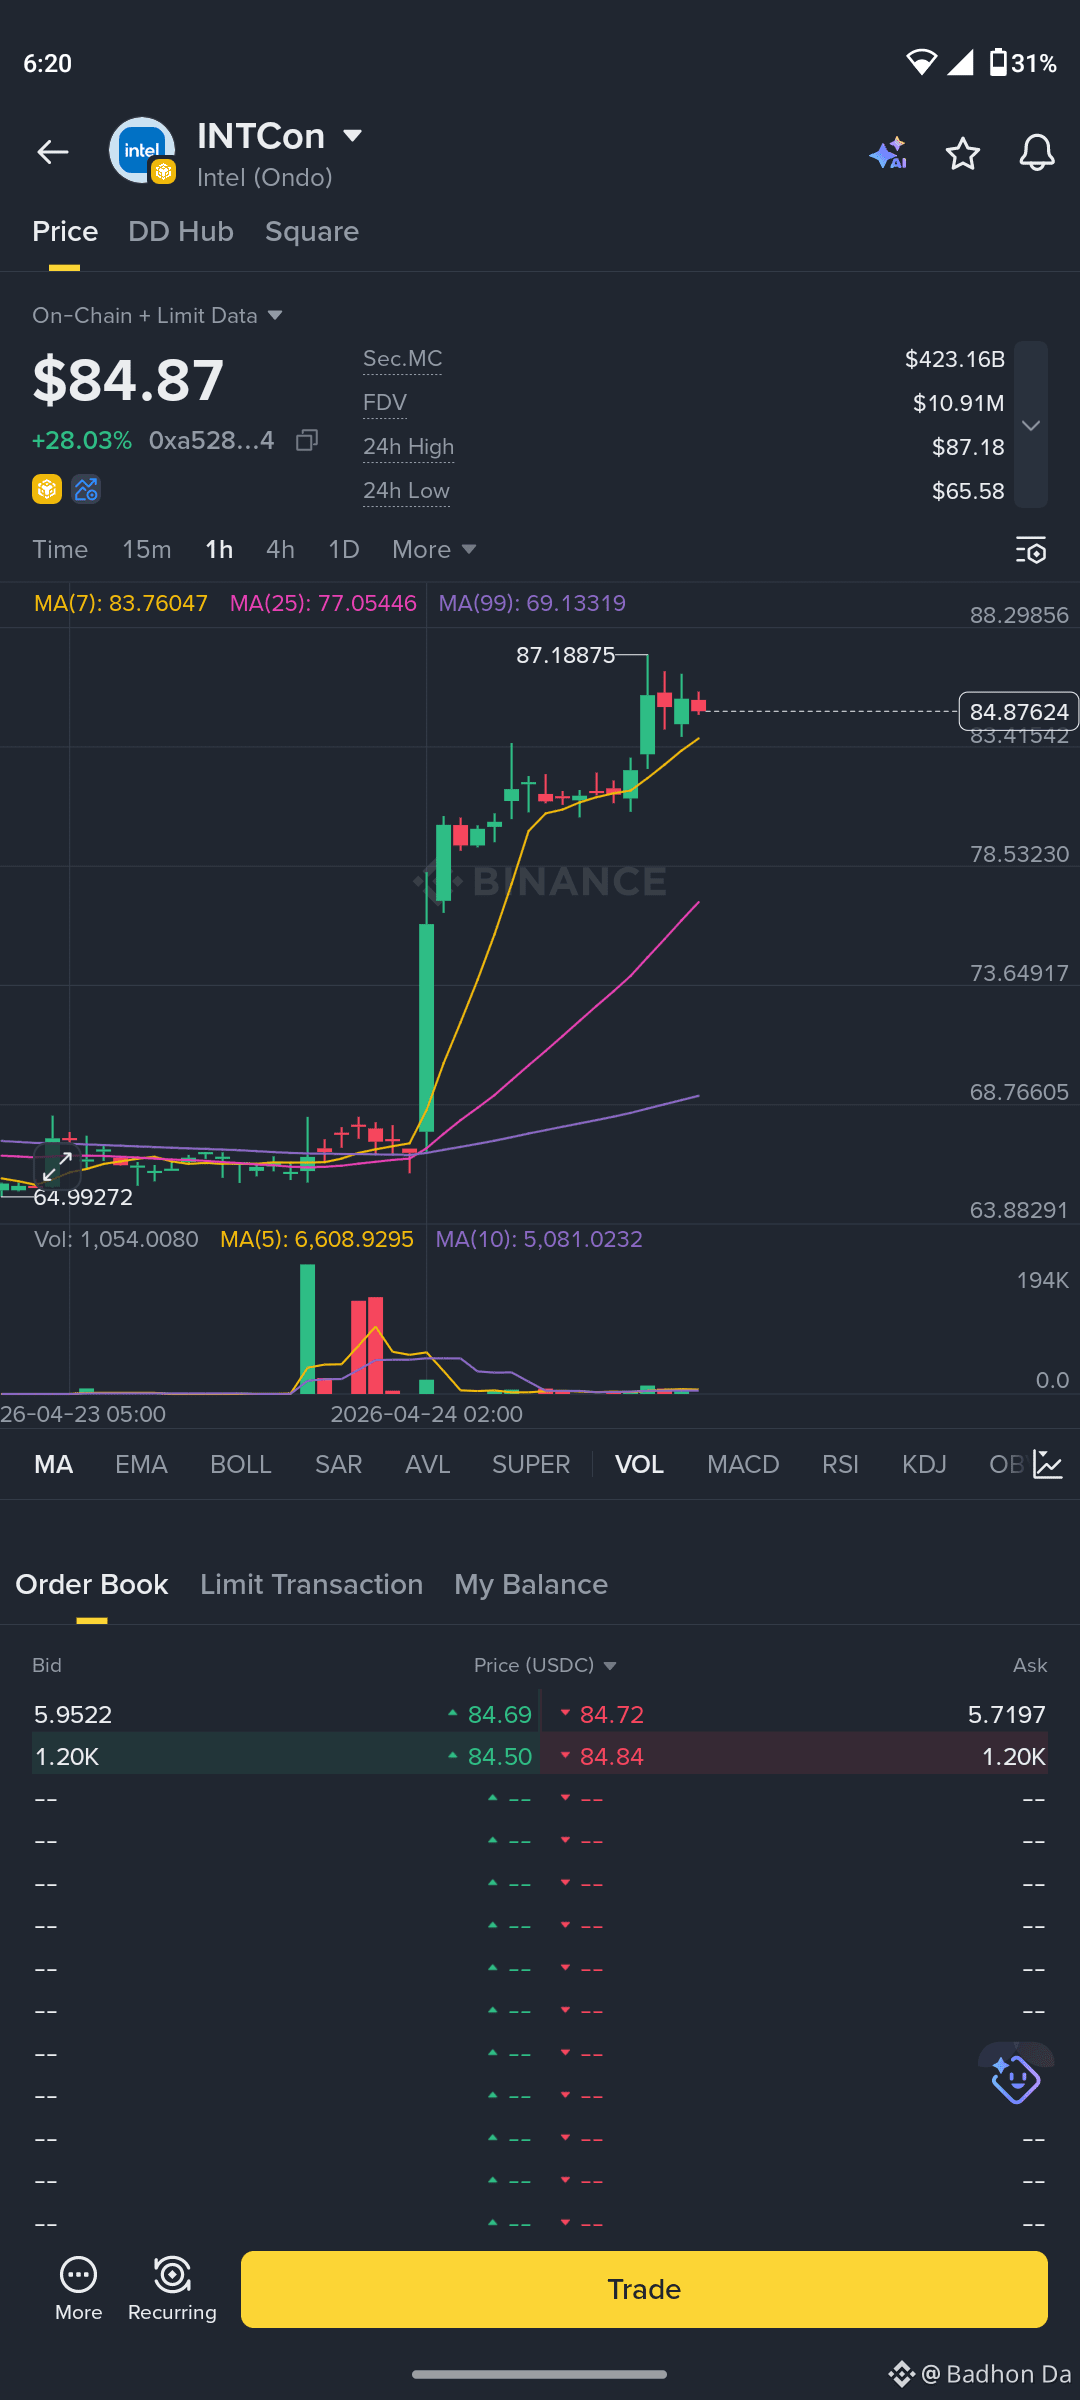
$INTCon (intel) の市場シェアが今日27%以上上昇しました🪙 このトークンは投資家向けの公式インテル社トークンです 🪙 今買うべきです、なぜならチップ価格がAI(人工知能)セクターでトレンドになっているからです。そう、私は$INTCon alphaを買って、ほぼ2年間ホールドしています🪙
{alpha}(560xa528caaa2f96090e379d43f90834c75df54d6e74)
#Int #Intel #RAM #AI #IndustryEvents
$INTCon (intel) の市場シェアが今日27%以上上昇しました🪙 このトークンは投資家向けの公式インテル社トークンです 🪙 今買うべきです、なぜならチップ価格がAI(人工知能)セクターでトレンドになっているからです。そう、私は$INTCon alphaを買って、ほぼ2年間ホールドしています🪙
#Int #Intel #RAM #AI #IndustryEvents
#Int #Intel #RAM #AI #IndustryEvents
1
52

ログインして、さらにコンテンツを読む
厳選トピックで世界の暗号資産トレーダーの仲間入り
⚡️ 暗号資産に関する最新かつ有益な情報が見つかります。
💬 世界最大の暗号資産取引所から信頼されています。
👍 認証を受けたクリエイターから、有益なインサイトを得られます。
メール / 電話番号
トレンドトピック
1
#ClarityActFacesProceduralVoteSept15
閲覧回数 28,535
482人が討論中
2
#US2YearYieldRisesTo4.61%
閲覧回数 25,352
528人が討論中
3
#US10YearTreasuryYieldNears5%
閲覧回数 13,227
301人が討論中
4
#CryptoLiquidations$674MIn24H
閲覧回数 6,395
74人が討論中
5
#TokenizedStockHoldersUp619.1%
閲覧回数 17,020
326人が討論中
6
#RevolutConfirmsFakeGovEmailDataBreach
閲覧回数 37,074
617人が討論中
7
#CanadaOSFISaysTokenizedDepositsEqualTraditionalDeposits
閲覧回数 1,588
54人が討論中
8
#USBankCompletesCrossBorderPaymentPilotOnStellar
閲覧回数 37,939
804人が討論中
9
#NvidiaInTalksToInvestUpTo$10BInAnthropicIPO
閲覧回数 2,917
64人が討論中
10
#EtherRalliesAsBearishBetsLiquidate
閲覧回数 53,032
1,003人が討論中