
#impactbytrade
impactbytrade
閲覧回数 365
3人が討論中
注目
最新

·
--
翻訳参照
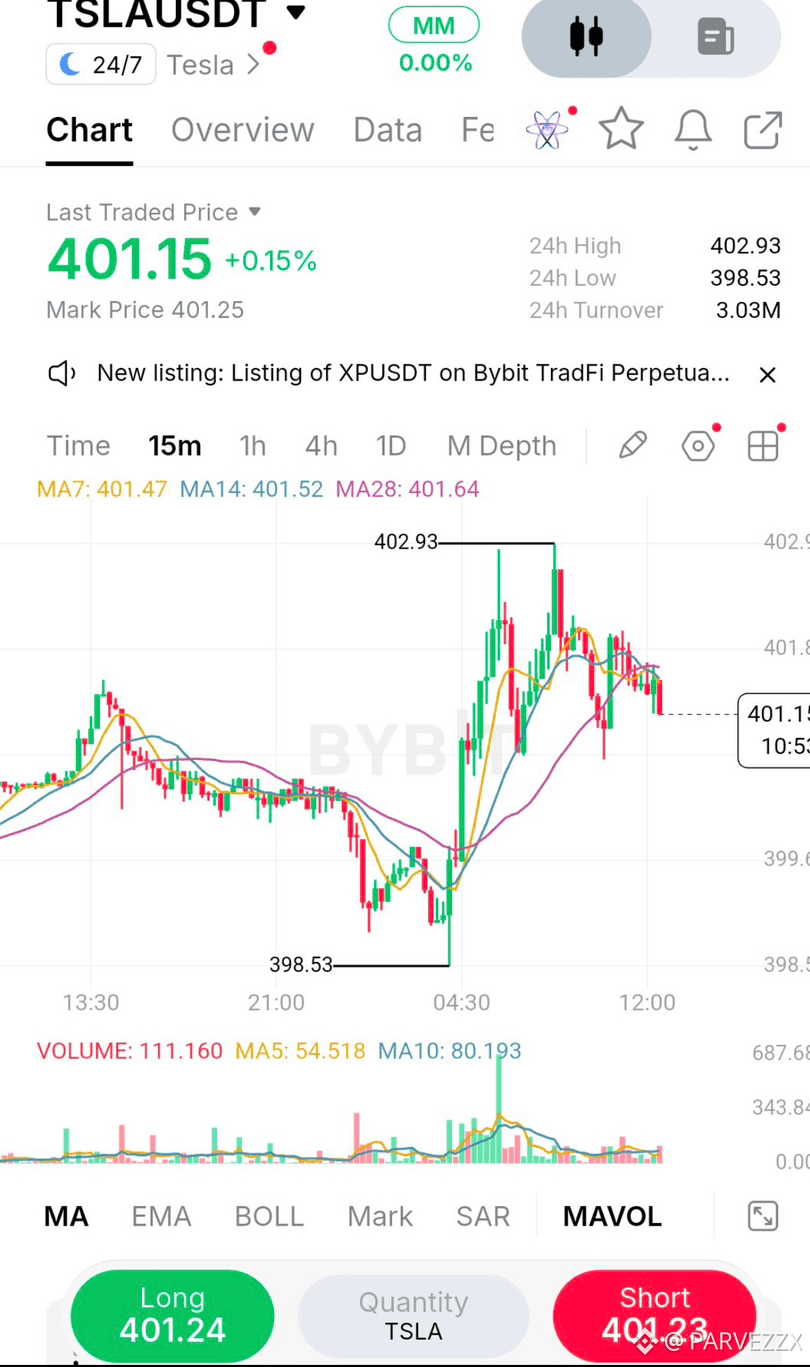
I watched that sharp spike off 398.53 and chose not to chase it. Right now, on the 15m TSLAUSDT chart, price is compressing between 400.50 and the 402.93 high. What stands out is the faded volume following the initial impulse usually a sign buyers are exhausted and a pullback is brewing.
When volume dries up at the highs, it rarely means the move is over; it usually means the market is taking a breath. But if that breath turns into a heavy sell-off without buyers stepping in, the structure shifts quickly. I've been burned before by assuming every tight consolidation is just a pause before continuation. That's why I'm letting the chart come to me instead of forcing an entry mid-range.
I'm waiting for a lower-risk test of structure rather than buying the top. A pullback into 399.50-
400.50 would let me align with the 15m moving averages (currently pinching around 401.50) and the midpoint of that impulse leg. If price pushes straight to 406 without a retest, I simply miss the trade. I'm okay with that. There will be another setup.
Bias: LONG
Entry Zone: $399.50 - $400.50
Confirmation: A bullish 15m close (rejection wick) inside the zone.
Stop / Invalidation: $398.40 (Just below the recent swing low)
TP1: $402.50
TP2: $406.00
R:R: 1:2
The main risk? A complete rejection at 402.93 leaving a double top, or a slow bleed that slices right through 398.53. I won't blindly catch a falling knife; I need to see buyers step in first. My personal rule here: waiting for a retest typically provides a tighter stop and better R:R than entering mid-range. Are you buying this breakout or waiting for the dip?
$TSLAB $BTC
#IMPACTbyTrade #WSOT2026
{spot}(TSLABUSDT)
{future}(BTCUSDT)
I watched that sharp spike off 398.53 and chose not to chase it. Right now, on the 15m TSLAUSDT chart, price is compressing between 400.50 and the 402.93 high. What stands out is the faded volume following the initial impulse usually a sign buyers are exhausted and a pullback is brewing.
When volume dries up at the highs, it rarely means the move is over; it usually means the market is taking a breath. But if that breath turns into a heavy sell-off without buyers stepping in, the structure shifts quickly. I've been burned before by assuming every tight consolidation is just a pause before continuation. That's why I'm letting the chart come to me instead of forcing an entry mid-range.
I'm waiting for a lower-risk test of structure rather than buying the top. A pullback into 399.50-
400.50 would let me align with the 15m moving averages (currently pinching around 401.50) and the midpoint of that impulse leg. If price pushes straight to 406 without a retest, I simply miss the trade. I'm okay with that. There will be another setup.
Bias: LONG
Entry Zone: $399.50 - $400.50
Confirmation: A bullish 15m close (rejection wick) inside the zone.
Stop / Invalidation: $398.40 (Just below the recent swing low)
TP1: $402.50
TP2: $406.00
R:R: 1:2
The main risk? A complete rejection at 402.93 leaving a double top, or a slow bleed that slices right through 398.53. I won't blindly catch a falling knife; I need to see buyers step in first. My personal rule here: waiting for a retest typically provides a tighter stop and better R:R than entering mid-range. Are you buying this breakout or waiting for the dip?
$TSLAB $BTC
#IMPACTbyTrade #WSOT2026
When volume dries up at the highs, it rarely means the move is over; it usually means the market is taking a breath. But if that breath turns into a heavy sell-off without buyers stepping in, the structure shifts quickly. I've been burned before by assuming every tight consolidation is just a pause before continuation. That's why I'm letting the chart come to me instead of forcing an entry mid-range.
I'm waiting for a lower-risk test of structure rather than buying the top. A pullback into 399.50-
400.50 would let me align with the 15m moving averages (currently pinching around 401.50) and the midpoint of that impulse leg. If price pushes straight to 406 without a retest, I simply miss the trade. I'm okay with that. There will be another setup.
Bias: LONG
Entry Zone: $399.50 - $400.50
Confirmation: A bullish 15m close (rejection wick) inside the zone.
Stop / Invalidation: $398.40 (Just below the recent swing low)
TP1: $402.50
TP2: $406.00
R:R: 1:2
The main risk? A complete rejection at 402.93 leaving a double top, or a slow bleed that slices right through 398.53. I won't blindly catch a falling knife; I need to see buyers step in first. My personal rule here: waiting for a retest typically provides a tighter stop and better R:R than entering mid-range. Are you buying this breakout or waiting for the dip?
$TSLAB $BTC
#IMPACTbyTrade #WSOT2026
99

$ARB 🚀 CATECOIN(CATE)—大ブレイクの可能性!🔥
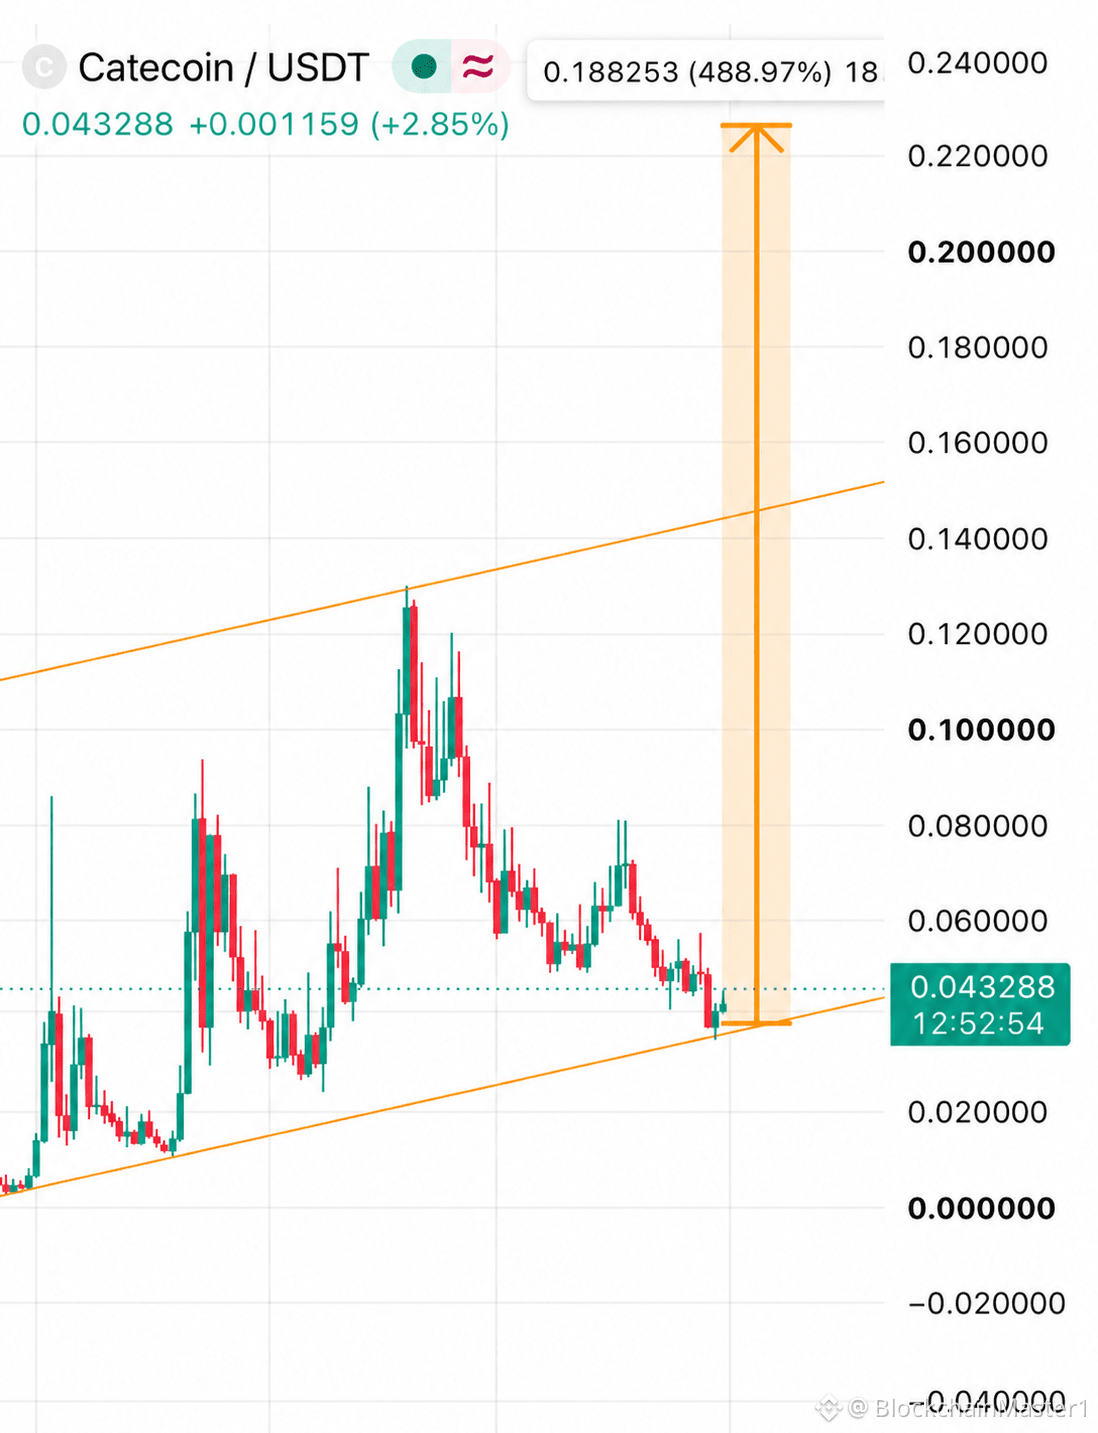
Catecoinは興味深いテクニカル構造を示しており、現在は約$0.043288で取引されています。買い手は重要なサポートエリアを守ろうとしています。チャートには長期的な上昇チャネルが見られ、下側のトレンドラインが維持されれば、より大きなトレンドも強気を保つ可能性があります。
📊 重要な価格帯と長期目標
💰 現在価格:$0.043288
🟢 サポートゾーン:$0.0350–$0.0400
📈 レジスタンス1:$0.0500–$0.0600
🚀 レジスタンス2:$0.0800–$0.1000
🎯 TP1:$0.0600
🔥 TP2:$0.0800
🚀 TP3:$0.1200
🌕 チャート上の主要目標:$0.2200–$0.2300
上昇チャネルは回復の可能性を示していますが、CATEが上昇するには、より強い買いの出来高と、近くのレジスタンスを上抜けたことの確認が必要です。ブレイクアウトに成功すれば、新たな注目を集め、さらに高い価格帯を目指すきっかけになる可能性があります。
⚠️ 価格がチャネル下限のサポートを割り込むと、強気の見通しが弱まる可能性があります。これらは投機的なチャート上の目標であり、確実な予測ではありません。
次の相場上昇局面で、$CATEは大きく復活できるでしょうか?🔥
#IMPACTbyTrade $CATI $LSK
{future}(CATIUSDT)
{future}(ARBUSDT)
$ARB 🚀 CATECOIN(CATE)—大ブレイクの可能性!🔥
Catecoinは興味深いテクニカル構造を示しており、現在は約$0.043288で取引されています。買い手は重要なサポートエリアを守ろうとしています。チャートには長期的な上昇チャネルが見られ、下側のトレンドラインが維持されれば、より大きなトレンドも強気を保つ可能性があります。
📊 重要な価格帯と長期目標
💰 現在価格:$0.043288
🟢 サポートゾーン:$0.0350–$0.0400
📈 レジスタンス1:$0.0500–$0.0600
🚀 レジスタンス2:$0.0800–$0.1000
🎯 TP1:$0.0600
🔥 TP2:$0.0800
🚀 TP3:$0.1200
🌕 チャート上の主要目標:$0.2200–$0.2300
上昇チャネルは回復の可能性を示していますが、CATEが上昇するには、より強い買いの出来高と、近くのレジスタンスを上抜けたことの確認が必要です。ブレイクアウトに成功すれば、新たな注目を集め、さらに高い価格帯を目指すきっかけになる可能性があります。
⚠️ 価格がチャネル下限のサポートを割り込むと、強気の見通しが弱まる可能性があります。これらは投機的なチャート上の目標であり、確実な予測ではありません。
次の相場上昇局面で、$CATEは大きく復活できるでしょうか?🔥
#IMPACTbyTrade $CATI $LSK
Catecoinは興味深いテクニカル構造を示しており、現在は約$0.043288で取引されています。買い手は重要なサポートエリアを守ろうとしています。チャートには長期的な上昇チャネルが見られ、下側のトレンドラインが維持されれば、より大きなトレンドも強気を保つ可能性があります。
📊 重要な価格帯と長期目標
💰 現在価格:$0.043288
🟢 サポートゾーン:$0.0350–$0.0400
📈 レジスタンス1:$0.0500–$0.0600
🚀 レジスタンス2:$0.0800–$0.1000
🎯 TP1:$0.0600
🔥 TP2:$0.0800
🚀 TP3:$0.1200
🌕 チャート上の主要目標:$0.2200–$0.2300
上昇チャネルは回復の可能性を示していますが、CATEが上昇するには、より強い買いの出来高と、近くのレジスタンスを上抜けたことの確認が必要です。ブレイクアウトに成功すれば、新たな注目を集め、さらに高い価格帯を目指すきっかけになる可能性があります。
⚠️ 価格がチャネル下限のサポートを割り込むと、強気の見通しが弱まる可能性があります。これらは投機的なチャート上の目標であり、確実な予測ではありません。
次の相場上昇局面で、$CATEは大きく復活できるでしょうか?🔥
#IMPACTbyTrade $CATI $LSK
665
ログインして、さらにコンテンツを読む
厳選トピックで世界の暗号資産トレーダーの仲間入り
⚡️ 暗号資産に関する最新かつ有益な情報が見つかります。
💬 世界最大の暗号資産取引所から信頼されています。
👍 認証を受けたクリエイターから、有益なインサイトを得られます。
メール / 電話番号
トレンドトピック
1
#BTCRebounds80K
閲覧回数 25,412
524人が討論中
2
#Binance98PercentReplenished
閲覧回数 22,936
464人が討論中
3
#USMidterms-WhatAreMarketsExpecting?
閲覧回数 289,846
1,951人が討論中
4
#USOctoberNFP-AreRateCutsStillPossible
閲覧回数 368,265
2,762人が討論中
5
#AMDBeatsExpectations-AINarrativeContinues
閲覧回数 83,154
745人が討論中
6
#CircleQ3Revenue865M
閲覧回数 22,247
417人が討論中
7
#BinanceIncidentReport
閲覧回数 491,420
2,084人が討論中
8
#USStocksOpenHigherAsDowGains1.9%
閲覧回数 3,150
66人が討論中
9
#ADPUSPrivateEmployersAdd86000JobsInOctober
閲覧回数 2,536
46人が討論中
10
#FrenchAssemblyPassesSelfCustodiedCryptoReportingAmendment
閲覧回数 761
21人が討論中