

#hype
hype
閲覧回数 11.3M
49,832人が討論中
注目
最新


翻訳参照
🚨 HYPEUSDT PRICE ANALYSIS | BEARS STILL IN CONTROL? 📉
🔥 Hyperliquid (HYPE) – Daily Timeframe Analysis
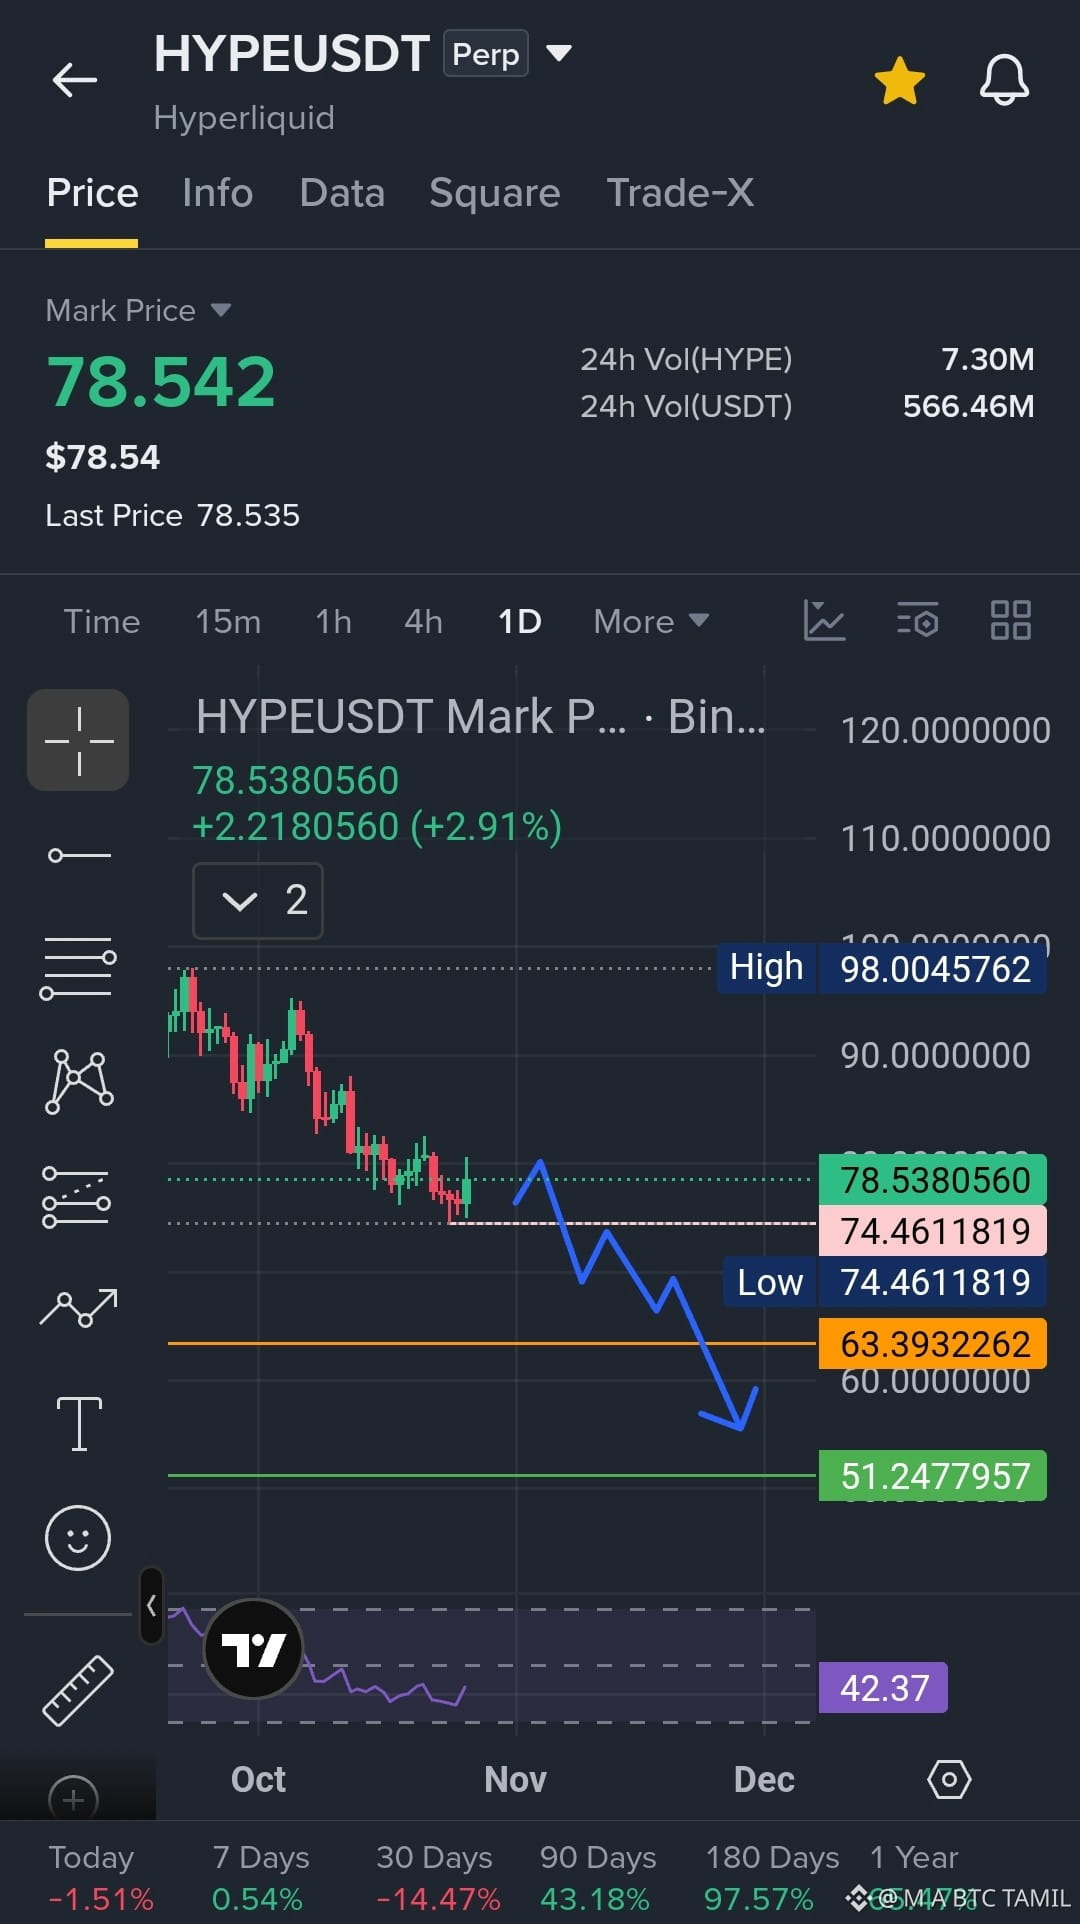
HYPE is currently trading around $78.54, showing a short-term bounce. However, the overall daily chart structure still looks bearish, with price continuing to form lower highs and lower lows.
📊 Key Technical Levels
🔴 Resistance Zone: $79.50 – $82.00
🟡 Immediate Support: $74.46
🟠 Major Support: $63.39
🟢 Long-Term Support: $51.25
📉 Bearish Scenario:
If HYPE fails to hold above the $79–$82 resistance zone and breaks below $74.46 with strong selling pressure, the price could potentially move toward $70, followed by the major support zone near $63.39.
If bearish momentum continues, $51.25 could become a deeper downside area to watch.
📈 Bullish Scenario:
If buyers successfully defend $74.46 and push the price above $82 with strong volume, a recovery toward $85–$90 could become possible.
A sustained breakout above the resistance zone would weaken the current bearish outlook.
📉 RSI Update: The RSI is around 42.37, indicating relatively weak momentum. It remains below the neutral 50 level, suggesting that bullish strength has not yet been confirmed.
⚠️ My Trading View:
The daily chart currently favors a cautious bearish outlook, but confirmation is important. A support breakdown or a confirmed resistance rejection would provide stronger evidence than entering a trade based on the chart pattern alone.
🎯 Important Levels to Watch:
• $82 – Bullish breakout confirmation zone
• $74.46 – Critical support
• $63.39 – Major downside level
• $51.25 – Deeper support zone
💡 Remember: These are technical scenarios, not guaranteed price targets. Always manage risk, use a stop-loss, and avoid excessive leverage in futures trading.
🔥 What do you think, HYPE community?
📉 Will HYPE break below $74 and move toward $63?
📈 Or will buyers push the price back above $82?
👇 Share your analysis in the comments!
#HYPE
1
201

·
--
翻訳参照
Kraken 都要来借道了,HYPE 我却没急着买说实话,昨天看到这条消息我第一反应是:这事比价格重要。
Hyperliquid 官方说,打算让 Kraken 的母公司 Payward 成为第一个受 CFTC 监管的 HIP-3 部署方。翻成人话就是:美国持牌机构想直接用 Hyperliquid 的链上撮合,给美国用户开永续合约。具体由 Payward 旗下的 Bitnomial 建市场、做清算,客户账户放在 NinjaTrader Clearing。
这件事的分量在于,一个链上交易所第一次有机会被持牌机构当成“基础设施”来用,而不是被当成监管灰色地带。
但我得把冷水也一起泼了 👇
1. 还要等监管批,功能目前只在测试网,规格官方自己都说可能会改,落地时间没人能保证。
2. 11 月 6 日有大约 992 万枚 HYPE 的核心贡献者解锁,按现在 78 美元左右算接近 7.7 亿美元。解锁不等于砸盘,但那几天情绪大概率会被拿出来做文章。
3. 竞争在变狠。Glassnode 和 Fasanara 的报告提到,它在 RWA 永续合约上的份额从 7 月的 80% 掉到了 26%,中心化交易所抢回去不少。
撑着它的东西也很实在:援助基金一直在用手续费回购,截至 10 月 13 日已经囤了 4800 多万枚 HYPE。
现在 $HYPE 市值第 11,距离 9 月 23 日 97.96 的高点还差两成,这个月跌了 15% 左右,今天反而小涨 2.5%,算是在大盘发呆的时候有点自己的故事 📈
我自己的看法:利好是中长期的叙事,解锁是眼前的现实。11 月 6 日前后怎么走,比消息本身更能说明筹码稳不稳。我会盯两件事,一是解锁前后的成交量,二是 HIP-3 的主网升级有没有给时间表。
问个好答的:如果 Hyperliquid 真被美国持牌机构接入,你觉得对 HYPE 是利好兑现,还是才刚开始?
#Hyperliquid #HYPE #DEX #监管
就是个人看法,不构成投资建议,市场有风险,仓位自己管好。
Kraken 都要来借道了,HYPE 我却没急着买
说实话,昨天看到这条消息我第一反应是:这事比价格重要。
Hyperliquid 官方说,打算让 Kraken 的母公司 Payward 成为第一个受 CFTC 监管的 HIP-3 部署方。翻成人话就是:美国持牌机构想直接用 Hyperliquid 的链上撮合,给美国用户开永续合约。具体由 Payward 旗下的 Bitnomial 建市场、做清算,客户账户放在 NinjaTrader Clearing。
这件事的分量在于,一个链上交易所第一次有机会被持牌机构当成“基础设施”来用,而不是被当成监管灰色地带。
但我得把冷水也一起泼了 👇
1. 还要等监管批,功能目前只在测试网,规格官方自己都说可能会改,落地时间没人能保证。
2. 11 月 6 日有大约 992 万枚 HYPE 的核心贡献者解锁,按现在 78 美元左右算接近 7.7 亿美元。解锁不等于砸盘,但那几天情绪大概率会被拿出来做文章。
3. 竞争在变狠。Glassnode 和 Fasanara 的报告提到,它在 RWA 永续合约上的份额从 7 月的 80% 掉到了 26%,中心化交易所抢回去不少。
撑着它的东西也很实在:援助基金一直在用手续费回购,截至 10 月 13 日已经囤了 4800 多万枚 HYPE。
现在 $HYPE 市值第 11,距离 9 月 23 日 97.96 的高点还差两成,这个月跌了 15% 左右,今天反而小涨 2.5%,算是在大盘发呆的时候有点自己的故事 📈
我自己的看法:利好是中长期的叙事,解锁是眼前的现实。11 月 6 日前后怎么走,比消息本身更能说明筹码稳不稳。我会盯两件事,一是解锁前后的成交量,二是 HIP-3 的主网升级有没有给时间表。
问个好答的:如果 Hyperliquid 真被美国持牌机构接入,你觉得对 HYPE 是利好兑现,还是才刚开始?
#Hyperliquid #HYPE #DEX #监管
就是个人看法,不构成投资建议,市场有风险,仓位自己管好。
10

·
--
翻訳参照
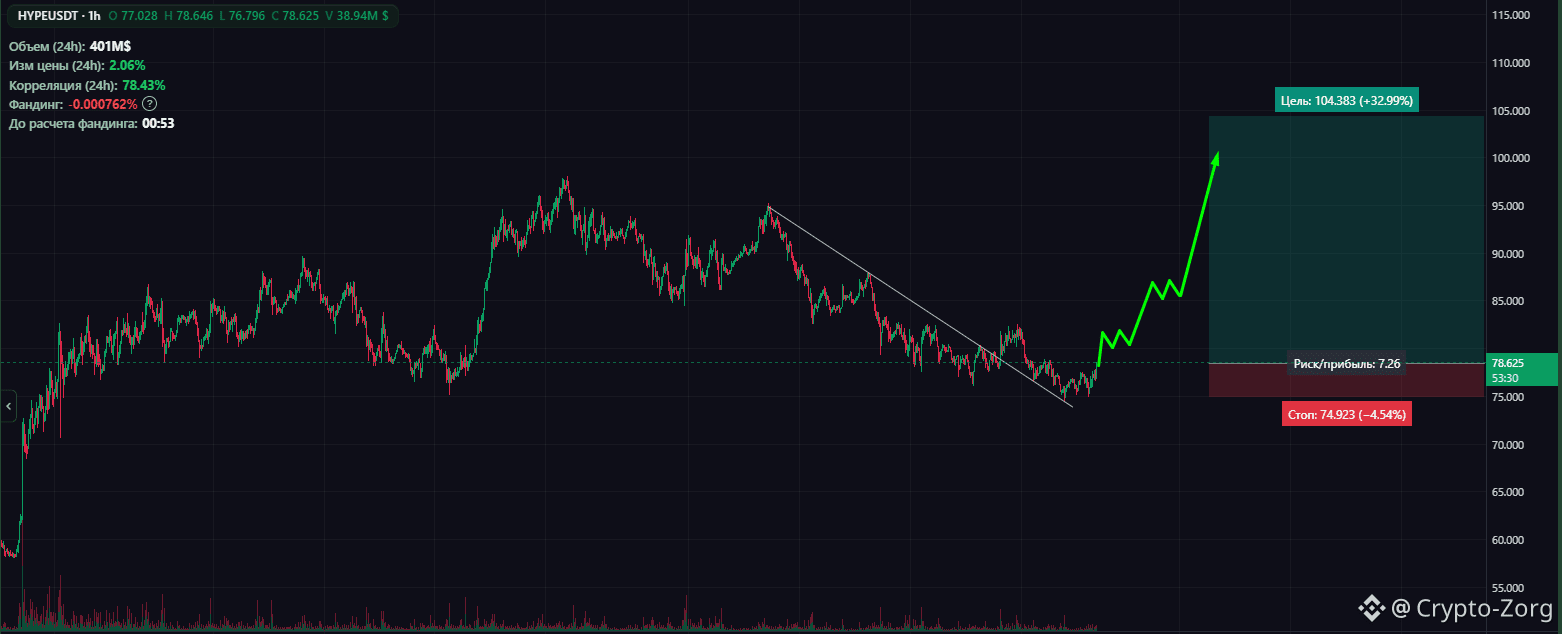
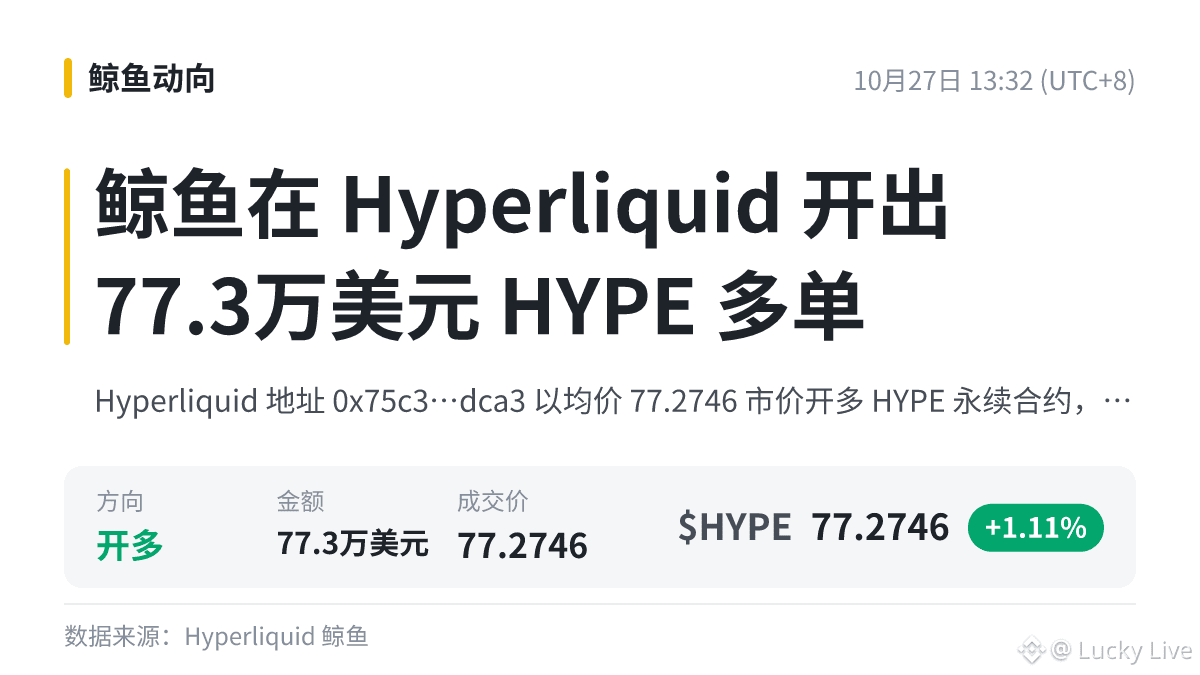
🦈 OVER $42M IN $HYPE ABSORBED BY INSTITUTIONAL WHALES TODAY! 📈
Smart money is aggressively filling their bids. Over 524k $HYPE worth $42.76M just got locked up across two massive whale transactions today. 🦈 One seasoned wallet absorbed $35.1M while a fresh wallet yanked $7.66M directly off liquidity desks.
With steady ETF inflows compounding this heavy accumulation, deep-pocket buyers are visibly positioning for an expansion toward higher resistance. 📊 When high-conviction entities sweep market liquidity at this scale, float thins out rapidly. 💡
💬 Are you front-running this institutional bid or waiting for price to reclaim key resistance levels first? 👇
⚠️ Not financial advice. Always manage your risk. 🛡️
🏷️ #HYPE #WhaleAccumulation #Crypto #SmartMoney #Breakout
🎯 🦈
23


·
--
翻訳参照
🚀 美國合規大門打開?Kraken 母公司選中 Hyperliquid,$HYPE 盤中衝上 80 美元
📌 大事:Hyperliquid 官方台北時間今天凌晨在 X 確認,Kraken 母公司 Payward 打算成為第一個受美國 CFTC 監管的 HIP-3* 市場部署方,用 Hyperliquid 當底層,替美國客戶上架鏈上永續合約。官方這則貼文已破 3,000 讚。
📌 架構:由 Payward 旗下受 CFTC 監管的 Bitnomial 負責建市場、清算與結算,NinjaTrader Clearing 管客戶帳戶,只有通過白名單的帳戶能交易。功能目前在測試網、仍待監管批准,但等於替美國合規資金預留了一條上鏈通道。
📌 大佬:Revere Asset 投資經理 Ted Zhang 直言,美國合規管道接入 Hyperliquid,就是 $HYPE 這波跳漲的主因。
📌 數據:DefiLlama 顯示 Hyperliquid 永續合約未平倉量約 75 億美元;$HYPE 幣安現貨 24 小時最高 80.65 美元,目前約 77.7 美元、日漲約 3%,回檔仍穩守 75 美元上方。
💬 華爾街合規通道+鏈上訂單簿,你覺得 HYPE 會是下一個被機構重新定價的幣嗎?留言聊聊👇
#HYPE
$HYPE

128

·
--
翻訳参照
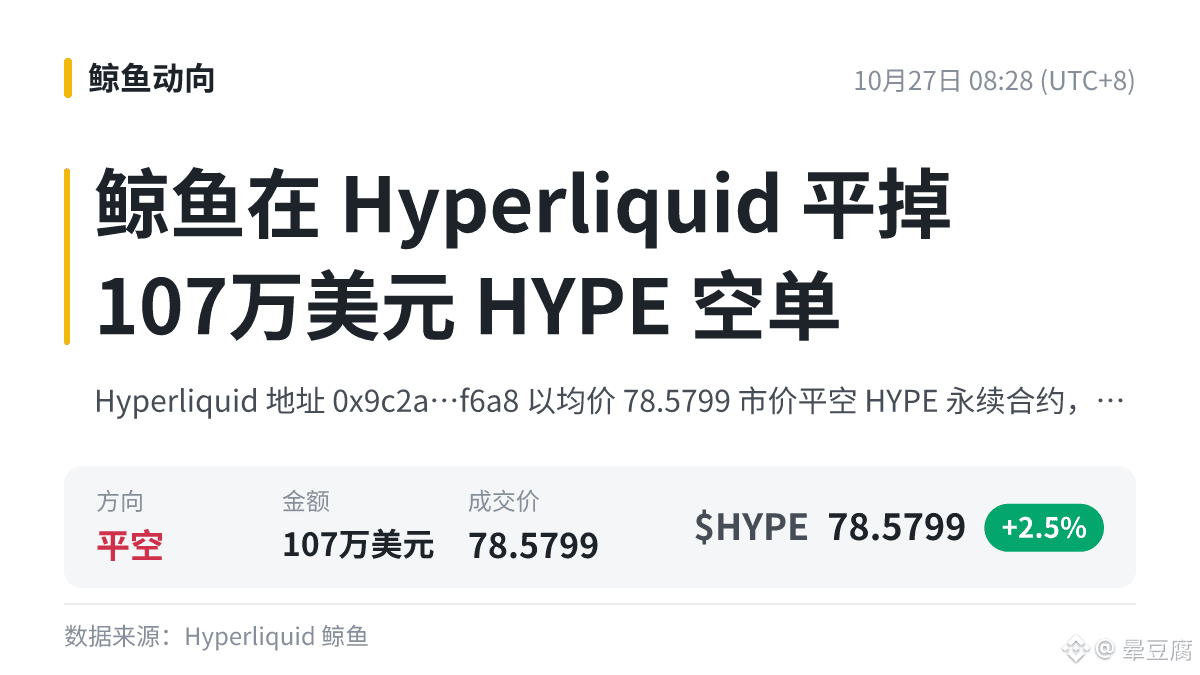
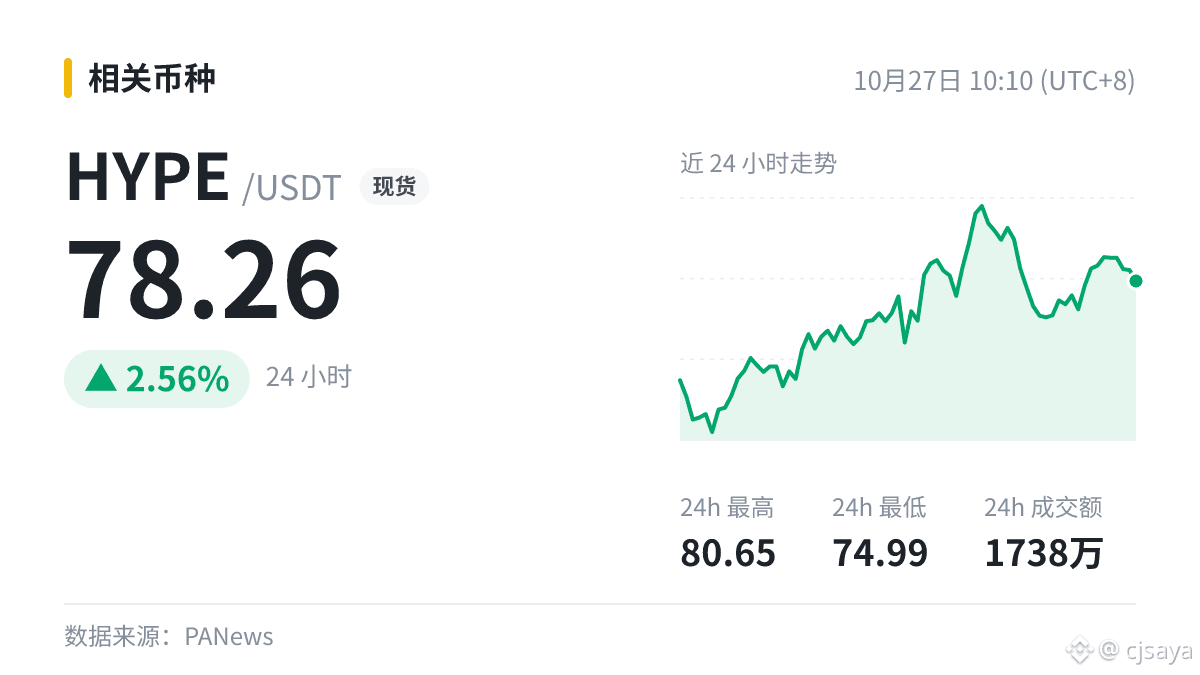
美国 HYPE 现货 ETF 单日总净流出 429.84 万美元。
前高和关键均线在哪,消息不会改变,这几个位置才是真正要盯的。
利空落地反而是不确定性变小,不过得等价格走出确认。
$HYPE 眼下 78.26。
#HYPE
美国 HYPE 现货 ETF 单日总净流出 429.84 万美元。
前高和关键均线在哪,消息不会改变,这几个位置才是真正要盯的。
利空落地反而是不确定性变小,不过得等价格走出确认。
$HYPE 眼下 78.26。
#HYPE
前高和关键均线在哪,消息不会改变,这几个位置才是真正要盯的。
利空落地反而是不确定性变小,不过得等价格走出确认。
$HYPE 眼下 78.26。
#HYPE
105

·
--
ブリッシュ
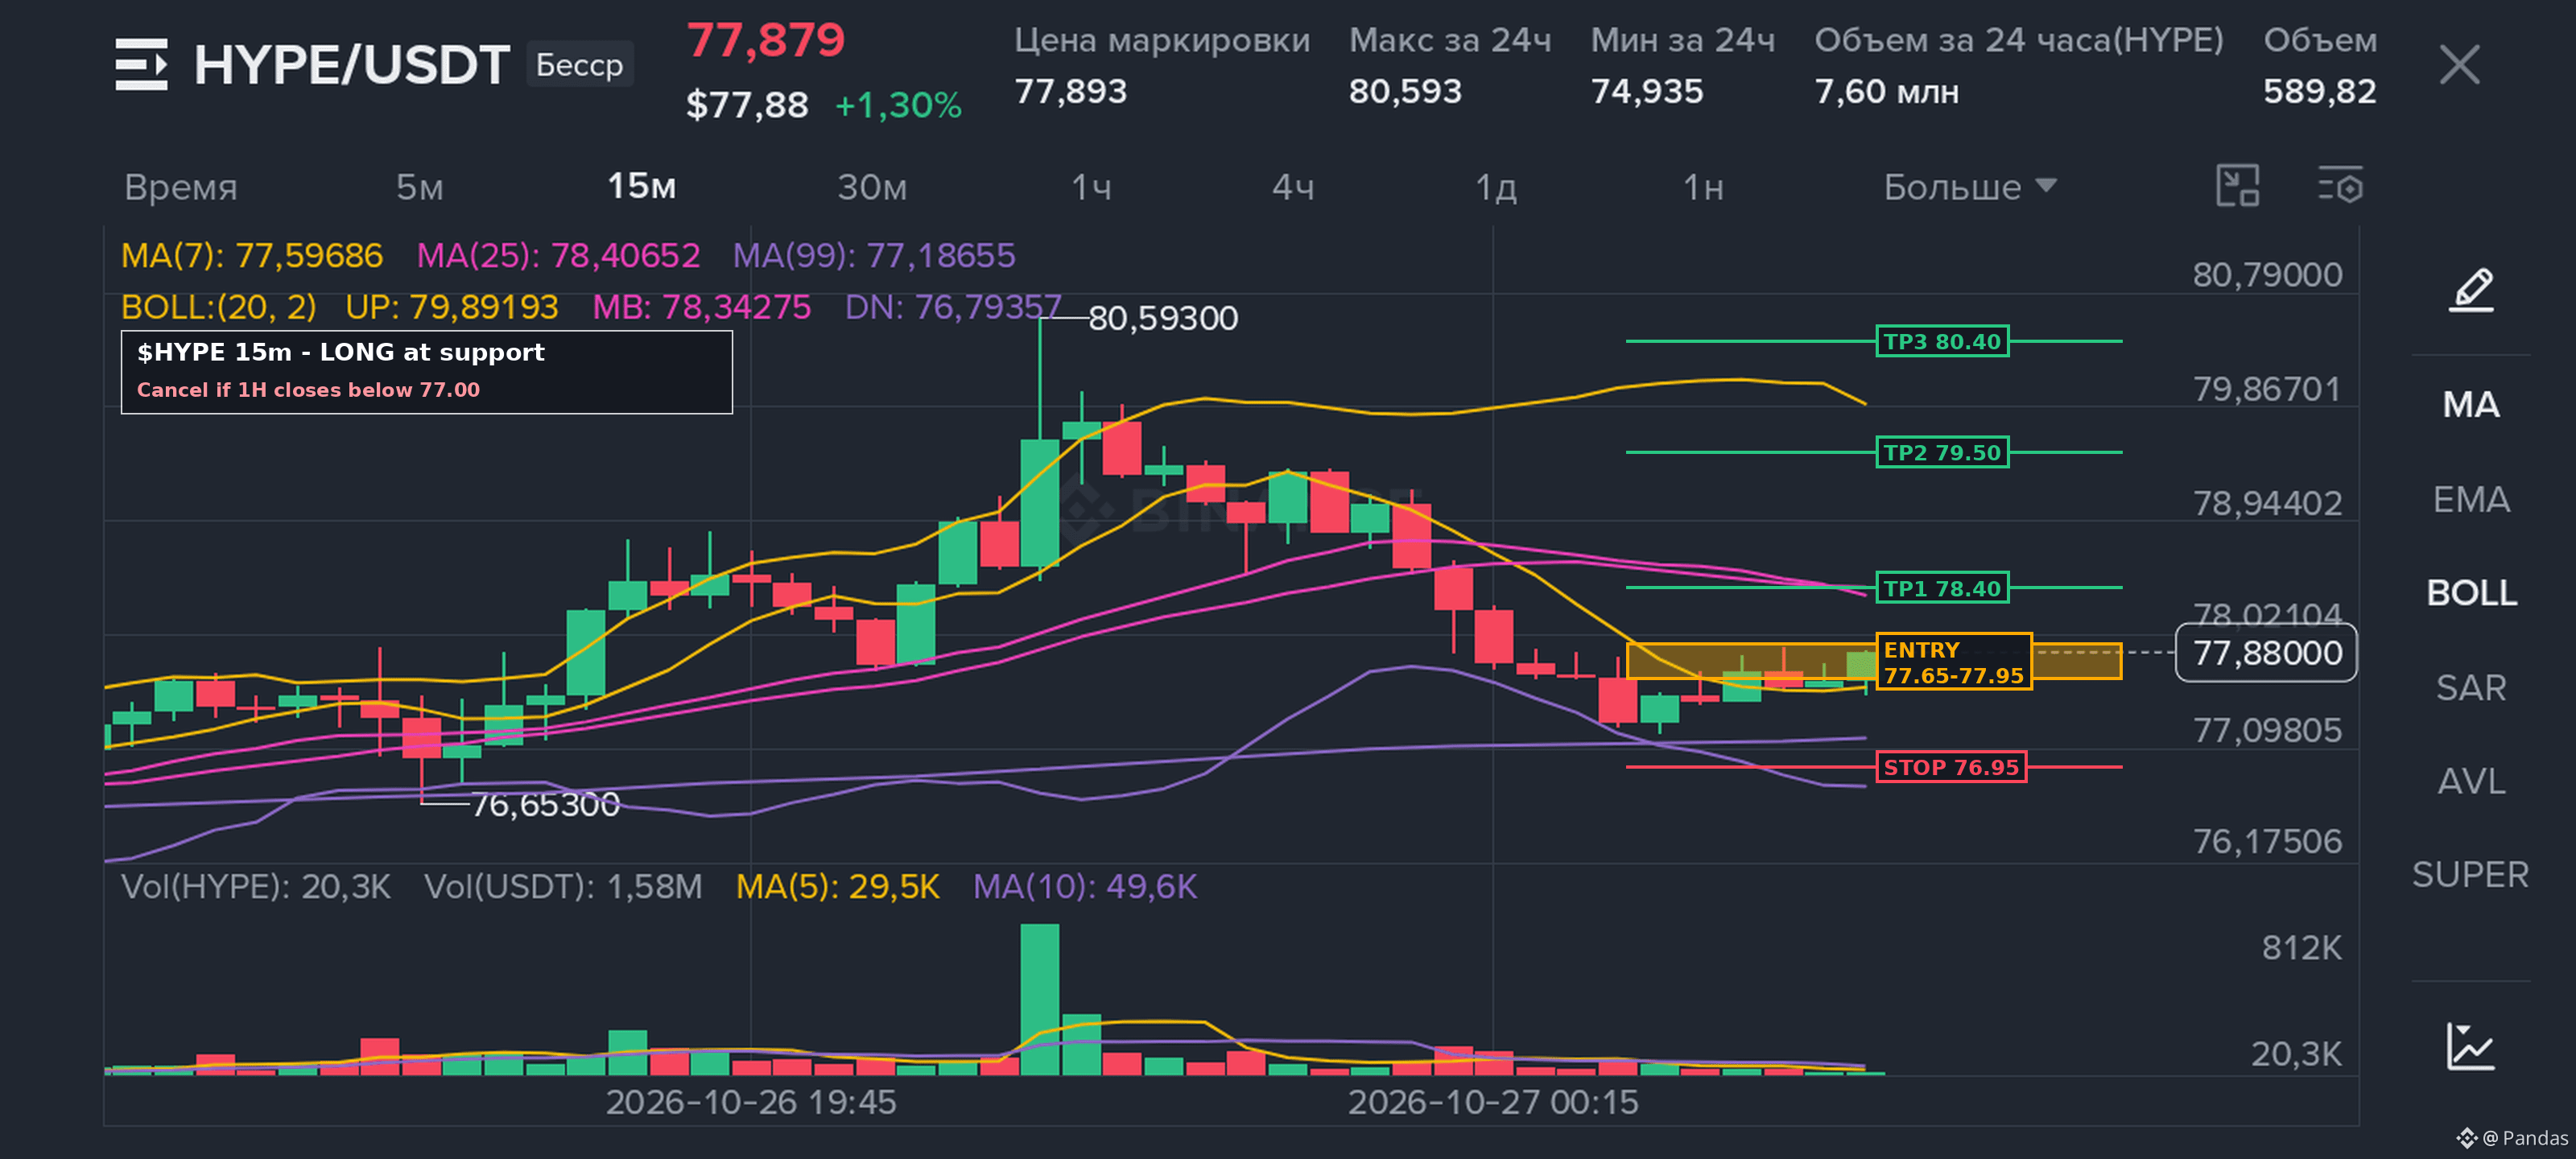
$HYPE : ロング
エントリー: 77.65 – 77.95
ストップ: 76.95
TP1: 78.40 TP2: 79.50 TP3: 80.40
77.0–77.3のサポートから反発、今がエントリーのタイミングです。無効化条件: 1時間足のローソク足が77.00を下回ること。
リスクは最大1%。
ロング中の人、78.40のブレイクアウトを待っている人はいますか?
#HYPE #longsetup
{future}(HYPEUSDT)
$HYPE : ロング
エントリー: 77.65 – 77.95
ストップ: 76.95
TP1: 78.40 TP2: 79.50 TP3: 80.40
77.0–77.3のサポートから反発、今がエントリーのタイミングです。無効化条件: 1時間足のローソク足が77.00を下回ること。
リスクは最大1%。
ロング中の人、78.40のブレイクアウトを待っている人はいますか?
#HYPE #longsetup
エントリー: 77.65 – 77.95
ストップ: 76.95
TP1: 78.40 TP2: 79.50 TP3: 80.40
77.0–77.3のサポートから反発、今がエントリーのタイミングです。無効化条件: 1時間足のローソク足が77.00を下回ること。
リスクは最大1%。
ロング中の人、78.40のブレイクアウトを待っている人はいますか?
#HYPE #longsetup
1
1
180

·
--
一部該当

記事
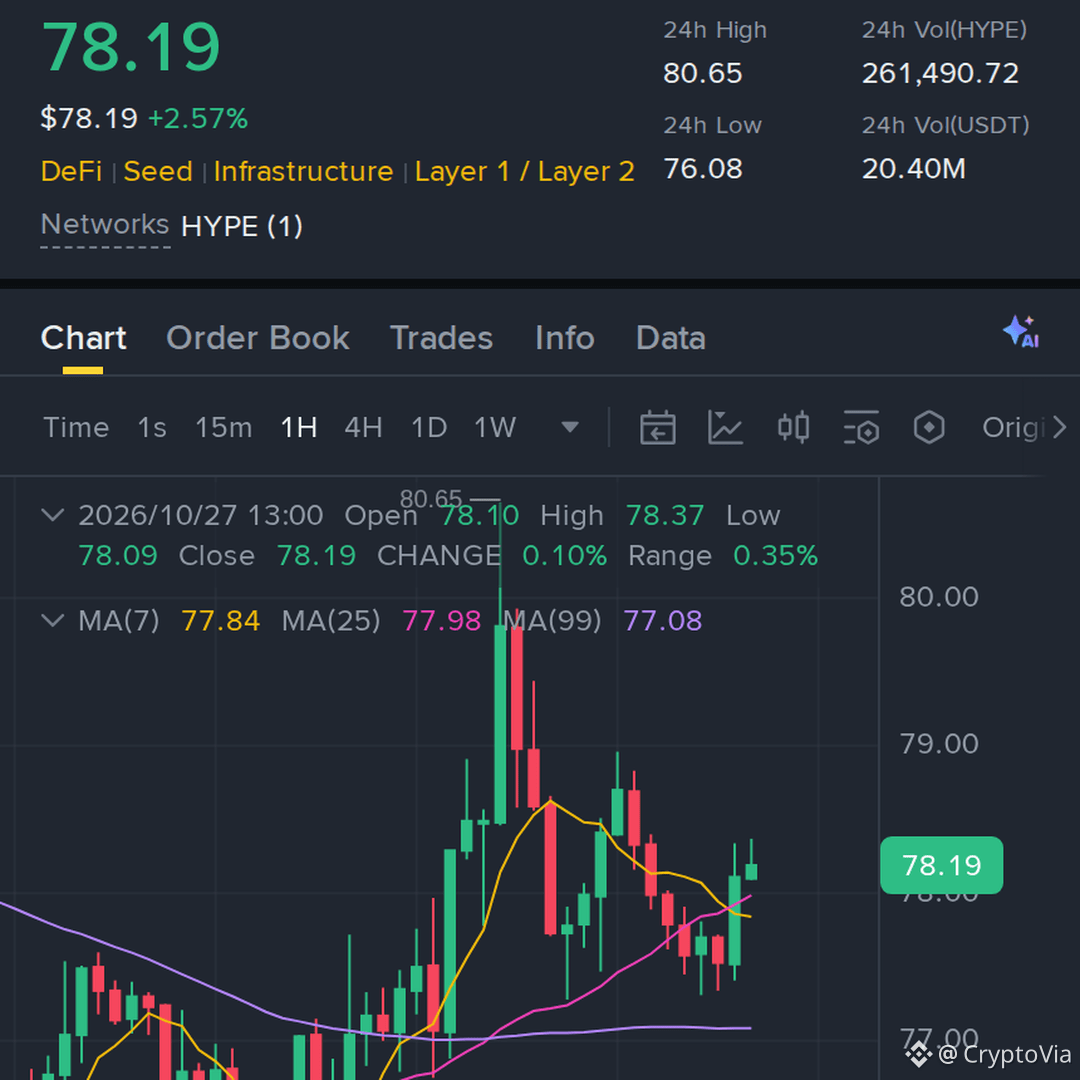
「これは取引所ではない」——なぜHyperliquidの創設者はこの言葉に反発するのかHyperliquidは、そもそも「取引所」ではない。そう考えているのは、その創設者だ
普通の取引所を想像してみてください。レジ係のいる店のようなものです。会社があり、建物があり、ルールがあり、「すべてを凍結する」ボタンがあります。あなたのお金はその会社に預けられています。従来の取引所では、会社があなたのお金を保管し、インフラを管理します。一方、Hyperliquidでは、あなた自身が資産を保管し、プラットフォームは誰にでも開かれています。
「これは取引所ではない」——なぜHyperliquidの創設者はこの言葉に反発するのか
Hyperliquidは、そもそも「取引所」ではない。そう考えているのは、その創設者だ
普通の取引所を想像してみてください。レジ係のいる店のようなものです。会社があり、建物があり、ルールがあり、「すべてを凍結する」ボタンがあります。あなたのお金はその会社に預けられています。従来の取引所では、会社があなたのお金を保管し、インフラを管理します。一方、Hyperliquidでは、あなた自身が資産を保管し、プラットフォームは誰にでも開かれています。
普通の取引所を想像してみてください。レジ係のいる店のようなものです。会社があり、建物があり、ルールがあり、「すべてを凍結する」ボタンがあります。あなたのお金はその会社に預けられています。従来の取引所では、会社があなたのお金を保管し、インフラを管理します。一方、Hyperliquidでは、あなた自身が資産を保管し、プラットフォームは誰にでも開かれています。
1
1.7k



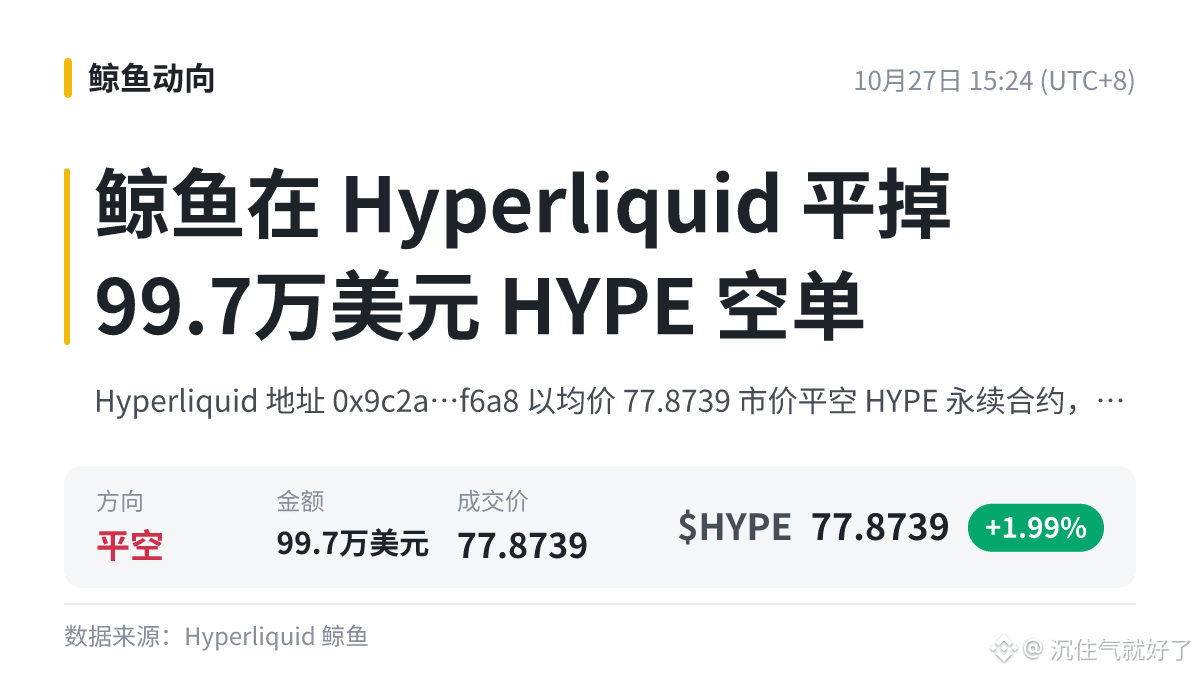
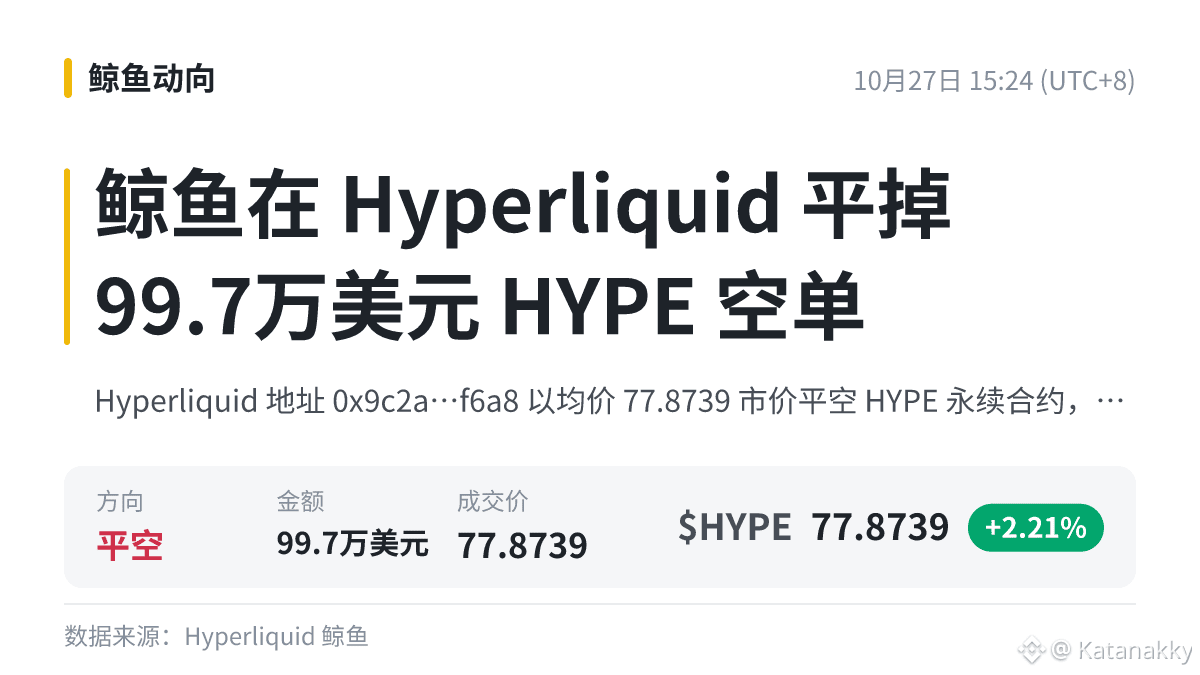
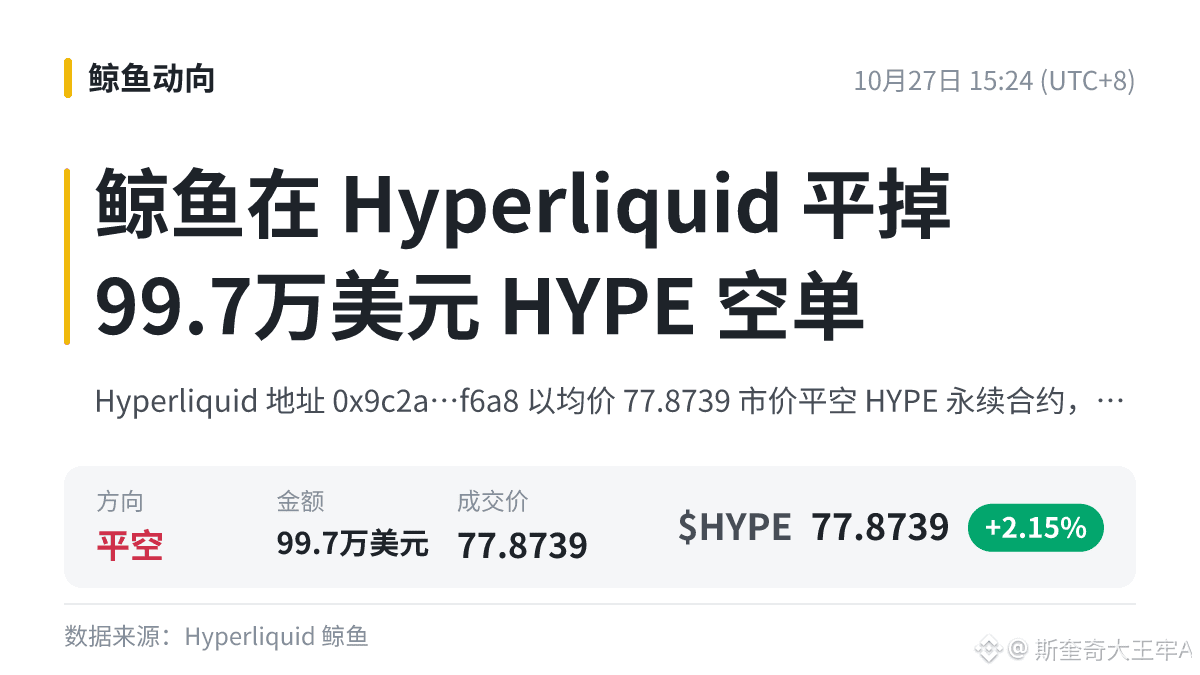

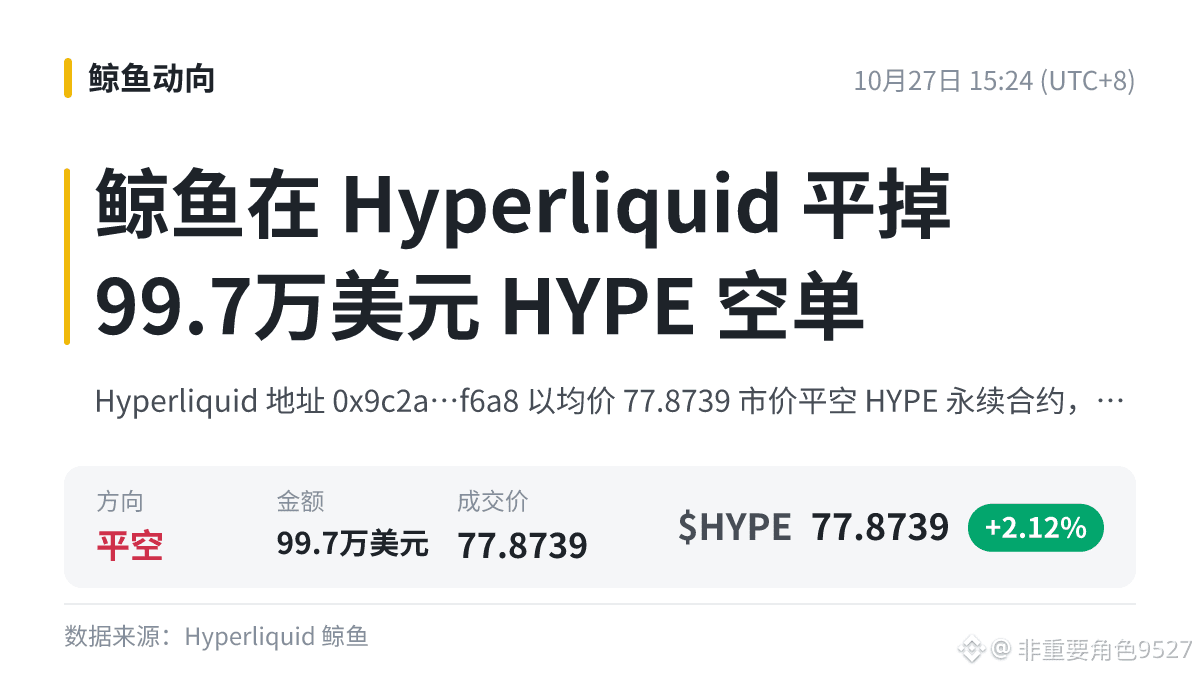

·
--
翻訳参照
真金白银会怎么表态?
Binance将HYPEUSDT、SUIUSDT等25个独立保证金交易对最高杠杆从10倍下调至5倍
合约持仓和现货买盘要分开看:现货带起来的行情更扎实。第一感觉偏负面,不过影响有多大,得看接下来抛压重不重。
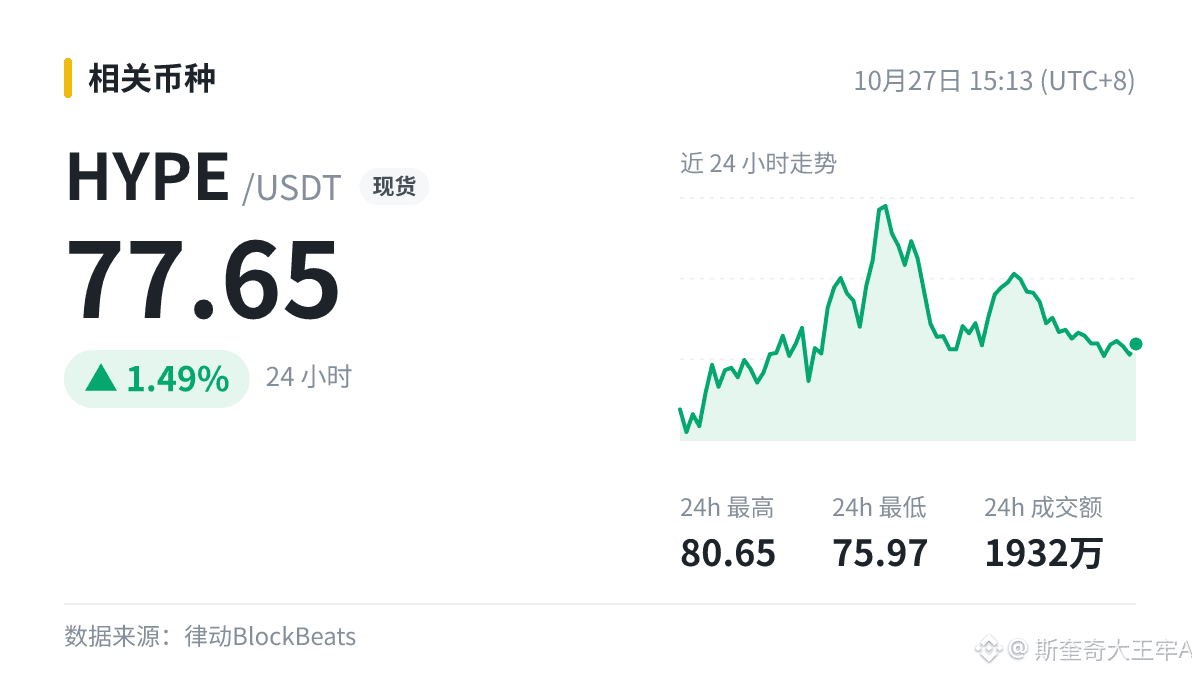
$HYPE 最新 77.65。
#HYPE
真金白银会怎么表态?
Binance将HYPEUSDT、SUIUSDT等25个独立保证金交易对最高杠杆从10倍下调至5倍
合约持仓和现货买盘要分开看:现货带起来的行情更扎实。第一感觉偏负面,不过影响有多大,得看接下来抛压重不重。
$HYPE 最新 77.65。
#HYPE
Binance将HYPEUSDT、SUIUSDT等25个独立保证金交易对最高杠杆从10倍下调至5倍
合约持仓和现货买盘要分开看:现货带起来的行情更扎实。第一感觉偏负面,不过影响有多大,得看接下来抛压重不重。
$HYPE 最新 77.65。
#HYPE
2

·
--
翻訳参照
Binance将HYPEUSDT、SUIUSDT等25个独立保证金交易对最高杠杆从10倍下调至5倍
这条你们刷到了没?消息面今天挺热闹,但操作要稳!
利空来得突然,价格的第一反应往往偏激,冷静比什么都重要。
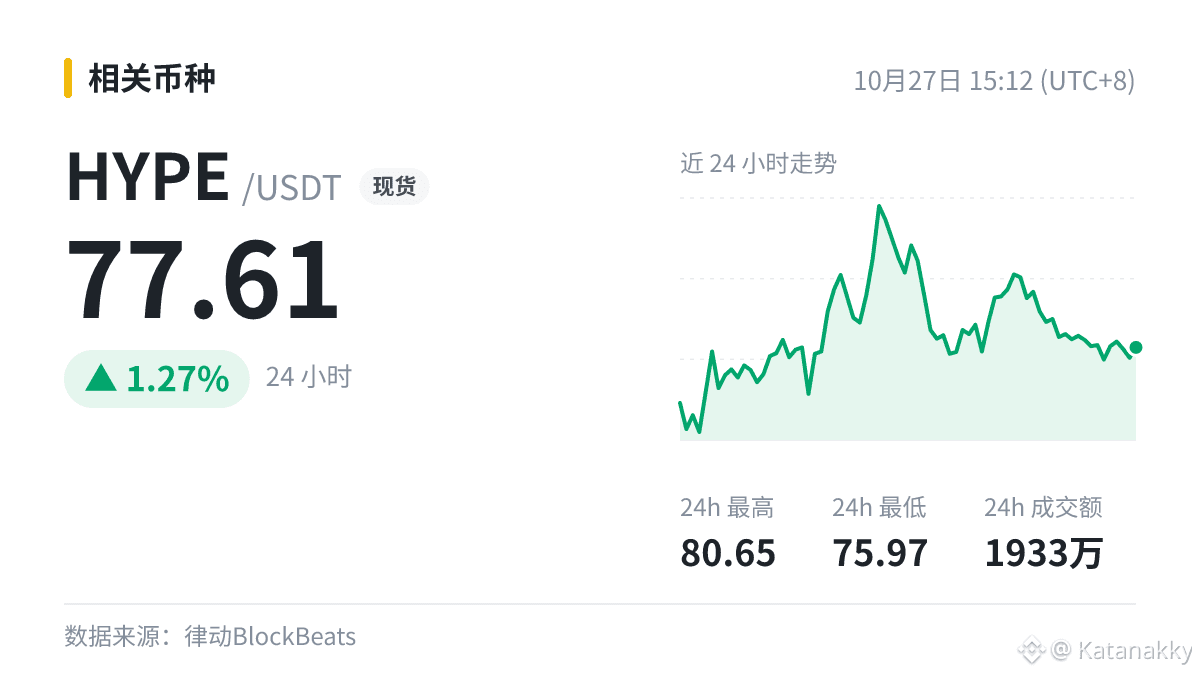
$HYPE 眼下 77.61
#HYPE
听听就行,别照着买,自己拿主意。
Binance将HYPEUSDT、SUIUSDT等25个独立保证金交易对最高杠杆从10倍下调至5倍
这条你们刷到了没?消息面今天挺热闹,但操作要稳!
利空来得突然,价格的第一反应往往偏激,冷静比什么都重要。
$HYPE 眼下 77.61
#HYPE
听听就行,别照着买,自己拿主意。
这条你们刷到了没?消息面今天挺热闹,但操作要稳!
利空来得突然,价格的第一反应往往偏激,冷静比什么都重要。
$HYPE 眼下 77.61
#HYPE
听听就行,别照着买,自己拿主意。
27

·
--
翻訳参照
数据不带情绪,情绪容易骗人,所以先看数据。
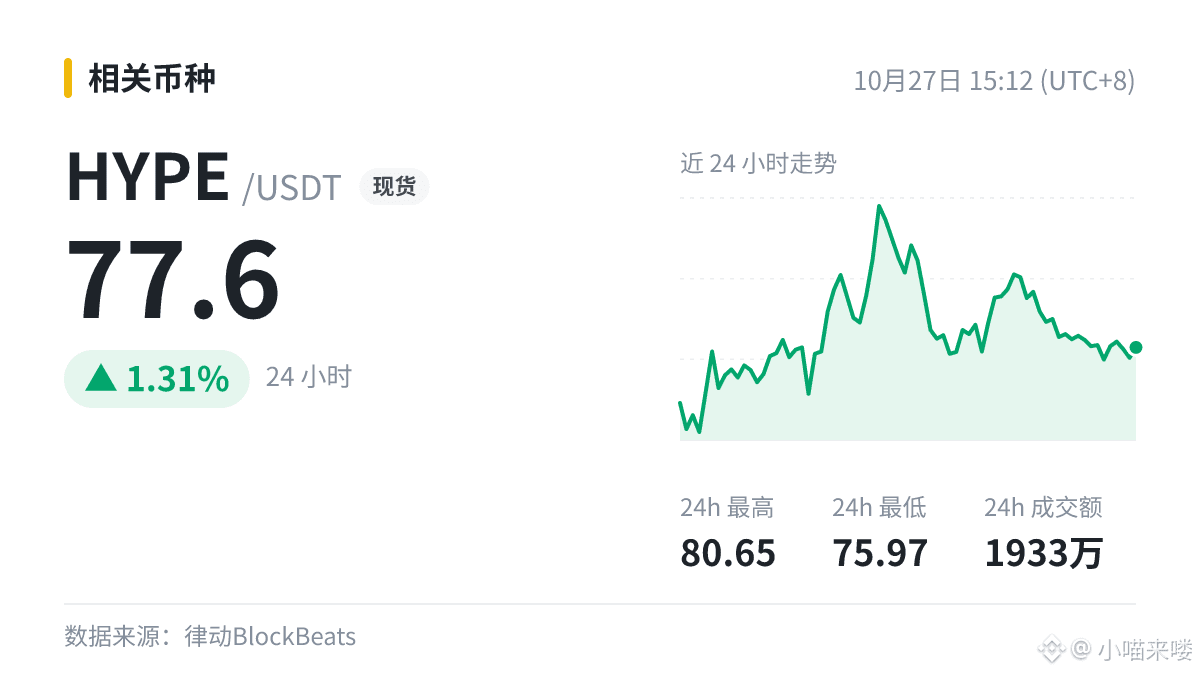
比如眼前这条:Binance将HYPEUSDT、SUIUSDT等25个独立保证金交易对最高杠杆从10倍下调至5倍,$HYPE ,成交 1933万。
情绪受挫不代表趋势走坏,支撑位能不能守住才是关键。
#HYPE
数据不带情绪,情绪容易骗人,所以先看数据。
比如眼前这条:Binance将HYPEUSDT、SUIUSDT等25个独立保证金交易对最高杠杆从10倍下调至5倍,$HYPE ,成交 1933万。
情绪受挫不代表趋势走坏,支撑位能不能守住才是关键。
#HYPE
比如眼前这条:Binance将HYPEUSDT、SUIUSDT等25个独立保证金交易对最高杠杆从10倍下调至5倍,$HYPE ,成交 1933万。
情绪受挫不代表趋势走坏,支撑位能不能守住才是关键。
#HYPE
5

·
--
翻訳参照
【速递】Binance将HYPEUSDT、SUIUSDT等25个独立保证金交易对最高杠杆从10倍下调至5倍
· 利空之下,我更在意下方有没有承接。
· 可以翻翻以前同类事件出来时,盘面是怎么走的。
· $HYPE 最新 77.61
快讯只是第一手信息,后面的细节可能还有补充。
#HYPE
仅作记录,不是投资建议。
【速递】Binance将HYPEUSDT、SUIUSDT等25个独立保证金交易对最高杠杆从10倍下调至5倍
· 利空之下,我更在意下方有没有承接。
· 可以翻翻以前同类事件出来时,盘面是怎么走的。
· $HYPE 最新 77.61
快讯只是第一手信息,后面的细节可能还有补充。
#HYPE
仅作记录,不是投资建议。
· 利空之下,我更在意下方有没有承接。
· 可以翻翻以前同类事件出来时,盘面是怎么走的。
· $HYPE 最新 77.61
快讯只是第一手信息,后面的细节可能还有补充。
#HYPE
仅作记录,不是投资建议。
ログインして、さらにコンテンツを読む
厳選トピックで世界の暗号資産トレーダーの仲間入り
⚡️ 暗号資産に関する最新かつ有益な情報が見つかります。
💬 世界最大の暗号資産取引所から信頼されています。
👍 認証を受けたクリエイターから、有益なインサイトを得られます。
メール / 電話番号
トレンドトピック
1
#StrategySkipsBitcoinPurchasesSpends$205MOnSTRCBuybacks
閲覧回数 1,471
49人が討論中
2
#BitmineAdds10452ETH
閲覧回数 16,218
346人が討論中
3
#SouthKoreaConsidersEducationTaxOnCryptoExchanges
閲覧回数 12,601
300人が討論中
4
#OCCUrgesCommunityBanksToEnterStablecoinPayments
閲覧回数 10,858
179人が討論中
5
#RippleWinsFullApprovalAsNationalTrustBank
閲覧回数 9,829
191人が討論中
6
#AkashSelectsSolanaAsMigrationTarget
閲覧回数 7,529
95人が討論中
7
#OndoToOpenSubscriptionsForOpenAIPreIPOTokenizedNotes
閲覧回数 431
20人が討論中
8
#AnthropicTTMRevenueGrewAbout1200%
閲覧回数 63,764
623人が討論中
9
#AnthropicS1ExpectedToday
閲覧回数 45,869
419人が討論中
10
#SouthKoreaReportedlyWeighsFourthCryptoTaxDelay
閲覧回数 42,500
528人が討論中