

#etharium
etharium
閲覧回数 345
17人が討論中
注目
最新





·
--
翻訳参照
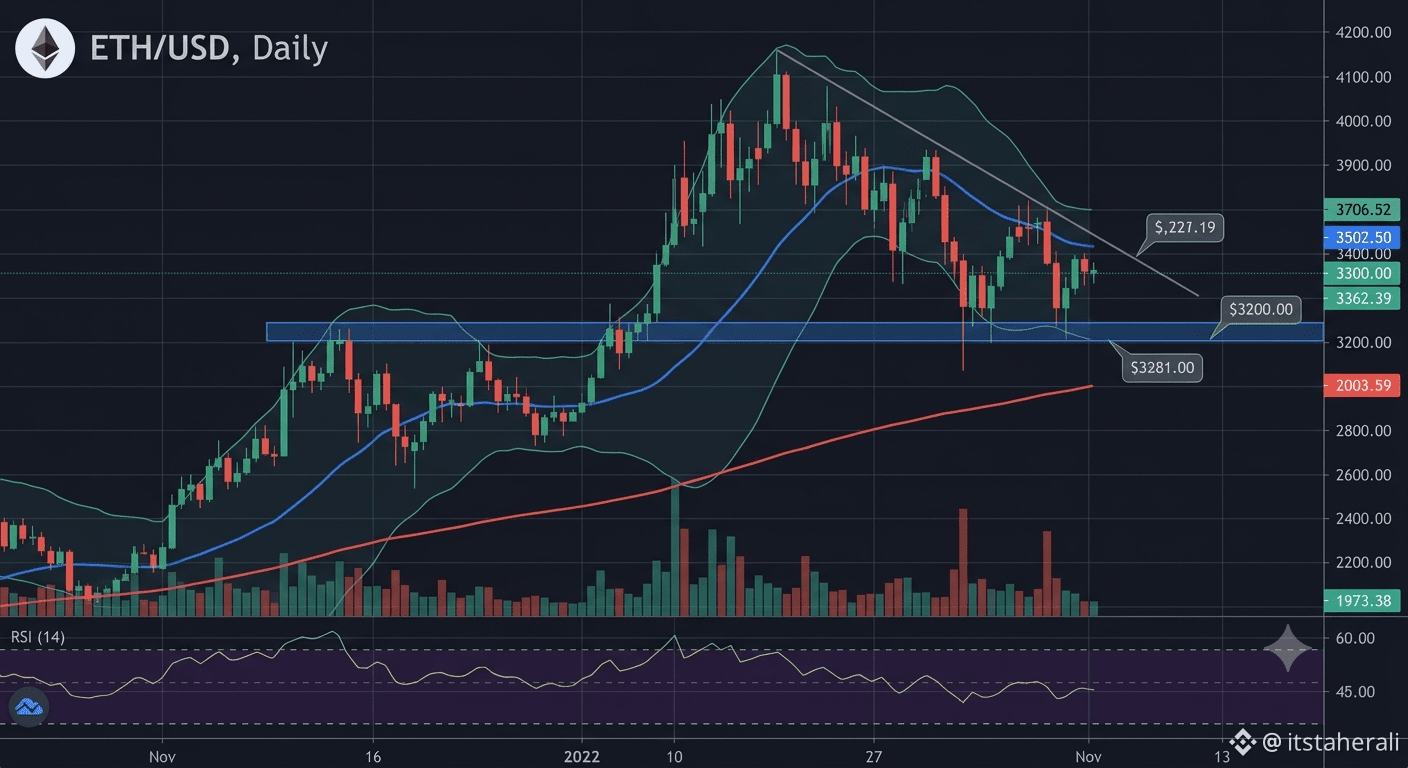
$ETH The Multi-Year Support Cluster ($2,800 - $3,000): This is the single most important zone on the chart.
Horizontal Support: The broad, shaded green zone represents major historical support dating back to previous market cycles. This is where demand has repeatedly stepped in.
200-Day Moving Average (Purple Line): This long-term trend indicator is perfectly converging with this horizontal support zone. When price meets the 200-DMA after a long time, it is usually a high-probability reversal area.
Technical Squeeze: Price is now squeezed tightly between this support cluster and an overhead descending trendline that has defined the correction.
Short-Term Resistance and Indicators:
Descending Trendline (Red Dash): This line, starting from the $4,800 peak, continues to cap all recovery attempts. A daily close above this line is required to invalidate the bearish correction structure.
Volume Profile: Volume has been generally declining during this consolidation phase, which is typical before a large, breakout move.
MACD (Lower Panel): The MACD histogram is showing declining bearish momentum (getting closer to zero), hinting that the selling pressure is exhausting itself at this critical support.
Outlook and Potential Scenarios:
The technical confluence at the $2,800 - $3,000 zone makes it a high-conviction area for a potential market reversal.
Bullish Breakout Scenario (The Washout and Recovery): The high-probability setup from this chart is that the current zone provides the platform for the next major leg up. If ETH can break above the overhead descending trendline (at roughly $3,400), it would trigger a strong 'V-shape' or 'Rounding Bottom' recovery, with initial targets back toward $4,000 and the all-time high.
Bearish Confirmation Scenario (The Breakdown): In the event of extreme negative market sentiment,
CrudeBrieflyFallsBelow$90
#BrentCrudeFallsAbout6%
#CXMTStarMarketIPORaises57.9BYuan
#WTICrudeFuturesFall8%
#ETH
#Etharium
{spot}(ETHUSDT)
$ETH The Multi-Year Support Cluster ($2,800 - $3,000): This is the single most important zone on the chart.
Horizontal Support: The broad, shaded green zone represents major historical support dating back to previous market cycles. This is where demand has repeatedly stepped in.
200-Day Moving Average (Purple Line): This long-term trend indicator is perfectly converging with this horizontal support zone. When price meets the 200-DMA after a long time, it is usually a high-probability reversal area.
Technical Squeeze: Price is now squeezed tightly between this support cluster and an overhead descending trendline that has defined the correction.
Short-Term Resistance and Indicators:
Descending Trendline (Red Dash): This line, starting from the $4,800 peak, continues to cap all recovery attempts. A daily close above this line is required to invalidate the bearish correction structure.
Volume Profile: Volume has been generally declining during this consolidation phase, which is typical before a large, breakout move.
MACD (Lower Panel): The MACD histogram is showing declining bearish momentum (getting closer to zero), hinting that the selling pressure is exhausting itself at this critical support.
Outlook and Potential Scenarios:
The technical confluence at the $2,800 - $3,000 zone makes it a high-conviction area for a potential market reversal.
Bullish Breakout Scenario (The Washout and Recovery): The high-probability setup from this chart is that the current zone provides the platform for the next major leg up. If ETH can break above the overhead descending trendline (at roughly $3,400), it would trigger a strong 'V-shape' or 'Rounding Bottom' recovery, with initial targets back toward $4,000 and the all-time high.
Bearish Confirmation Scenario (The Breakdown): In the event of extreme negative market sentiment,
CrudeBrieflyFallsBelow$90
#BrentCrudeFallsAbout6%
#CXMTStarMarketIPORaises57.9BYuan
#WTICrudeFuturesFall8%
#ETH
#Etharium
Horizontal Support: The broad, shaded green zone represents major historical support dating back to previous market cycles. This is where demand has repeatedly stepped in.
200-Day Moving Average (Purple Line): This long-term trend indicator is perfectly converging with this horizontal support zone. When price meets the 200-DMA after a long time, it is usually a high-probability reversal area.
Technical Squeeze: Price is now squeezed tightly between this support cluster and an overhead descending trendline that has defined the correction.
Short-Term Resistance and Indicators:
Descending Trendline (Red Dash): This line, starting from the $4,800 peak, continues to cap all recovery attempts. A daily close above this line is required to invalidate the bearish correction structure.
Volume Profile: Volume has been generally declining during this consolidation phase, which is typical before a large, breakout move.
MACD (Lower Panel): The MACD histogram is showing declining bearish momentum (getting closer to zero), hinting that the selling pressure is exhausting itself at this critical support.
Outlook and Potential Scenarios:
The technical confluence at the $2,800 - $3,000 zone makes it a high-conviction area for a potential market reversal.
Bullish Breakout Scenario (The Washout and Recovery): The high-probability setup from this chart is that the current zone provides the platform for the next major leg up. If ETH can break above the overhead descending trendline (at roughly $3,400), it would trigger a strong 'V-shape' or 'Rounding Bottom' recovery, with initial targets back toward $4,000 and the all-time high.
Bearish Confirmation Scenario (The Breakdown): In the event of extreme negative market sentiment,
CrudeBrieflyFallsBelow$90
#BrentCrudeFallsAbout6%
#CXMTStarMarketIPORaises57.9BYuan
#WTICrudeFuturesFall8%
#ETH
#Etharium
70
ログインして、さらにコンテンツを読む
厳選トピックで世界の暗号資産トレーダーの仲間入り
⚡️ 暗号資産に関する最新かつ有益な情報が見つかります。
💬 世界最大の暗号資産取引所から信頼されています。
👍 認証を受けたクリエイターから、有益なインサイトを得られます。
メール / 電話番号
トレンドトピック
1
#ADAGains10%Above$0.27
閲覧回数 12,090
164人が討論中
2
#ETHUp70%InQ3ButLiquidityFalls
閲覧回数 135,327
985人が討論中
3
#EthStakingExitQueueHits2026High
閲覧回数 47,783
711人が討論中
4
#FedOctoberHoldOdds82.3%
閲覧回数 46,894
660人が討論中
5
#Nikkei225Jumps2.5%ToThreeMonthHigh
閲覧回数 75,055
1,037人が討論中
6
#CircleMints$2.75BUSDCOnSolanaIn7Days
閲覧回数 1,590
40人が討論中
7
#DriftHackVictimsBeginClaims
閲覧回数 166,775
1,693人が討論中
8
#SolanaTokenizedStockVolumeTops$4.4BInSeptember
閲覧回数 12,899
130人が討論中
9
#BitcoinSpotETFsDraw$6.34BInflowsInQ3
閲覧回数 52,703
262人が討論中
10
#EthereumValidatorExitQueueJumps392%
閲覧回数 299,129
2,550人が討論中