
#fet
fet
閲覧回数 14M
26,306人が討論中
注目
最新

·
--
$FET (ASI) – 大反転か、それともさらなる下落か?
$FET は重要なテクニカルゾーンに近づいており、次の値動きが短期的な方向性を決める可能性があります。
{spot}(FETUSDT)
📊 注目すべき重要な価格帯:
🟢 サポート:$0.140 / $0.133 / $0.119
🔴 レジスタンス:$0.151 / $0.157 / $0.165
📈 強気シナリオ:
$0.151を力強く上抜ければ、$0.157、さらに$0.165を目指す展開が期待できます。
📉 弱気シナリオ:
$0.140を割り込むと、$0.133、さらには$0.119まで下落する可能性があります。
ファンダメンタルズの見通し:
AIエージェントと分散型AIは、引き続き有望な分野です。AI関連の暗号資産プロジェクトが市場の勢いを取り戻せば、FETにも恩恵が及ぶ可能性があります。
私の見解:
FETには売られ過ぎの兆候が見られますが、反転が確認されるにはまだ時間が必要です。エントリー前に、出来高とBTCの方向性を確認しましょう。
🎯 賢く取引し、リスクを管理しましょう。急騰に飛び乗るのは禁物です!
#FET #ASI #FetchAI #AI
$FET (ASI) – 大反転か、それともさらなる下落か?
$FET は重要なテクニカルゾーンに近づいており、次の値動きが短期的な方向性を決める可能性があります。
📊 注目すべき重要な価格帯:
🟢 サポート:$0.140 / $0.133 / $0.119
🔴 レジスタンス:$0.151 / $0.157 / $0.165
📈 強気シナリオ:
$0.151を力強く上抜ければ、$0.157、さらに$0.165を目指す展開が期待できます。
📉 弱気シナリオ:
$0.140を割り込むと、$0.133、さらには$0.119まで下落する可能性があります。
ファンダメンタルズの見通し:
AIエージェントと分散型AIは、引き続き有望な分野です。AI関連の暗号資産プロジェクトが市場の勢いを取り戻せば、FETにも恩恵が及ぶ可能性があります。
私の見解:
FETには売られ過ぎの兆候が見られますが、反転が確認されるにはまだ時間が必要です。エントリー前に、出来高とBTCの方向性を確認しましょう。
🎯 賢く取引し、リスクを管理しましょう。急騰に飛び乗るのは禁物です!
#FET #ASI #FetchAI #AI
$FET は重要なテクニカルゾーンに近づいており、次の値動きが短期的な方向性を決める可能性があります。
📊 注目すべき重要な価格帯:
🟢 サポート:$0.140 / $0.133 / $0.119
🔴 レジスタンス:$0.151 / $0.157 / $0.165
📈 強気シナリオ:
$0.151を力強く上抜ければ、$0.157、さらに$0.165を目指す展開が期待できます。
📉 弱気シナリオ:
$0.140を割り込むと、$0.133、さらには$0.119まで下落する可能性があります。
ファンダメンタルズの見通し:
AIエージェントと分散型AIは、引き続き有望な分野です。AI関連の暗号資産プロジェクトが市場の勢いを取り戻せば、FETにも恩恵が及ぶ可能性があります。
私の見解:
FETには売られ過ぎの兆候が見られますが、反転が確認されるにはまだ時間が必要です。エントリー前に、出来高とBTCの方向性を確認しましょう。
🎯 賢く取引し、リスクを管理しましょう。急騰に飛び乗るのは禁物です!
#FET #ASI #FetchAI #AI
496
·
--
AIエージェントに対する私の本音の立場 - AMA版
これは単なる hype ではなく、私の本音です。
私の立場:$FET を少量保有しています。$VIRTUALを注意深く見ています。
なぜ$FETなのか? $FET は単なるミームコインではなく、実際のAIインフラを構築しているからです。昨日$VIRTUALは急騰しましたが、$FET はまだサポートライン上にあり、長期的にはより強そうです。
AMAでの質問:来月、FETのようなAIエージェントについて、Binanceはどのような見解を持っていますか? 次の上昇相場をAIコインが主導するでしょうか?
皆さんの立場はどうですか? FETまたは$VIRTUALを保有していますか?
{future}(FETUSDT)
#FET #VIRTUAL #BinanceAMA #AIAgents #BinanceSquare
AIエージェントに対する私の本音の立場 - AMA版
これは単なる hype ではなく、私の本音です。
私の立場:$FET を少量保有しています。$VIRTUALを注意深く見ています。
なぜ$FET なのか? $FET は単なるミームコインではなく、実際のAIインフラを構築しているからです。昨日$VIRTUALは急騰しましたが、$FET はまだサポートライン上にあり、長期的にはより強そうです。
AMAでの質問:来月、FETのようなAIエージェントについて、Binanceはどのような見解を持っていますか? 次の上昇相場をAIコインが主導するでしょうか?
皆さんの立場はどうですか? FETまたは$VIRTUALを保有していますか?
#FET #VIRTUAL #BinanceAMA #AIAgents #BinanceSquare
これは単なる hype ではなく、私の本音です。
私の立場:$FET を少量保有しています。$VIRTUALを注意深く見ています。
なぜ$FET なのか? $FET は単なるミームコインではなく、実際のAIインフラを構築しているからです。昨日$VIRTUALは急騰しましたが、$FET はまだサポートライン上にあり、長期的にはより強そうです。
AMAでの質問:来月、FETのようなAIエージェントについて、Binanceはどのような見解を持っていますか? 次の上昇相場をAIコインが主導するでしょうか?
皆さんの立場はどうですか? FETまたは$VIRTUALを保有していますか?
#FET #VIRTUAL #BinanceAMA #AIAgents #BinanceSquare

1
1k

·
--
ブリッシュ
#FET
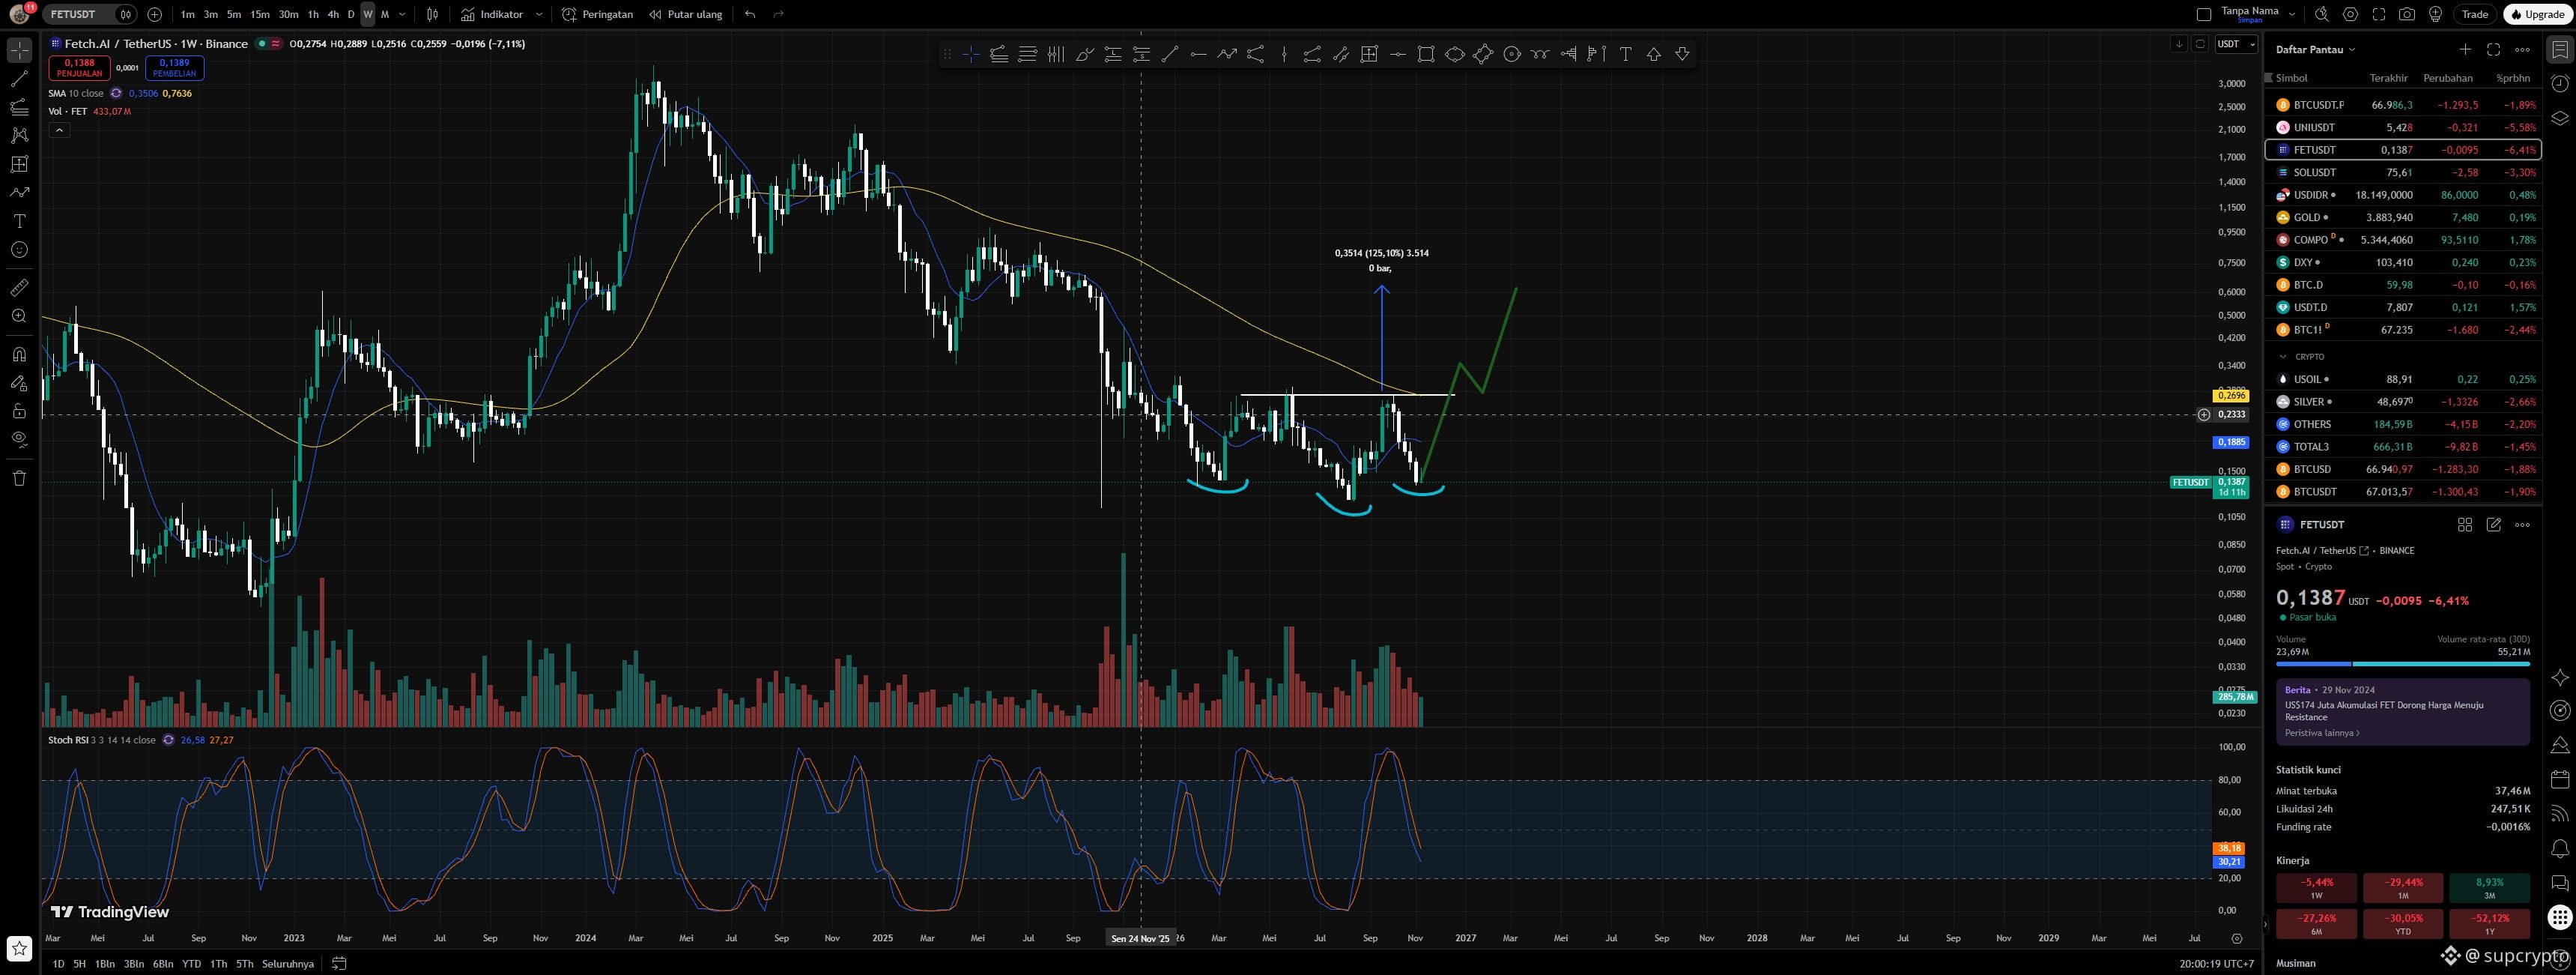
FETのチャートを見てみましょう
FETは1Wの時間足で逆三尊を形成する可能性があります
このコインにお金を賭けてみるのも悪くありません 😇😇
目標価格は0.6ドル
この投稿が役に立ったら
フォローしてください
#FET
FETのチャートを見てみましょう
FETは1Wの時間足で逆三尊を形成する可能性があります
このコインにお金を賭けてみるのも悪くありません 😇😇
目標価格は0.6ドル
この投稿が役に立ったら
フォローしてください
FETのチャートを見てみましょう
FETは1Wの時間足で逆三尊を形成する可能性があります
このコインにお金を賭けてみるのも悪くありません 😇😇
目標価格は0.6ドル
この投稿が役に立ったら
フォローしてください
431


翻訳参照
🚨 $FET LEANING INTO THE MASSIVE INSTITUTIONAL LIQUIDITY SURROUNDING THE AI SECTOR INFLOWS! 🦈
Institutional capital is aggressively chasing AI infrastructure, evidenced by massive multi-billion order flows and strategic backing from major industry heavyweights. 📊 Rather than chasing the late-stage retail FOMO at market open, sophisticated order flow analysis dictates waiting for initial euphoria distribution to clear. 🌊
Smart money positioning requires patience around premium liquidity zones rather than buying into overextended distribution phases. 💡 Are you waiting for the secondary retest or hunting for value across high-beta AI assets? 👇
⚠️ Not financial advice. Always manage your risk. 🛡️
🏷️ #FET #AI #SmartMoney #Liquidity #Crypto
🔥 💎
🚨 $FET LEANING INTO THE MASSIVE INSTITUTIONAL LIQUIDITY SURROUNDING THE AI SECTOR INFLOWS! 🦈
Institutional capital is aggressively chasing AI infrastructure, evidenced by massive multi-billion order flows and strategic backing from major industry heavyweights. 📊 Rather than chasing the late-stage retail FOMO at market open, sophisticated order flow analysis dictates waiting for initial euphoria distribution to clear. 🌊
Smart money positioning requires patience around premium liquidity zones rather than buying into overextended distribution phases. 💡 Are you waiting for the secondary retest or hunting for value across high-beta AI assets? 👇
⚠️ Not financial advice. Always manage your risk. 🛡️
🏷️ #FET #AI #SmartMoney #Liquidity #Crypto
🔥 💎
Institutional capital is aggressively chasing AI infrastructure, evidenced by massive multi-billion order flows and strategic backing from major industry heavyweights. 📊 Rather than chasing the late-stage retail FOMO at market open, sophisticated order flow analysis dictates waiting for initial euphoria distribution to clear. 🌊
Smart money positioning requires patience around premium liquidity zones rather than buying into overextended distribution phases. 💡 Are you waiting for the secondary retest or hunting for value across high-beta AI assets? 👇
⚠️ Not financial advice. Always manage your risk. 🛡️
🏷️ #FET #AI #SmartMoney #Liquidity #Crypto
🔥 💎
21


·
--
翻訳参照
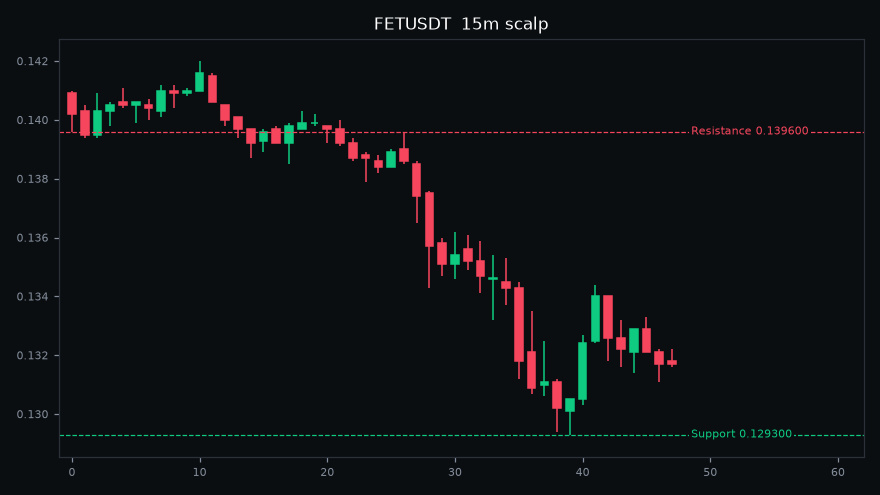
$FET #FET SHORT setup, Fetch.ai is the weakest AI coin today, down almost 9 percent. 📉
Direction: SHORT
Entry zone: 0.133 to 0.137
Stop loss: 0.141
Target 1: 0.130
Target 2: 0.126
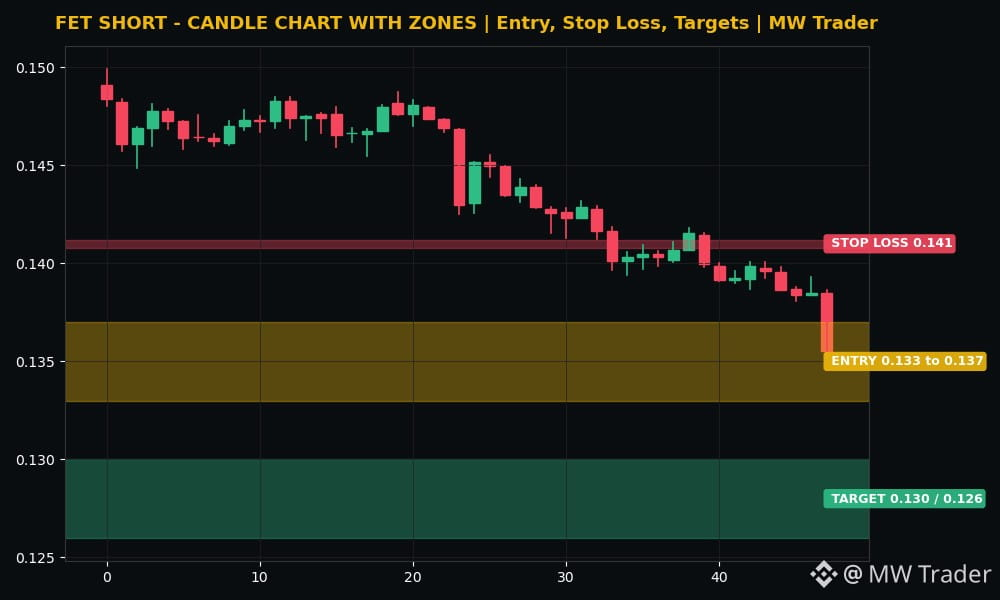
CoinGecko data checked at 20:00 PKT puts Fetch.ai near 0.1352 dollars, down 8.82 percent in 24 hours, with the 24 hour range from 0.1353 to 0.1499 dollars and the last 30 minute close at 0.1355. 🔴 The chart shows real candles with the entry zone, stop loss line and target zones marked, and FET fell harder than Bitcoin again, which is the pattern of an AI coin with no buyers in a fear market, so the short stays valid while price holds under 0.141. Futures trading is risky, trade small, manage risk, do your own research.
Does Fetch.ai hold 0.135 dollars here, or slide to 0.126 first? 🤔
Follow for more trades.
#FetchAI #Crypto #FuturesTrading #TradingSignals
$FET #FET SHORT setup, Fetch.ai is the weakest AI coin today, down almost 9 percent. 📉
Direction: SHORT
Entry zone: 0.133 to 0.137
Stop loss: 0.141
Target 1: 0.130
Target 2: 0.126
CoinGecko data checked at 20:00 PKT puts Fetch.ai near 0.1352 dollars, down 8.82 percent in 24 hours, with the 24 hour range from 0.1353 to 0.1499 dollars and the last 30 minute close at 0.1355. 🔴 The chart shows real candles with the entry zone, stop loss line and target zones marked, and FET fell harder than Bitcoin again, which is the pattern of an AI coin with no buyers in a fear market, so the short stays valid while price holds under 0.141. Futures trading is risky, trade small, manage risk, do your own research.
Does Fetch.ai hold 0.135 dollars here, or slide to 0.126 first? 🤔
Follow for more trades.
#FetchAI #Crypto #FuturesTrading #TradingSignals
Direction: SHORT
Entry zone: 0.133 to 0.137
Stop loss: 0.141
Target 1: 0.130
Target 2: 0.126
CoinGecko data checked at 20:00 PKT puts Fetch.ai near 0.1352 dollars, down 8.82 percent in 24 hours, with the 24 hour range from 0.1353 to 0.1499 dollars and the last 30 minute close at 0.1355. 🔴 The chart shows real candles with the entry zone, stop loss line and target zones marked, and FET fell harder than Bitcoin again, which is the pattern of an AI coin with no buyers in a fear market, so the short stays valid while price holds under 0.141. Futures trading is risky, trade small, manage risk, do your own research.
Does Fetch.ai hold 0.135 dollars here, or slide to 0.126 first? 🤔
Follow for more trades.
#FetchAI #Crypto #FuturesTrading #TradingSignals
15



·
--
📌 データポイント:$FET 24h 取引高867万米ドル、24時間で-4.6%。
背景:検索ランキングで話題の「AI代理購入は節約になって手間も省ける?」(AI関連銘柄)。
話題性が実際の買いにつながったかを判断する最も簡単な方法は、話題になる前後の取引高を比較すること。2倍になって初めて効果があったと言える。
#FET
📌 データポイント:$FET 24h 取引高867万米ドル、24時間で-4.6%。
背景:検索ランキングで話題の「AI代理購入は節約になって手間も省ける?」(AI関連銘柄)。
話題性が実際の買いにつながったかを判断する最も簡単な方法は、話題になる前後の取引高を比較すること。2倍になって初めて効果があったと言える。
#FET
背景:検索ランキングで話題の「AI代理購入は節約になって手間も省ける?」(AI関連銘柄)。
話題性が実際の買いにつながったかを判断する最も簡単な方法は、話題になる前後の取引高を比較すること。2倍になって初めて効果があったと言える。
#FET
95


翻訳参照
$FET: Why Admitting When Data Is Unavailable Is a Sign of Analytical Integrity
The token $FET is currently trading inside its recorded range while hourly direction points down and volume sits above baseline. How should analysts treat a setup when key feeds such as open interest or funding rates are missing?
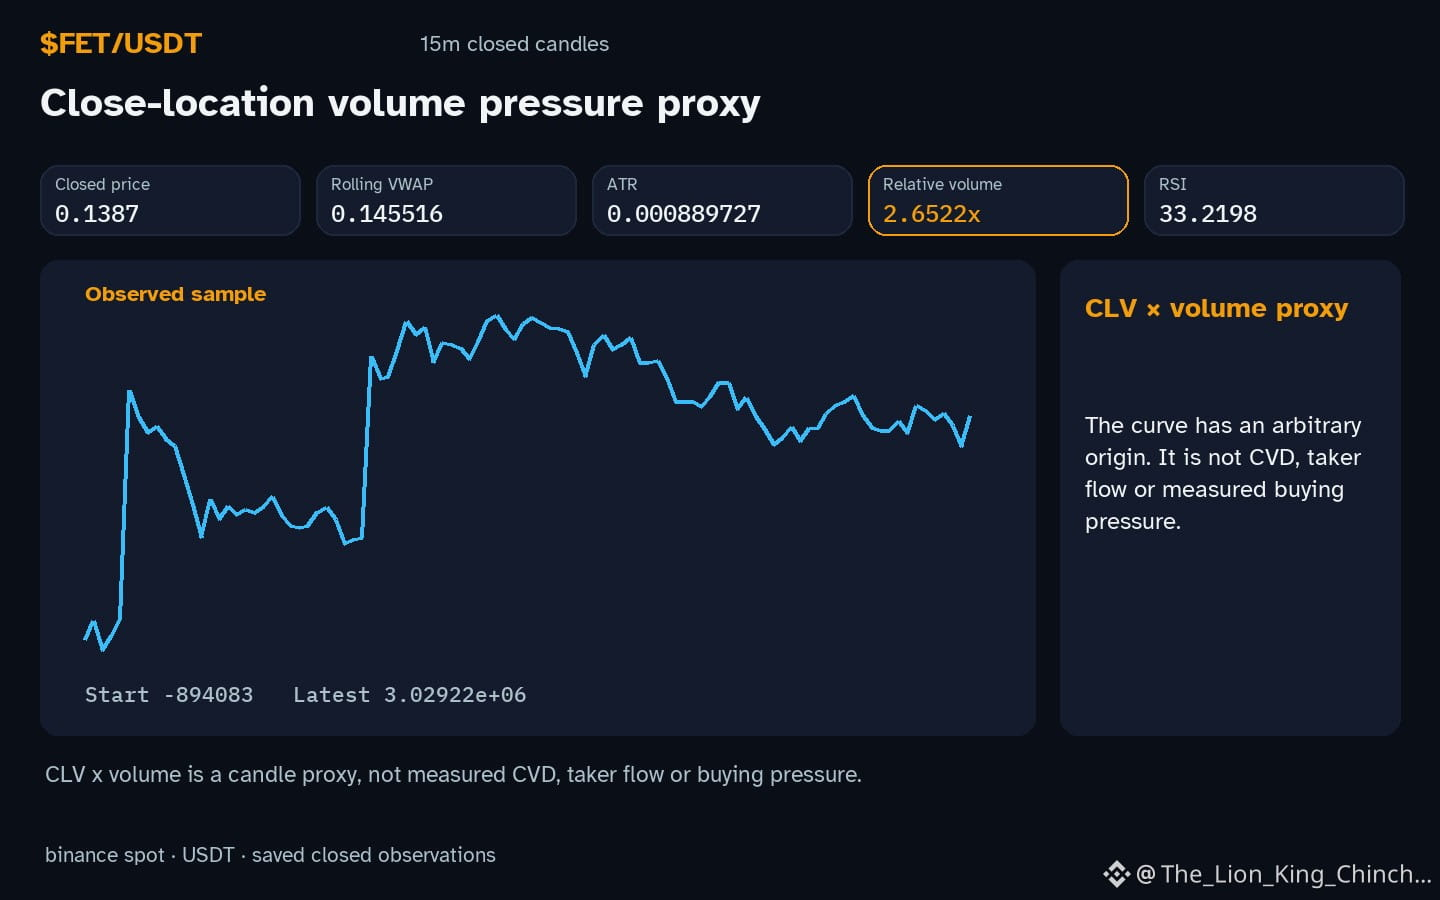
One observation shows a modest hourly decline of -0.857756% and a relative volume of 2.65x baseline. Some readers might infer that the lack of on‑chain or funding data weakens confidence in any directional claim. A counter‑scenario suggests that the same price action could be interpreted as a neutral pause, because the RSI 33.2 remains in a mid‑range zone and no clear breakout pattern emerges.
The mechanism to test these competing views is simple: note the missing feed, then deliberately refrain from assigning certainty to any outcome. Instead, record the observable metrics – price change, relative volume, and RSI – and wait for the next closed candle. If the subsequent hourly candle closes with a larger move beyond the current support or resistance levels, the earlier uncertainty may be resolved. Conversely, if price remains within the range and volume returns to baseline, the initial hesitation gains support.
A practical self‑check is to write down the current observation, label the unavailable data, and set a reminder to revisit the chart after the next hourly close. This disciplined pause helps separate what is known from what is assumed, encouraging honest analysis without over‑promising outcomes.
Probabilistic market research, not a recommendation or guaranteed return.
#FET #CryptoCommunity
$FET : Why Admitting When Data Is Unavailable Is a Sign of Analytical Integrity
The token $FET is currently trading inside its recorded range while hourly direction points down and volume sits above baseline. How should analysts treat a setup when key feeds such as open interest or funding rates are missing?
One observation shows a modest hourly decline of -0.857756% and a relative volume of 2.65x baseline. Some readers might infer that the lack of on‑chain or funding data weakens confidence in any directional claim. A counter‑scenario suggests that the same price action could be interpreted as a neutral pause, because the RSI 33.2 remains in a mid‑range zone and no clear breakout pattern emerges.
The mechanism to test these competing views is simple: note the missing feed, then deliberately refrain from assigning certainty to any outcome. Instead, record the observable metrics – price change, relative volume, and RSI – and wait for the next closed candle. If the subsequent hourly candle closes with a larger move beyond the current support or resistance levels, the earlier uncertainty may be resolved. Conversely, if price remains within the range and volume returns to baseline, the initial hesitation gains support.
A practical self‑check is to write down the current observation, label the unavailable data, and set a reminder to revisit the chart after the next hourly close. This disciplined pause helps separate what is known from what is assumed, encouraging honest analysis without over‑promising outcomes.
Probabilistic market research, not a recommendation or guaranteed return.
#FET #CryptoCommunity
The token $FET is currently trading inside its recorded range while hourly direction points down and volume sits above baseline. How should analysts treat a setup when key feeds such as open interest or funding rates are missing?
One observation shows a modest hourly decline of -0.857756% and a relative volume of 2.65x baseline. Some readers might infer that the lack of on‑chain or funding data weakens confidence in any directional claim. A counter‑scenario suggests that the same price action could be interpreted as a neutral pause, because the RSI 33.2 remains in a mid‑range zone and no clear breakout pattern emerges.
The mechanism to test these competing views is simple: note the missing feed, then deliberately refrain from assigning certainty to any outcome. Instead, record the observable metrics – price change, relative volume, and RSI – and wait for the next closed candle. If the subsequent hourly candle closes with a larger move beyond the current support or resistance levels, the earlier uncertainty may be resolved. Conversely, if price remains within the range and volume returns to baseline, the initial hesitation gains support.
A practical self‑check is to write down the current observation, label the unavailable data, and set a reminder to revisit the chart after the next hourly close. This disciplined pause helps separate what is known from what is assumed, encouraging honest analysis without over‑promising outcomes.
Probabilistic market research, not a recommendation or guaranteed return.
#FET #CryptoCommunity
24

「AI配信者が溢れかえる 午前1時以降、3分で4件を配信」がトレンド入りし、AI関連銘柄の$FET 24hの売買代金は921万ドル。
ネット上で誰もが話題にしているときは、熱気が最高潮に達していることもあります。少し冷静になるのも悪くありません。私がより気にしているのは大口投資家のアドレスの動きです。口で言うことより、実際の行動のほうが確かです。
#FET
「AI配信者が溢れかえる 午前1時以降、3分で4件を配信」がトレンド入りし、AI関連銘柄の$FET 24hの売買代金は921万ドル。
ネット上で誰もが話題にしているときは、熱気が最高潮に達していることもあります。少し冷静になるのも悪くありません。私がより気にしているのは大口投資家のアドレスの動きです。口で言うことより、実際の行動のほうが確かです。
#FET
ネット上で誰もが話題にしているときは、熱気が最高潮に達していることもあります。少し冷静になるのも悪くありません。私がより気にしているのは大口投資家のアドレスの動きです。口で言うことより、実際の行動のほうが確かです。
#FET
51

·
--
「AI配信者があふれ、午前1時以降の3分間に4件配信」が検索ランキング入り(ランキング6位)。AI関連銘柄の$FET も再び注目された。
話題が暗号資産の価格に波及するには、3つの段階を経る必要がある。
①議論:コミュニティで議論が始まるか。
②取引:取引額も増加するか。
③継続:話題が1~2日持続するか。
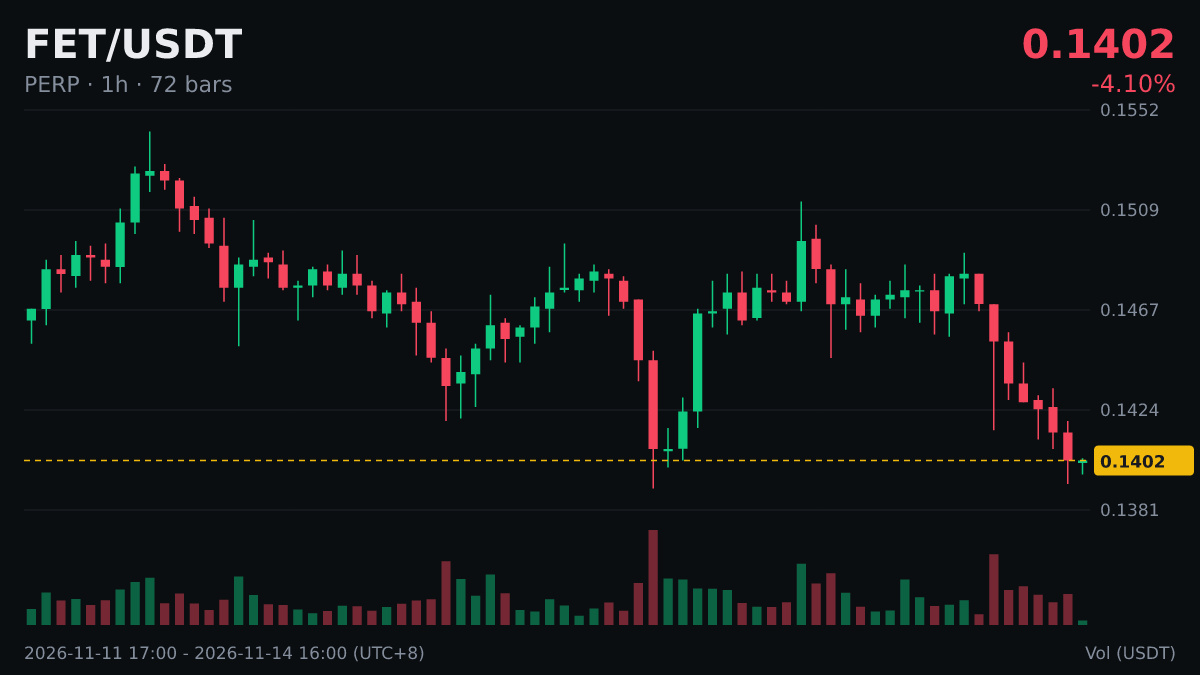
$FET の現在価格は0.1403、24時間で-4.69%。3つの段階をすべてクリアして初めて、有効な波及と言える。最初の段階までしか進まない話題は、たいてい一時的なもので終わる。
話題は盛り上がるのも早いが、冷めるのも早い。ポジションは適切に管理しよう。
#FET
これらを売買シグナルと見なさないでください。
「AI配信者があふれ、午前1時以降の3分間に4件配信」が検索ランキング入り(ランキング6位)。AI関連銘柄の$FET も再び注目された。
話題が暗号資産の価格に波及するには、3つの段階を経る必要がある。
①議論:コミュニティで議論が始まるか。
②取引:取引額も増加するか。
③継続:話題が1~2日持続するか。
$FET の現在価格は0.1403、24時間で-4.69%。3つの段階をすべてクリアして初めて、有効な波及と言える。最初の段階までしか進まない話題は、たいてい一時的なもので終わる。
話題は盛り上がるのも早いが、冷めるのも早い。ポジションは適切に管理しよう。
#FET
これらを売買シグナルと見なさないでください。
話題が暗号資産の価格に波及するには、3つの段階を経る必要がある。
①議論:コミュニティで議論が始まるか。
②取引:取引額も増加するか。
③継続:話題が1~2日持続するか。
$FET の現在価格は0.1403、24時間で-4.69%。3つの段階をすべてクリアして初めて、有効な波及と言える。最初の段階までしか進まない話題は、たいてい一時的なもので終わる。
話題は盛り上がるのも早いが、冷めるのも早い。ポジションは適切に管理しよう。
#FET
これらを売買シグナルと見なさないでください。
57

·
--
記事
翻訳参照
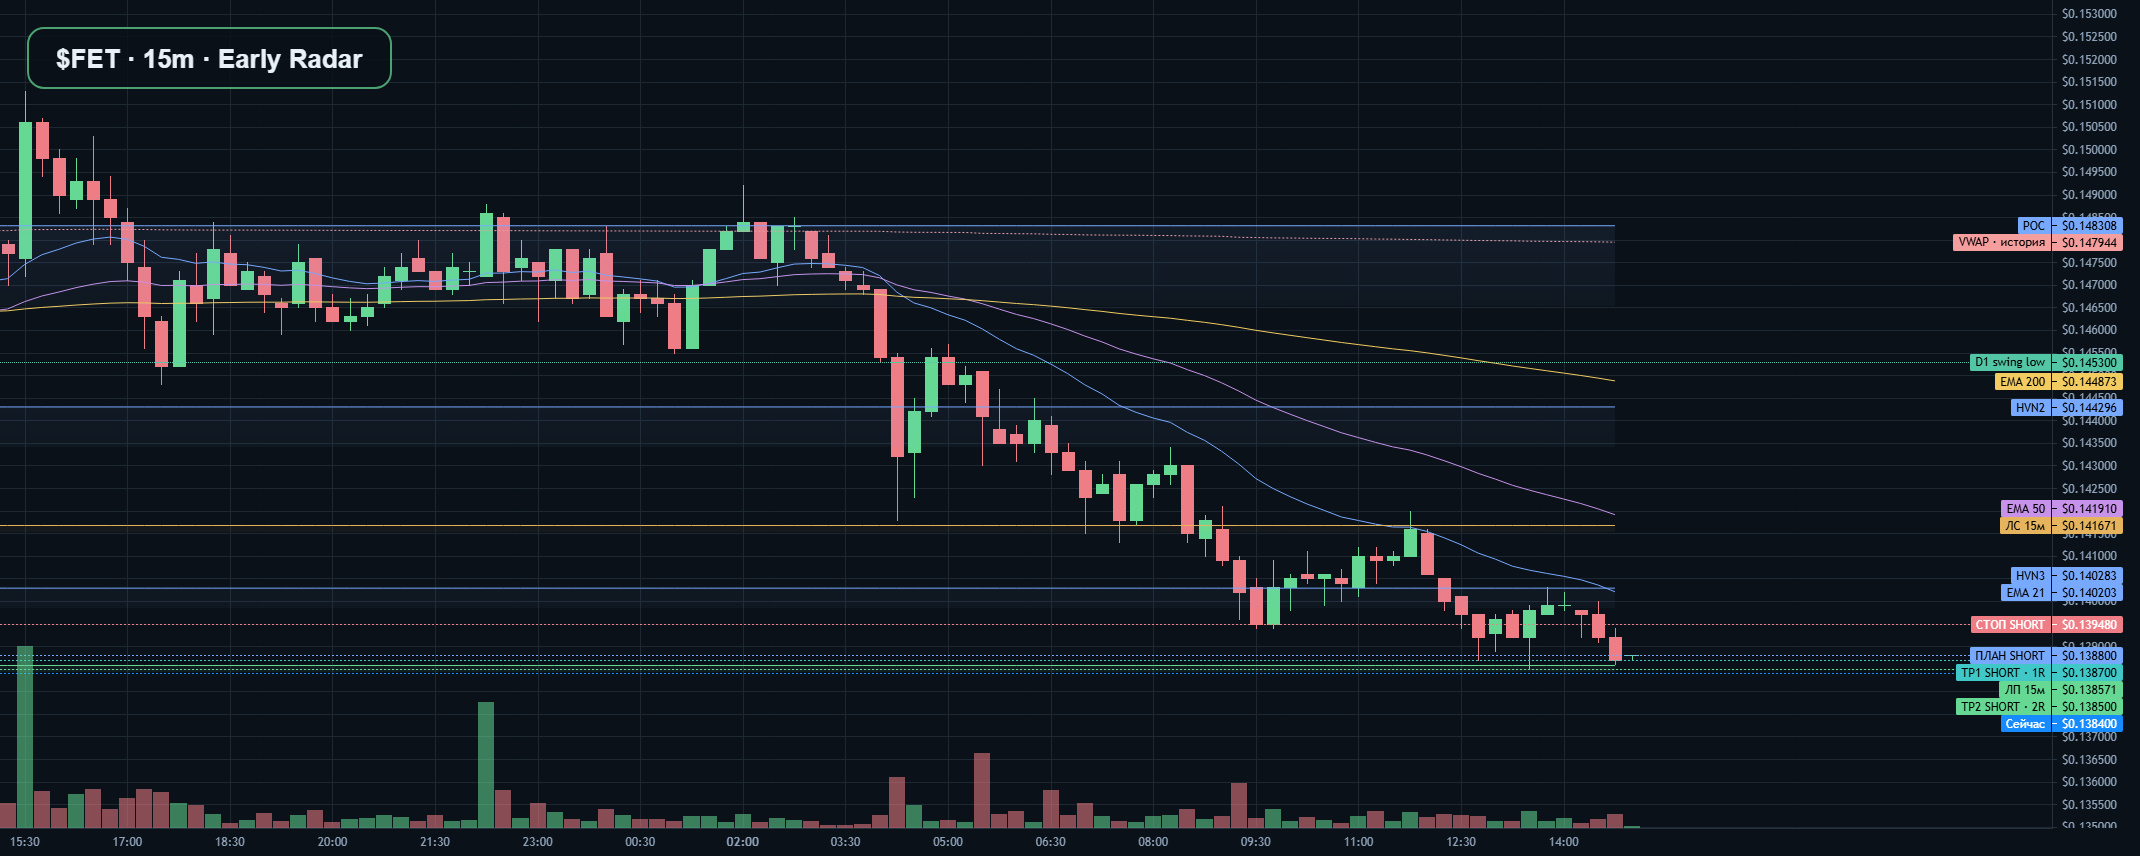
FET · Early Radar⚡ $FET · Достигнута цель сценария SHORT.
закрытие 0.1382 / уровень 0.1388 · объём 4.43× / ориентир 1.25×
📉 SHORT · $FET (FET/USDT) · сценарий снижения · контекст 15m, индикаторы 15m, триггер 5m
📍 Сценарий: план построен от текущей цены; ждём новую закрытую 5m-свечу ниже входа.
📊 РЫНОК
💵 Цена: $0.1384 · 1ч -1.43% · 24ч -6.11%.
💧 За 1ч: объём $208,274.263 · сделок 1 041.
📊 Активность M5: объём $56,070.6613 · сделок 245 · Score активности 80/100.
📚 Стакан ±1%: глубина $375,646.7659 · спред 0.07%.
🛡️ ПРОВЕРКА ДАННЫХ И ТИП РЫНКА
✅ Аудит данных: пройден · 5m пройдена · 15m пройдена.
✅ Качество рынка: пройдена.
🛡️ Оценка риска: BLOCKED · обязательные проверки не пройдены · контекст свечей, объёма и уровня не согласован; цена у поддержки ❗
🏷️ Контекст: Spot · аналитическая гипотеза о возможной продаже актива, который уже есть в Spot-портфеле; короткая позиция не открывается.
🧭 ТЕХНИЧЕСКАЯ КАРТИНА
🧭 Состояние триггера: вход пересчитан от текущей цены; ожидается новая закрытая 5m-свеча ниже этого уровня.
📍 Историческая Premium-зона не определяет вход; уровни взяты от текущего рынка.
🔎 Проверка триггера:
🔵 Текущий вход: $0.1388.
🕯️ Новое закрытие 5m ниже входа: ожидается ❗
💰 Последнее закрытие: $0.1382.
🕯️ Свечной контекст 5m: ⚠️ Нет подходящей медвежьей зоны для свечной проверки · причина: · Нет подтверждённой зоны этого направления. ❗
📉 SHORT-контекст: цена ниже EMA50 и VWAP (15m).
📐 Цена ниже EMA 21 выбранного контекста.
📊 Индикаторы выбранного контекста:
〽️ EMA 21: $0.14020335 · цена ниже
〽️ EMA 50: $0.14190953 · цена ниже
〽️ EMA 200: $0.14486497 · цена ниже
⚖️ VWAP: $0.14540647 · цена ниже
🌡️ RSI 14: 33.2
🧱 СТРУКТУРА И PD ARRAY
🗓️ Старший фильтр 1D: медвежья структура · поддерживает short-контекст · крупные swing-уровни: поддержка $0.1453 · сопротивление $0.1539. Старший контекст справочный; текущий план строится от цены, ATR и закрытых уровней.
📐 Dealing Range 24ч: $0.1385–$0.1513 · EQ $0.1449 · цена в Discount · источник: закрытые 15m-свечи за 24ч.
🧱 Проверенные OB/BB/PD Array в нужной половине диапазона не найдены ❗
💎 Premium/Discount остаются контекстом; текущий SHORT-план рассчитывается независимо от исторической Premium-зоны. ❗
🧭 Пилотная Fibonacci-модель SHORT · 15m: последний подтверждённый импульс направлен в другую сторону.
🧪 Это отдельная наблюдательная модель; статистически подтверждённая вероятность пока не рассчитана.
🎯 ПЛАН НАБЛЮДЕНИЯ
🔻 Вход SHORT: текущая цена $0.1388; для подтверждения нужно закрытие 5m ниже · ждём подтверждение.
🛑 Стоп/отмена SHORT: закрытие 5m выше $0.13948036.
🎯 TP1 SHORT · 1R: $0.1387.
🏁 TP2 SHORT · 2R: $0.1385.
📍 SHORT-план пересчитан от текущей цены; историческая Premium-зона остаётся только контекстом, не обязательным ретестом.
🛑 Стоп рассчитан по ATR14 5m: 1.61 ATR · higher timeframe resistance PLUS ATR BUFFER.
🧪 СТАТИСТИКА
📈 Подтверждённые импульсы вниз за 24ч: 2 импульса.
🎲 Вероятность: численный процент не рассчитан — исходы ретестов ещё не накоплены и не проверены ❗
⚠️ Аналитический черновик, не торговая рекомендация и не команда на сделку. Сверьте уровни с графиком и учитывайте собственный риск ❗
#FET #CryptoAnalysis #Earlyradar #BinanceSquare #UnrecognizedTag
FET · Early Radar
⚡ $FET · Достигнута цель сценария SHORT.
закрытие 0.1382 / уровень 0.1388 · объём 4.43× / ориентир 1.25×
📉 SHORT · $FET (FET/USDT) · сценарий снижения · контекст 15m, индикаторы 15m, триггер 5m
📍 Сценарий: план построен от текущей цены; ждём новую закрытую 5m-свечу ниже входа.
📊 РЫНОК
💵 Цена: $0.1384 · 1ч -1.43% · 24ч -6.11%.
💧 За 1ч: объём $208,274.263 · сделок 1 041.
📊 Активность M5: объём $56,070.6613 · сделок 245 · Score активности 80/100.
📚 Стакан ±1%: глубина $375,646.7659 · спред 0.07%.
🛡️ ПРОВЕРКА ДАННЫХ И ТИП РЫНКА
✅ Аудит данных: пройден · 5m пройдена · 15m пройдена.
✅ Качество рынка: пройдена.
🛡️ Оценка риска: BLOCKED · обязательные проверки не пройдены · контекст свечей, объёма и уровня не согласован; цена у поддержки ❗
🏷️ Контекст: Spot · аналитическая гипотеза о возможной продаже актива, который уже есть в Spot-портфеле; короткая позиция не открывается.
🧭 ТЕХНИЧЕСКАЯ КАРТИНА
🧭 Состояние триггера: вход пересчитан от текущей цены; ожидается новая закрытая 5m-свеча ниже этого уровня.
📍 Историческая Premium-зона не определяет вход; уровни взяты от текущего рынка.
🔎 Проверка триггера:
🔵 Текущий вход: $0.1388.
🕯️ Новое закрытие 5m ниже входа: ожидается ❗
💰 Последнее закрытие: $0.1382.
🕯️ Свечной контекст 5m: ⚠️ Нет подходящей медвежьей зоны для свечной проверки · причина: · Нет подтверждённой зоны этого направления. ❗
📉 SHORT-контекст: цена ниже EMA50 и VWAP (15m).
📐 Цена ниже EMA 21 выбранного контекста.
📊 Индикаторы выбранного контекста:
〽️ EMA 21: $0.14020335 · цена ниже
〽️ EMA 50: $0.14190953 · цена ниже
〽️ EMA 200: $0.14486497 · цена ниже
⚖️ VWAP: $0.14540647 · цена ниже
🌡️ RSI 14: 33.2
🧱 СТРУКТУРА И PD ARRAY
🗓️ Старший фильтр 1D: медвежья структура · поддерживает short-контекст · крупные swing-уровни: поддержка $0.1453 · сопротивление $0.1539. Старший контекст справочный; текущий план строится от цены, ATR и закрытых уровней.
📐 Dealing Range 24ч: $0.1385–$0.1513 · EQ $0.1449 · цена в Discount · источник: закрытые 15m-свечи за 24ч.
🧱 Проверенные OB/BB/PD Array в нужной половине диапазона не найдены ❗
💎 Premium/Discount остаются контекстом; текущий SHORT-план рассчитывается независимо от исторической Premium-зоны. ❗
🧭 Пилотная Fibonacci-модель SHORT · 15m: последний подтверждённый импульс направлен в другую сторону.
🧪 Это отдельная наблюдательная модель; статистически подтверждённая вероятность пока не рассчитана.
🎯 ПЛАН НАБЛЮДЕНИЯ
🔻 Вход SHORT: текущая цена $0.1388; для подтверждения нужно закрытие 5m ниже · ждём подтверждение.
🛑 Стоп/отмена SHORT: закрытие 5m выше $0.13948036.
🎯 TP1 SHORT · 1R: $0.1387.
🏁 TP2 SHORT · 2R: $0.1385.
📍 SHORT-план пересчитан от текущей цены; историческая Premium-зона остаётся только контекстом, не обязательным ретестом.
🛑 Стоп рассчитан по ATR14 5m: 1.61 ATR · higher timeframe resistance PLUS ATR BUFFER.
🧪 СТАТИСТИКА
📈 Подтверждённые импульсы вниз за 24ч: 2 импульса.
🎲 Вероятность: численный процент не рассчитан — исходы ретестов ещё не накоплены и не проверены ❗
⚠️ Аналитический черновик, не торговая рекомендация и не команда на сделку. Сверьте уровни с графиком и учитывайте собственный риск ❗
#FET #CryptoAnalysis #Earlyradar #BinanceSquare #UnrecognizedTag
закрытие 0.1382 / уровень 0.1388 · объём 4.43× / ориентир 1.25×
📉 SHORT · $FET (FET/USDT) · сценарий снижения · контекст 15m, индикаторы 15m, триггер 5m
📍 Сценарий: план построен от текущей цены; ждём новую закрытую 5m-свечу ниже входа.
📊 РЫНОК
💵 Цена: $0.1384 · 1ч -1.43% · 24ч -6.11%.
💧 За 1ч: объём $208,274.263 · сделок 1 041.
📊 Активность M5: объём $56,070.6613 · сделок 245 · Score активности 80/100.
📚 Стакан ±1%: глубина $375,646.7659 · спред 0.07%.
🛡️ ПРОВЕРКА ДАННЫХ И ТИП РЫНКА
✅ Аудит данных: пройден · 5m пройдена · 15m пройдена.
✅ Качество рынка: пройдена.
🛡️ Оценка риска: BLOCKED · обязательные проверки не пройдены · контекст свечей, объёма и уровня не согласован; цена у поддержки ❗
🏷️ Контекст: Spot · аналитическая гипотеза о возможной продаже актива, который уже есть в Spot-портфеле; короткая позиция не открывается.
🧭 ТЕХНИЧЕСКАЯ КАРТИНА
🧭 Состояние триггера: вход пересчитан от текущей цены; ожидается новая закрытая 5m-свеча ниже этого уровня.
📍 Историческая Premium-зона не определяет вход; уровни взяты от текущего рынка.
🔎 Проверка триггера:
🔵 Текущий вход: $0.1388.
🕯️ Новое закрытие 5m ниже входа: ожидается ❗
💰 Последнее закрытие: $0.1382.
🕯️ Свечной контекст 5m: ⚠️ Нет подходящей медвежьей зоны для свечной проверки · причина: · Нет подтверждённой зоны этого направления. ❗
📉 SHORT-контекст: цена ниже EMA50 и VWAP (15m).
📐 Цена ниже EMA 21 выбранного контекста.
📊 Индикаторы выбранного контекста:
〽️ EMA 21: $0.14020335 · цена ниже
〽️ EMA 50: $0.14190953 · цена ниже
〽️ EMA 200: $0.14486497 · цена ниже
⚖️ VWAP: $0.14540647 · цена ниже
🌡️ RSI 14: 33.2
🧱 СТРУКТУРА И PD ARRAY
🗓️ Старший фильтр 1D: медвежья структура · поддерживает short-контекст · крупные swing-уровни: поддержка $0.1453 · сопротивление $0.1539. Старший контекст справочный; текущий план строится от цены, ATR и закрытых уровней.
📐 Dealing Range 24ч: $0.1385–$0.1513 · EQ $0.1449 · цена в Discount · источник: закрытые 15m-свечи за 24ч.
🧱 Проверенные OB/BB/PD Array в нужной половине диапазона не найдены ❗
💎 Premium/Discount остаются контекстом; текущий SHORT-план рассчитывается независимо от исторической Premium-зоны. ❗
🧭 Пилотная Fibonacci-модель SHORT · 15m: последний подтверждённый импульс направлен в другую сторону.
🧪 Это отдельная наблюдательная модель; статистически подтверждённая вероятность пока не рассчитана.
🎯 ПЛАН НАБЛЮДЕНИЯ
🔻 Вход SHORT: текущая цена $0.1388; для подтверждения нужно закрытие 5m ниже · ждём подтверждение.
🛑 Стоп/отмена SHORT: закрытие 5m выше $0.13948036.
🎯 TP1 SHORT · 1R: $0.1387.
🏁 TP2 SHORT · 2R: $0.1385.
📍 SHORT-план пересчитан от текущей цены; историческая Premium-зона остаётся только контекстом, не обязательным ретестом.
🛑 Стоп рассчитан по ATR14 5m: 1.61 ATR · higher timeframe resistance PLUS ATR BUFFER.
🧪 СТАТИСТИКА
📈 Подтверждённые импульсы вниз за 24ч: 2 импульса.
🎲 Вероятность: численный процент не рассчитан — исходы ретестов ещё не накоплены и не проверены ❗
⚠️ Аналитический черновик, не торговая рекомендация и не команда на сделку. Сверьте уровни с графиком и учитывайте собственный риск ❗
#FET #CryptoAnalysis #Earlyradar #BinanceSquare #UnrecognizedTag
8

·
--
ブリッシュ
翻訳参照
$FET — LONG (3x leverage)
Entry: 0.1440 – 0.1455
SL: 0.1420
TP1: 0.1470
TP2: 0.1490
TP3: 0.1510
#FET #ArtificialIntelligence #BinanceFutures
$FET
{future}(FETUSDT)
$FET — LONG (3x leverage)
Entry: 0.1440 – 0.1455
SL: 0.1420
TP1: 0.1470
TP2: 0.1490
TP3: 0.1510
#FET #ArtificialIntelligence #BinanceFutures
$FET
Entry: 0.1440 – 0.1455
SL: 0.1420
TP1: 0.1470
TP2: 0.1490
TP3: 0.1510
#FET #ArtificialIntelligence #BinanceFutures
$FET
22

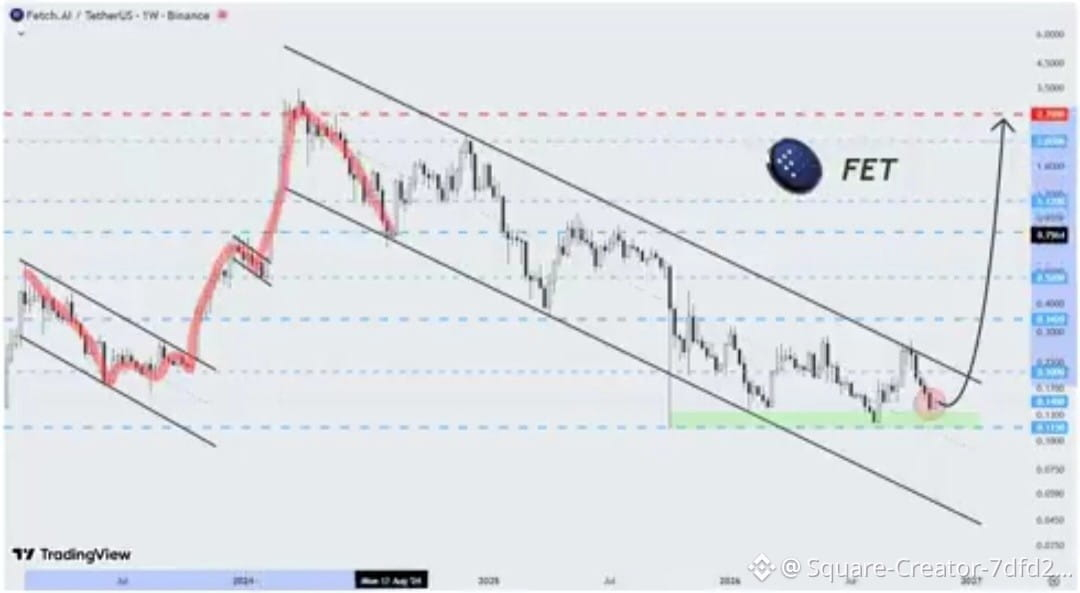
$FET チャートは弱気に見える。しかし、ネットワークは別の物語を語っている😏
Fetchの価格は、週足チャートで下降チャネルの中央線を上回る水準でサポートされています。
価格は弱気に見えるかもしれませんが、月間アクティブアドレス数6,100という数字は嘘をつきません。
ネットワークは活発で、#FET は、信頼できる情報源を探すAIシステムを使って企業が本人確認できるインフラを構築しています。
目標価格:
🎯 0.20ドル
🎯 0.52ドル
🎯 0.82ドル
🎯 1.12ドル
🎯 2.70ドル
$FET チャートは弱気に見える。しかし、ネットワークは別の物語を語っている😏
Fetchの価格は、週足チャートで下降チャネルの中央線を上回る水準でサポートされています。
価格は弱気に見えるかもしれませんが、月間アクティブアドレス数6,100という数字は嘘をつきません。
ネットワークは活発で、#FET は、信頼できる情報源を探すAIシステムを使って企業が本人確認できるインフラを構築しています。
目標価格:
🎯 0.20ドル
🎯 0.52ドル
🎯 0.82ドル
🎯 1.12ドル
🎯 2.70ドル
Fetchの価格は、週足チャートで下降チャネルの中央線を上回る水準でサポートされています。
価格は弱気に見えるかもしれませんが、月間アクティブアドレス数6,100という数字は嘘をつきません。
ネットワークは活発で、#FET は、信頼できる情報源を探すAIシステムを使って企業が本人確認できるインフラを構築しています。
目標価格:
🎯 0.20ドル
🎯 0.52ドル
🎯 0.82ドル
🎯 1.12ドル
🎯 2.70ドル
3
663

翻訳参照
FET, KAVA and XLM Market Update: Altcoin Pressure, Liquidity Shifts and the Search for Stability
The latest Binance spot data shows FET trading near $0.1398, KAVA near $0.03768, and XLM near $0.1440. All three assets are navigating a defensive altcoin environment, but their market structures are notably different. FET is attempting to stabilize after a broad AI sector correction, KAVA is facing an extraordinary volatility event with heavy selling pressure, and XLM is showing a potentially important divergence through positive capital inflow despite a bearish wider trend.
This is a market where surface level price action can be misleading. Oversold readings can signal exhaustion, but they do not automatically confirm that a recovery has begun. For a stronger market shift, price needs support from sustained volume, healthier capital flow, and improvement across momentum indicators.
Artificial Superintelligence Alliance is trading around $0.1398, down 5.67% in the latest daily session. FET moved between $0.1385 and $0.1492, and the current price is close to the session low. The token is down 4.90% over seven days and 29.04% over 30 days, showing that the broader correction remains significant.
FET’s RSI is 29.99, placing the asset near oversold territory. This indicates that selling pressure has been strong, though it should not be treated as proof of a trend reversal. FET remains below its 7 day moving average of $0.1446, 25 day moving average of $0.1611, and 99 day moving average of $0.1762. The moving average alignment remains bearish, while the SuperTrend is still pointing down.
There is one early technical improvement worth monitoring. FET’s MACD produced a golden cross two daily bars ago, suggesting that bearish momentum may be easing. However, the MACD signal alone is not enough to establish a durable recovery while price remains below key moving averages. Current volume is only 0.47 times the 7 day average, which shows that buyers have not yet returned with broad conviction. Daily capital flow is marginally negative, with an outflow rate of 0.11%.
FET remains tied to the AI infrastructure narrative, which can attract rapid attention when broader risk appetite improves. Yet the current data suggests that the market is still in a rebuilding phase. Any improvement in sentiment would need to be supported by stronger participation, reduced selling, and price stability rather than a brief rebound.
Kava is trading near $0.03768 after a severe intraday decline. The latest session opened around $0.06781 and reached a high near $0.06874 before falling to $0.03736. This represents a 44.48% daily decline based on the latest daily candle, making KAVA the clear outlier in this comparison.
KAVA is down 44.31% over seven days and 45.64% over 30 days. Its RSI has dropped to 3.96, an extremely oversold reading that reflects the scale of the selloff. Such a low RSI highlights extreme downside momentum, but it does not establish that the market has found a stable floor. Sharp moves can remain volatile, especially when liquidity and sentiment are under stress.
The technical structure is clearly bearish. KAVA is below its 7 day moving average of $0.06381, 25 day moving average of $0.06767, and 99 day moving average of $0.06079. The MACD remains bearish after a death cross, while the SuperTrend is down. Capital flow is also negative, with a 4.04% daily outflow rate.
The most notable feature is volume. KAVA volume is 5.41 times its 7 day average, confirming that the decline is being accompanied by unusually high market participation. Elevated volume can indicate liquidation, panic selling, or a major repricing event. For that reason, the market needs time to establish whether activity begins shifting from forced selling toward balanced two way trading. Kava remains connected to Layer 1 and DeFi activity, but the immediate focus is liquidity behavior and whether the price can stabilize after this unusually sharp move.
Stellar is trading around $0.1440, down 1.50% in the latest daily session. XLM traded between $0.1414 and $0.1467, leaving it close to the lower half of its intraday range. It is down 6.13% over seven days and 21.14% over 30 days, confirming that the broader chart remains under pressure.
XLM’s RSI is 27.06, placing it in oversold territory. The token remains below the 7 day moving average of $0.1463, 25 day moving average of $0.1612, and 99 day moving average of $0.1818. Its MACD remains bearish following a death cross, while the SuperTrend also points down. The primary trend has therefore not yet improved.
However, XLM presents a notable capital flow divergence. It recorded a 19.06% daily net inflow rate, the strongest flow reading among these three assets. This suggests that buyers have shown visible interest while price remains near its recent range low. XLM is only 2.27% above its 7 day low, making the current zone important for sentiment. Volume is still subdued at 0.51 times the 7 day average, so sustained participation would be needed to validate the inflow signal.
FET, KAVA, and XLM show three very different forms of market stress. FET has an early MACD improvement but remains below major trend measures. KAVA is dealing with exceptionally high volatility, extreme oversold momentum, and heavy volume. XLM remains technically bearish, but positive capital inflow introduces a constructive divergence worth watching.
The next meaningful signal will be whether volume, liquidity, and capital flow begin moving in the same direction as price. Until that alignment appears, volatility remains elevated and market conditions require careful risk awareness.
#FET #Kava #Stellar #CryptoMarket #Altcoins
$FET
{spot}(FETUSDT)
$KAVA
{spot}(KAVAUSDT)
$XLM
{spot}(XLMUSDT)
FET, KAVA and XLM Market Update: Altcoin Pressure, Liquidity Shifts and the Search for Stability
The latest Binance spot data shows FET trading near $0.1398, KAVA near $0.03768, and XLM near $0.1440. All three assets are navigating a defensive altcoin environment, but their market structures are notably different. FET is attempting to stabilize after a broad AI sector correction, KAVA is facing an extraordinary volatility event with heavy selling pressure, and XLM is showing a potentially important divergence through positive capital inflow despite a bearish wider trend.
This is a market where surface level price action can be misleading. Oversold readings can signal exhaustion, but they do not automatically confirm that a recovery has begun. For a stronger market shift, price needs support from sustained volume, healthier capital flow, and improvement across momentum indicators.
Artificial Superintelligence Alliance is trading around $0.1398, down 5.67% in the latest daily session. FET moved between $0.1385 and $0.1492, and the current price is close to the session low. The token is down 4.90% over seven days and 29.04% over 30 days, showing that the broader correction remains significant.
FET’s RSI is 29.99, placing the asset near oversold territory. This indicates that selling pressure has been strong, though it should not be treated as proof of a trend reversal. FET remains below its 7 day moving average of $0.1446, 25 day moving average of $0.1611, and 99 day moving average of $0.1762. The moving average alignment remains bearish, while the SuperTrend is still pointing down.
There is one early technical improvement worth monitoring. FET’s MACD produced a golden cross two daily bars ago, suggesting that bearish momentum may be easing. However, the MACD signal alone is not enough to establish a durable recovery while price remains below key moving averages. Current volume is only 0.47 times the 7 day average, which shows that buyers have not yet returned with broad conviction. Daily capital flow is marginally negative, with an outflow rate of 0.11%.
FET remains tied to the AI infrastructure narrative, which can attract rapid attention when broader risk appetite improves. Yet the current data suggests that the market is still in a rebuilding phase. Any improvement in sentiment would need to be supported by stronger participation, reduced selling, and price stability rather than a brief rebound.
Kava is trading near $0.03768 after a severe intraday decline. The latest session opened around $0.06781 and reached a high near $0.06874 before falling to $0.03736. This represents a 44.48% daily decline based on the latest daily candle, making KAVA the clear outlier in this comparison.
KAVA is down 44.31% over seven days and 45.64% over 30 days. Its RSI has dropped to 3.96, an extremely oversold reading that reflects the scale of the selloff. Such a low RSI highlights extreme downside momentum, but it does not establish that the market has found a stable floor. Sharp moves can remain volatile, especially when liquidity and sentiment are under stress.
The technical structure is clearly bearish. KAVA is below its 7 day moving average of $0.06381, 25 day moving average of $0.06767, and 99 day moving average of $0.06079. The MACD remains bearish after a death cross, while the SuperTrend is down. Capital flow is also negative, with a 4.04% daily outflow rate.
The most notable feature is volume. KAVA volume is 5.41 times its 7 day average, confirming that the decline is being accompanied by unusually high market participation. Elevated volume can indicate liquidation, panic selling, or a major repricing event. For that reason, the market needs time to establish whether activity begins shifting from forced selling toward balanced two way trading. Kava remains connected to Layer 1 and DeFi activity, but the immediate focus is liquidity behavior and whether the price can stabilize after this unusually sharp move.
Stellar is trading around $0.1440, down 1.50% in the latest daily session. XLM traded between $0.1414 and $0.1467, leaving it close to the lower half of its intraday range. It is down 6.13% over seven days and 21.14% over 30 days, confirming that the broader chart remains under pressure.
XLM’s RSI is 27.06, placing it in oversold territory. The token remains below the 7 day moving average of $0.1463, 25 day moving average of $0.1612, and 99 day moving average of $0.1818. Its MACD remains bearish following a death cross, while the SuperTrend also points down. The primary trend has therefore not yet improved.
However, XLM presents a notable capital flow divergence. It recorded a 19.06% daily net inflow rate, the strongest flow reading among these three assets. This suggests that buyers have shown visible interest while price remains near its recent range low. XLM is only 2.27% above its 7 day low, making the current zone important for sentiment. Volume is still subdued at 0.51 times the 7 day average, so sustained participation would be needed to validate the inflow signal.
FET, KAVA, and XLM show three very different forms of market stress. FET has an early MACD improvement but remains below major trend measures. KAVA is dealing with exceptionally high volatility, extreme oversold momentum, and heavy volume. XLM remains technically bearish, but positive capital inflow introduces a constructive divergence worth watching.
The next meaningful signal will be whether volume, liquidity, and capital flow begin moving in the same direction as price. Until that alignment appears, volatility remains elevated and market conditions require careful risk awareness.
#FET #Kava #Stellar #CryptoMarket #Altcoins
$FET
$KAVA
$XLM
This is a market where surface level price action can be misleading. Oversold readings can signal exhaustion, but they do not automatically confirm that a recovery has begun. For a stronger market shift, price needs support from sustained volume, healthier capital flow, and improvement across momentum indicators.
Artificial Superintelligence Alliance is trading around $0.1398, down 5.67% in the latest daily session. FET moved between $0.1385 and $0.1492, and the current price is close to the session low. The token is down 4.90% over seven days and 29.04% over 30 days, showing that the broader correction remains significant.
FET’s RSI is 29.99, placing the asset near oversold territory. This indicates that selling pressure has been strong, though it should not be treated as proof of a trend reversal. FET remains below its 7 day moving average of $0.1446, 25 day moving average of $0.1611, and 99 day moving average of $0.1762. The moving average alignment remains bearish, while the SuperTrend is still pointing down.
There is one early technical improvement worth monitoring. FET’s MACD produced a golden cross two daily bars ago, suggesting that bearish momentum may be easing. However, the MACD signal alone is not enough to establish a durable recovery while price remains below key moving averages. Current volume is only 0.47 times the 7 day average, which shows that buyers have not yet returned with broad conviction. Daily capital flow is marginally negative, with an outflow rate of 0.11%.
FET remains tied to the AI infrastructure narrative, which can attract rapid attention when broader risk appetite improves. Yet the current data suggests that the market is still in a rebuilding phase. Any improvement in sentiment would need to be supported by stronger participation, reduced selling, and price stability rather than a brief rebound.
Kava is trading near $0.03768 after a severe intraday decline. The latest session opened around $0.06781 and reached a high near $0.06874 before falling to $0.03736. This represents a 44.48% daily decline based on the latest daily candle, making KAVA the clear outlier in this comparison.
KAVA is down 44.31% over seven days and 45.64% over 30 days. Its RSI has dropped to 3.96, an extremely oversold reading that reflects the scale of the selloff. Such a low RSI highlights extreme downside momentum, but it does not establish that the market has found a stable floor. Sharp moves can remain volatile, especially when liquidity and sentiment are under stress.
The technical structure is clearly bearish. KAVA is below its 7 day moving average of $0.06381, 25 day moving average of $0.06767, and 99 day moving average of $0.06079. The MACD remains bearish after a death cross, while the SuperTrend is down. Capital flow is also negative, with a 4.04% daily outflow rate.
The most notable feature is volume. KAVA volume is 5.41 times its 7 day average, confirming that the decline is being accompanied by unusually high market participation. Elevated volume can indicate liquidation, panic selling, or a major repricing event. For that reason, the market needs time to establish whether activity begins shifting from forced selling toward balanced two way trading. Kava remains connected to Layer 1 and DeFi activity, but the immediate focus is liquidity behavior and whether the price can stabilize after this unusually sharp move.
Stellar is trading around $0.1440, down 1.50% in the latest daily session. XLM traded between $0.1414 and $0.1467, leaving it close to the lower half of its intraday range. It is down 6.13% over seven days and 21.14% over 30 days, confirming that the broader chart remains under pressure.
XLM’s RSI is 27.06, placing it in oversold territory. The token remains below the 7 day moving average of $0.1463, 25 day moving average of $0.1612, and 99 day moving average of $0.1818. Its MACD remains bearish following a death cross, while the SuperTrend also points down. The primary trend has therefore not yet improved.
However, XLM presents a notable capital flow divergence. It recorded a 19.06% daily net inflow rate, the strongest flow reading among these three assets. This suggests that buyers have shown visible interest while price remains near its recent range low. XLM is only 2.27% above its 7 day low, making the current zone important for sentiment. Volume is still subdued at 0.51 times the 7 day average, so sustained participation would be needed to validate the inflow signal.
FET, KAVA, and XLM show three very different forms of market stress. FET has an early MACD improvement but remains below major trend measures. KAVA is dealing with exceptionally high volatility, extreme oversold momentum, and heavy volume. XLM remains technically bearish, but positive capital inflow introduces a constructive divergence worth watching.
The next meaningful signal will be whether volume, liquidity, and capital flow begin moving in the same direction as price. Until that alignment appears, volatility remains elevated and market conditions require careful risk awareness.
#FET #Kava #Stellar #CryptoMarket #Altcoins
$FET
$KAVA
$XLM
1
24


·
--
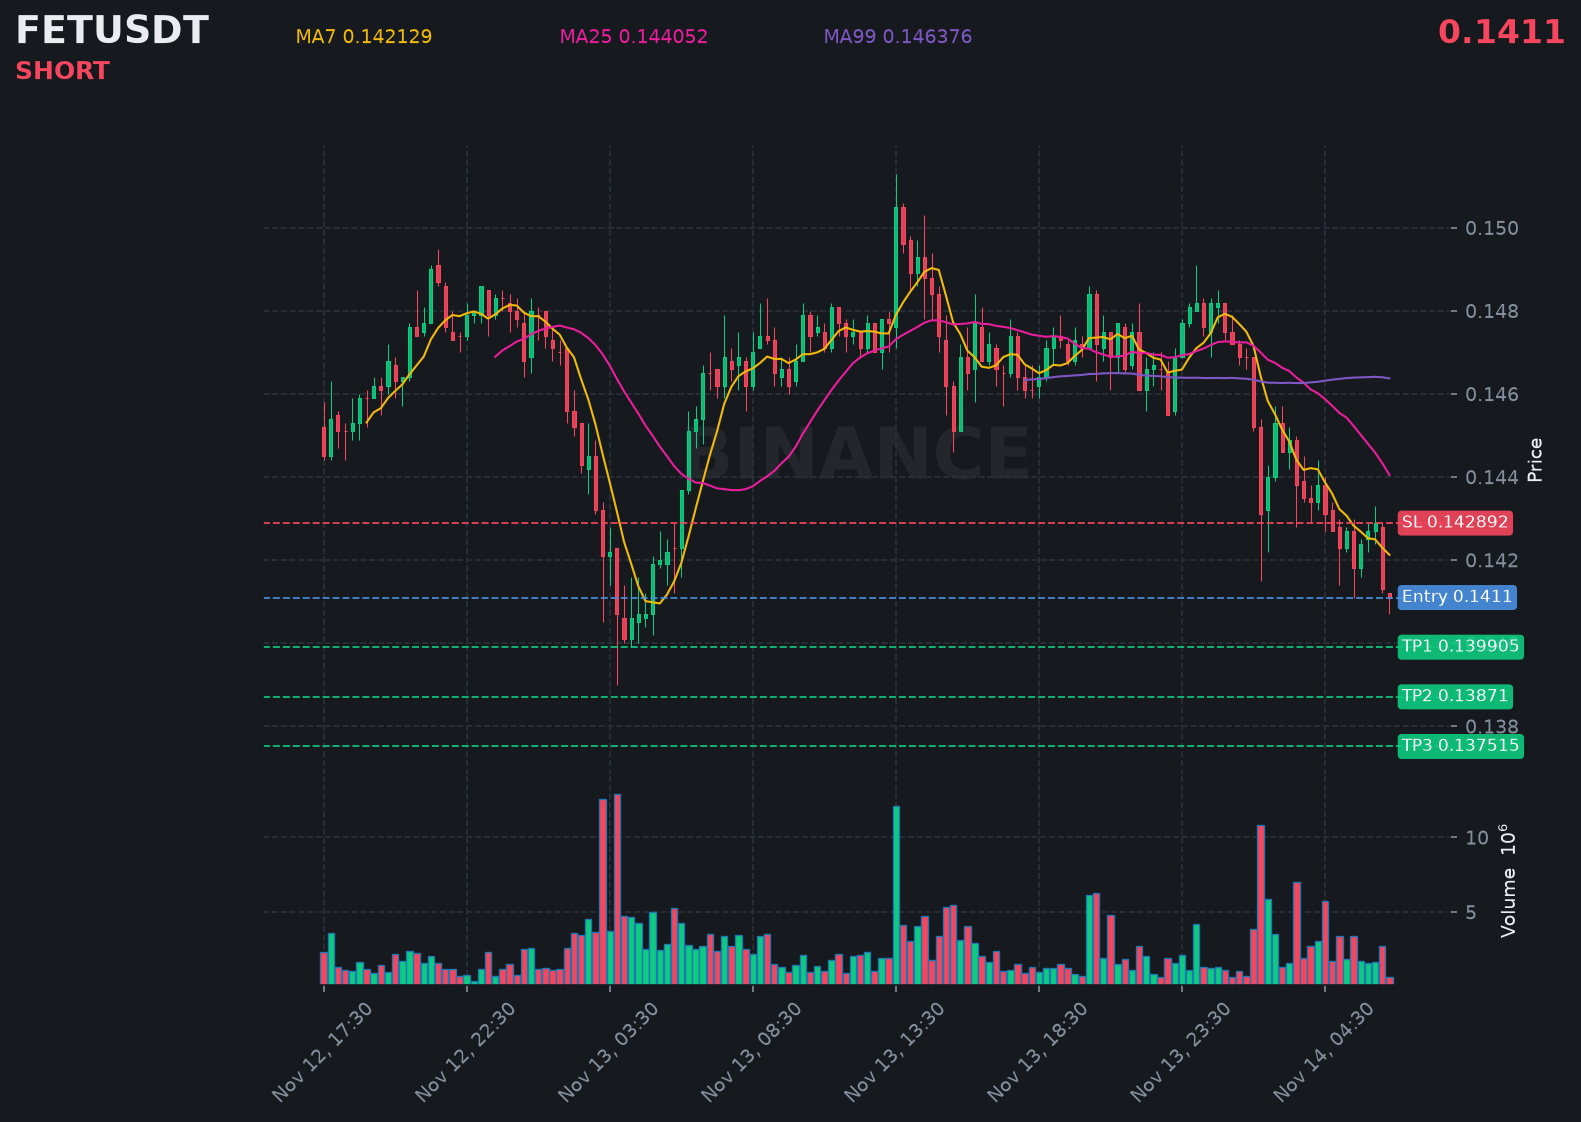
$FET がたった今、強い bearish candle を形成し、さらなる下落圧力が高まっていることを示しています。
📍 @ 0.1411 | 出来高: 0.09M USD
RSI 33 | EMA20: 0.143305 USD
📈 トレードプラン:
📈 エントリー: 0.140742 – 0.141458
🛑 損切り: 0.142892
🎯 TP1: 0.139905
🎯 TP2: 0.13871
🎯 TP3: 0.137515
確認を待ってから、下降トレンドに乗ります。
👉 $FET 👈 チャンスを逃さないで
#FET
$FET がたった今、強い bearish candle を形成し、さらなる下落圧力が高まっていることを示しています。
📍 @ 0.1411 | 出来高: 0.09M USD
RSI 33 | EMA20: 0.143305 USD
📈 トレードプラン:
📈 エントリー: 0.140742 – 0.141458
🛑 損切り: 0.142892
🎯 TP1: 0.139905
🎯 TP2: 0.13871
🎯 TP3: 0.137515
確認を待ってから、下降トレンドに乗ります。
👉 $FET 👈 チャンスを逃さないで
#FET
📍 @ 0.1411 | 出来高: 0.09M USD
RSI 33 | EMA20: 0.143305 USD
📈 トレードプラン:
📈 エントリー: 0.140742 – 0.141458
🛑 損切り: 0.142892
🎯 TP1: 0.139905
🎯 TP2: 0.13871
🎯 TP3: 0.137515
確認を待ってから、下降トレンドに乗ります。
👉 $FET 👈 チャンスを逃さないで
#FET
132

·
--
翻訳参照
「AI主播泛滥 凌晨1点后3分钟推送4个」(第 6)|AI 概念板块的 $FET ,24h 成交 866万
留意话题内容会不会变味,热点一变,关联的币也会随之回落。数据上看,同类消息之后的反应不一定一样,别套用过去。
#FET
「AI主播泛滥 凌晨1点后3分钟推送4个」(第 6)|AI 概念板块的 $FET ,24h 成交 866万
留意话题内容会不会变味,热点一变,关联的币也会随之回落。数据上看,同类消息之后的反应不一定一样,别套用过去。
#FET
留意话题内容会不会变味,热点一变,关联的币也会随之回落。数据上看,同类消息之后的反应不一定一样,别套用过去。
#FET

·
--
「今年のダブル11、商家はAIと相談しながら商売」|AI関連銘柄の$FET 、24時間の取引額は862万
検索トレンドに登場する前後の取引額を比較して、実際に押し上げ効果があったかを見てみましょう。取引量が公表されていなければ、どんなに良いニュースも話題にとどまってしまいます。
#FET
「今年のダブル11、商家はAIと相談しながら商売」|AI関連銘柄の$FET 、24時間の取引額は862万
検索トレンドに登場する前後の取引額を比較して、実際に押し上げ効果があったかを見てみましょう。取引量が公表されていなければ、どんなに良いニュースも話題にとどまってしまいます。
#FET
検索トレンドに登場する前後の取引額を比較して、実際に押し上げ効果があったかを見てみましょう。取引量が公表されていなければ、どんなに良いニュースも話題にとどまってしまいます。
#FET
150
ログインして、さらにコンテンツを読む
厳選トピックで世界の暗号資産トレーダーの仲間入り
⚡️ 暗号資産に関する最新かつ有益な情報が見つかります。
💬 世界最大の暗号資産取引所から信頼されています。
👍 認証を受けたクリエイターから、有益なインサイトを得られます。
メール / 電話番号
トレンドトピック
1
#WhoWillSucceedJensenHuangatNvidia?
閲覧回数 149,873
1,574人が討論中
2
#WhatWillDriveCryptoandStocks’NextRebound?
閲覧回数 546,924
3,414人が討論中
3
#BitcoinActiveSupplyInProfitDropsBelow45%
閲覧回数 65,509
669人が討論中
4
#KavaSaysAbnormalActivityLimitedToKavaLend
閲覧回数 35,519
371人が討論中
5
#USSpotXRPETFsSeeLargestWeeklyOutflowIn8Months
閲覧回数 27,312
326人が討論中
6
#USPPIMissMayEaseBTCPressure
閲覧回数 284,451
2,227人が討論中
7
#WORPTLetsTouristsConvertCryptoToThaiBaht
閲覧回数 9,456
88人が討論中
8
#TONStrategyReports$23.97MQ3NetLoss
閲覧回数 10,134
42人が討論中
9
#PolkadotCommunityApprovesNewStrategyWith97%Vote
閲覧回数 26,515
285人が討論中
10
#dYdXPlansV9.9UpgradeToShiftUSDCToInjective
閲覧回数 24,297
245人が討論中