Binance Square
CRYPTOVISION _BNB
4.8k Posts

CRYPTOVISION _BNB

Market insights. Trade setups. Crypto opportunities.
Open Trade
Frequent Trader
2.5 Years
26 Following
3.5K+ Followers
6.2K+ Liked
Posts
Portfolio
PINNED
·
--
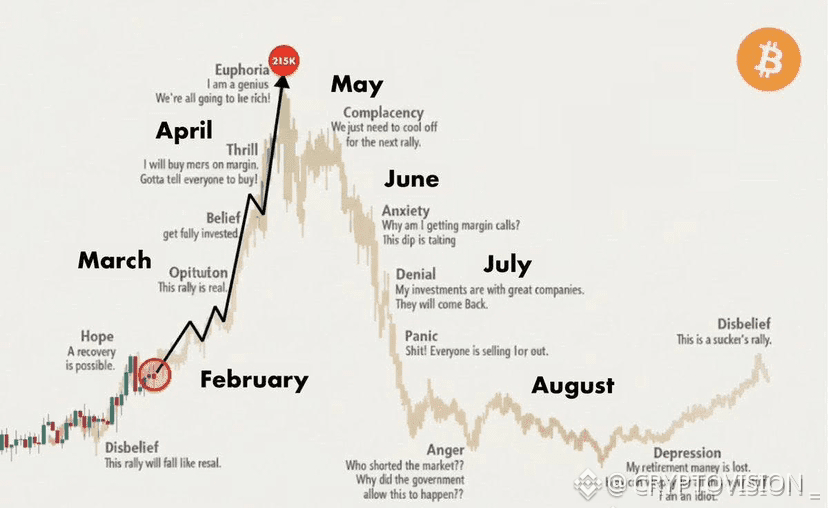
Predictions on the Bull Run of $BTC in 2026: A possible trajectory🎢 - February: Bear trap - March: Gold/Silver drop -> Bitcoin skyrockets - April: Altcoin season - May: New All-Time High (ATH) - June: Bull trap - July: Mass liquidation - August: Start of bear market 👉 These are speculative predictions and the market changes fast. Do you agree with this trajectory? 😂 trade down here ⬇️ with $BTC {future}(BTCUSDT)
Predictions on the Bull Run of $BTC in 2026: A possible trajectory🎢

- February: Bear trap
- March: Gold/Silver drop -> Bitcoin skyrockets
- April: Altcoin season
- May: New All-Time High (ATH)
- June: Bull trap
- July: Mass liquidation
- August: Start of bear market

👉 These are speculative predictions and the market changes fast. Do you agree with this trajectory? 😂
trade down here ⬇️ with $BTC
·
--
Bullish
$HYPE / $USD - Actualization Invest and pump, but don't enter before that on my part. We are in a strong resistance zone right now.
$HYPE / $USD - Actualization

Invest and pump, but don't enter before that on my part. We are in a strong resistance zone right now.
$ETH keep respecting the Diagonal in Expansion: targeting the orange box of $12K–$20K. 🟧 Nothing has changed: the cycle points to a final parabolic push before the real bearish market unfolds. $ETH {spot}(ETHUSDT) #Ethereum #bullmarket
$ETH keep respecting the Diagonal in Expansion: targeting the orange box of $12K–$20K. 🟧

Nothing has changed: the cycle points to a final parabolic push before the real bearish market unfolds.

$ETH

#Ethereum #bullmarket
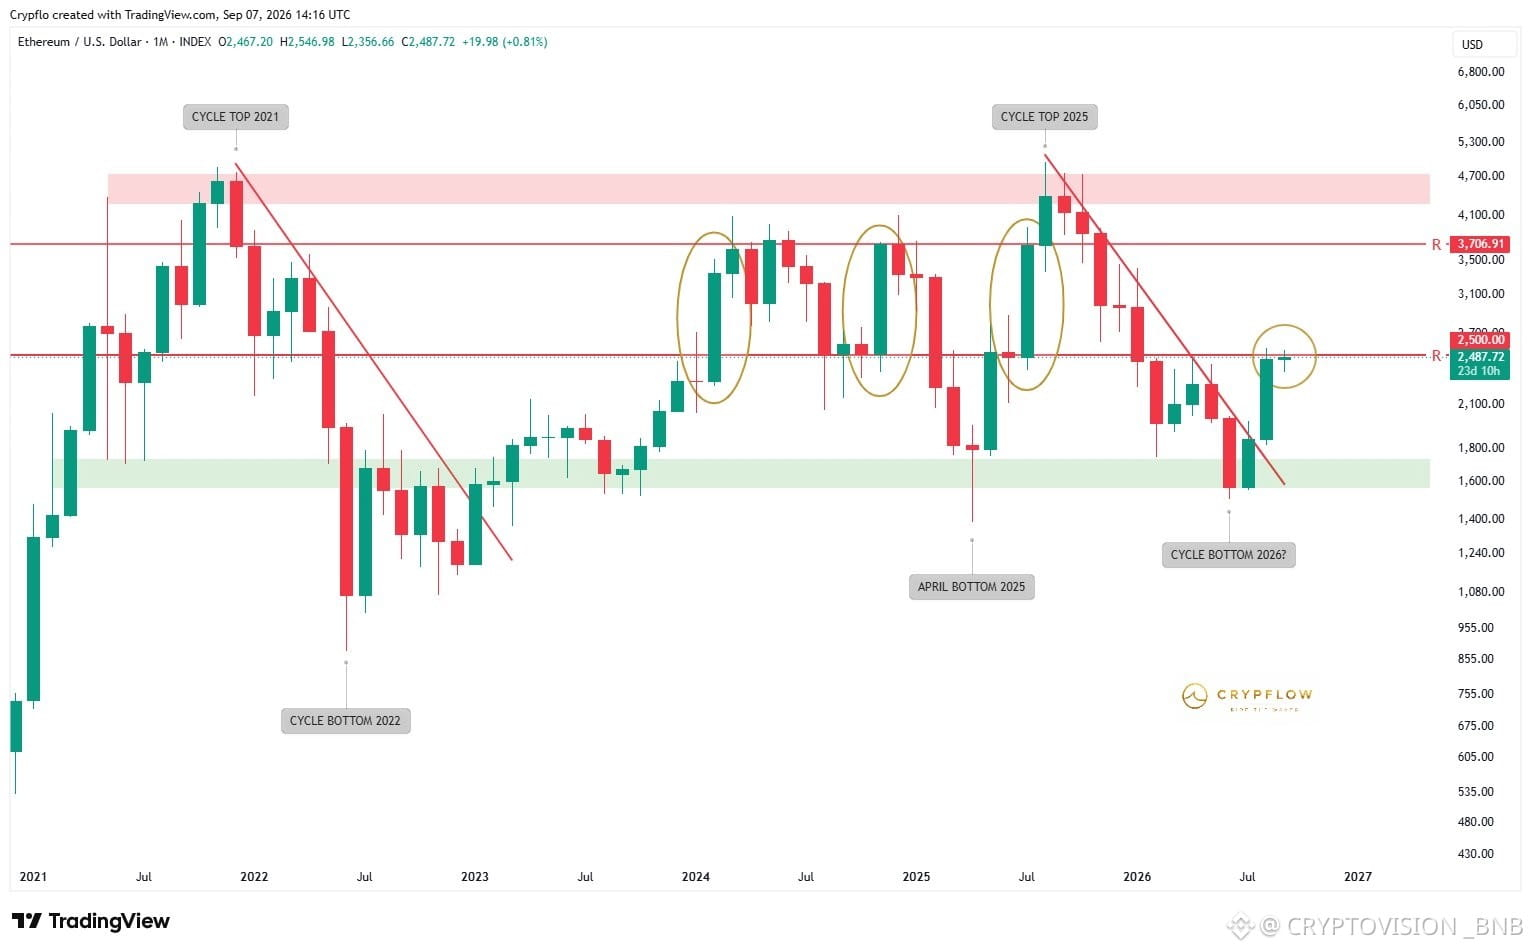
I’m constantly being asked where I think the “bottom” for $ETH is. In my opinion, the worst possible scenario... which would actually be an incredible opportunity, is that $ETH loses the $1,500 support level in the next 1–2 months and we see a capitulation move toward the $1,000–$1,500 range. I also believe this is the most likely scenario from here. This is what EVERYONE should be preparing for, with some cash in that band ready to take advantage of the setup. Personally, I still have 55% in cash in my portfolio as I prepare for what I think could be the “final bottom”. As for my exact levels, I cover this setup daily with my subscribers. $ETH {spot}(ETHUSDT)
I’m constantly being asked where I think the “bottom” for $ETH is.

In my opinion, the worst possible scenario... which would actually be an incredible opportunity, is that $ETH loses the $1,500 support level in the next 1–2 months and we see a capitulation move toward the $1,000–$1,500 range.

I also believe this is the most likely scenario from here. This is what EVERYONE should be preparing for, with some cash in that band ready to take advantage of the setup.

Personally, I still have 55% in cash in my portfolio as I prepare for what I think could be the “final bottom”.

As for my exact levels, I cover this setup daily with my subscribers.

$ETH
·
--
Bearish
$ADA 👀 Tardano is running out of strength; he needs to adjust a bit. Above all, check the daily RSI—it’s through the roof and the price didn’t even manage to break the previous high 😑 DOWNward, squid. $ADA {spot}(ADAUSDT)
$ADA 👀

Tardano is running out of strength; he needs to adjust a bit.

Above all, check the daily RSI—it’s through the roof and the price didn’t even manage to break the previous high 😑

DOWNward, squid.

$ADA
$BTC CONFIGURATION BULLISH Leverage: At the trader’s discretion 📍 Entry: Current market price 🛑 Stop Loss: 64,000 🎯 TP1: 66,000 Why am I bullish? • Bitcoin continues to defend an important support zone. • The short-term bullish structure remains intact. • Buying momentum is still strengthening, favoring a continuation of the move. • A confirmed breakout above nearby resistances could push the price toward 66,000. • As long as the price stays above 64,000, the bullish scenario will remain valid. Risk Management 💡 Consider taking partial profits as you approach the target and moving your stop loss to break-even once the trade is in your favor. Always protect your capital and avoid over-leveraging. Question: Do you think $BTC will reach 66,000, or will we see one last correction before the next bullish impulse? 👇 Trade $BTC here {spot}(BTCUSDT) #BTC
$BTC CONFIGURATION BULLISH

Leverage: At the trader’s discretion

📍 Entry: Current market price

🛑 Stop Loss: 64,000

🎯 TP1: 66,000

Why am I bullish?

• Bitcoin continues to defend an important support zone.

• The short-term bullish structure remains intact.

• Buying momentum is still strengthening, favoring a continuation of the move.

• A confirmed breakout above nearby resistances could push the price toward 66,000.

• As long as the price stays above 64,000, the bullish scenario will remain valid.

Risk Management

💡 Consider taking partial profits as you approach the target and moving your stop loss to break-even once the trade is in your favor. Always protect your capital and avoid over-leveraging.

Question: Do you think $BTC will reach 66,000, or will we see one last correction before the next bullish impulse?

👇 Trade $BTC here

#BTC
My local perspective on #HYPE So far, everything is going as planned: 1. Liquidity taken (DONE) 2. Long zone - $52/$49.7, middle line of the global channel and trend line (DONE) 3. Minimum target of $57 - 50% of the position closed (DONE) 4. Keeping the remaining 50% - Fib 0.5 target: $60 5. Final target: $61/$62 6. If $51/$49.7 breaks, short positions become the priority 7. Second long zone - $41/$48 for a bounce/retest of the global channel and trend line I’m planning to start my first spot buys in the $38–$48 zone. Greed is taking over right now, so everyone has to decide for themselves when to close their longs. Greed leads to Poverty Reminder: I expect the final correction to start in August/September, with $BTC setting its low around October/November. If anything changes, I’ll let you know. DYOR As a reminder, I warned about the bullish trap at $82K and the summer drop. MY NEXT CALL WILL BE THE MOST IMPORTANT OF THIS CYCLE. TURN ON NOTIFICATIONS. MOST PEOPLE WILL FOLLOW ME TOO LATE.
My local perspective on #HYPE

So far, everything is going as planned:

1. Liquidity taken (DONE)
2. Long zone - $52/$49.7, middle line of the global channel and trend line (DONE)
3. Minimum target of $57 - 50% of the position closed (DONE)
4. Keeping the remaining 50% - Fib 0.5 target: $60
5. Final target: $61/$62

6. If $51/$49.7 breaks, short positions become the priority
7. Second long zone - $41/$48 for a bounce/retest of the global channel and trend line

I’m planning to start my first spot buys in the $38–$48 zone.

Greed is taking over right now, so everyone has to decide for themselves when to close their longs.

Greed leads to Poverty

Reminder: I expect the final correction to start in August/September, with $BTC setting its low around October/November.

If anything changes, I’ll let you know. DYOR

As a reminder, I warned about the bullish trap at $82K and the summer drop.

MY NEXT CALL WILL BE THE MOST IMPORTANT OF THIS CYCLE.

TURN ON NOTIFICATIONS. MOST PEOPLE WILL FOLLOW ME TOO LATE.
🚨 STOP! STOP! STOP! This could be the best operation of the day. Don’t let it pass. 👀 🚀 $BTC BULLISH SETUP CONFIRMED Leverage: Trader’s choice 📍 Entry: Current market price 🛑 Stop Loss: 63,000 🎯 TP1: 67,000 Why am I bullish? • Bitcoin continues to respect an important support zone. • The bullish structure still favors a new push toward higher levels. • Buyers keep control of the market as long as price remains above the key support. • A confirmed breakout of nearby resistances could accelerate the move toward 67,000. • As long as price stays above 63,000, the bullish scenario remains valid. Risk Management Consider taking partial profits as price moves in your favor and moving the stop loss to break-even after locking in gains. Always protect your capital and avoid over-leveraging. Question: Do you think $BTC will reach 67,000, or will we see one last correction before the next bullish push? 👇 Trade $BTC here {spot}(BTCUSDT) #BTC
🚨 STOP! STOP! STOP!
This could be the best operation of the day. Don’t let it pass. 👀

🚀 $BTC BULLISH SETUP CONFIRMED

Leverage: Trader’s choice

📍 Entry: Current market price

🛑 Stop Loss: 63,000

🎯 TP1: 67,000

Why am I bullish?

• Bitcoin continues to respect an important support zone.

• The bullish structure still favors a new push toward higher levels.

• Buyers keep control of the market as long as price remains above the key support.

• A confirmed breakout of nearby resistances could accelerate the move toward 67,000.

• As long as price stays above 63,000, the bullish scenario remains valid.

Risk Management

Consider taking partial profits as price moves in your favor and moving the stop loss to break-even after locking in gains. Always protect your capital and avoid over-leveraging.

Question: Do you think $BTC will reach 67,000, or will we see one last correction before the next bullish push?

👇 Trade $BTC here

#BTC
☕️ Good morning traders! $BTC 4H Continue on the bearish channel 📉 about the upper side Resistance zone ❌ still remains the highest probability; the 4H RSI is already starting to move toward overbought and the MACD reflects the same. We’re starting to see several 4H candle closes with wicks on the upper side; this reflects selling pressure in that area—let’s see if it materializes 👀 I’m not afraid of going up—in fact, I’m expecting it, delighted 👉 if they want to play with retail and push to 65k - 66k, I’ll be averaging in gladly. You already know what the real move is to catch true liquidity 📉😉 $BTC {spot}(BTCUSDT)
☕️ Good morning traders!

$BTC 4H

Continue on the bearish channel 📉 about the upper side

Resistance zone ❌ still remains the highest probability; the 4H RSI is already starting to move toward overbought and the MACD reflects the same.

We’re starting to see several 4H candle closes with wicks on the upper side; this reflects selling pressure in that area—let’s see if it materializes 👀

I’m not afraid of going up—in fact, I’m expecting it, delighted 👉 if they want to play with retail and push to 65k - 66k, I’ll be averaging in gladly.

You already know what the real move is to catch true liquidity 📉😉

$BTC
🔥BRUTAL🔥 THREE TIMES THE SAME SIGNAL WAS USED. ALL THREE TIMES, NOBODY WANTED TO BUY. What would happen if I told you that the Bitcoin chart has a clock that goes off every four years, and today it’s about to ring again⁉️ 🎯 The Stochastic RSI measures the exhaustion of the move. It tells you whether the force that pushed the market has already been spent. 🎯 When the fast line crosses above the slow line while it’s on the floor, it’s the first sign that the seller is running out of ammo. 👉 What’s different here is the timeframe: each candle on this chart represents 2 months. That means the signal shows up two or three times every LONG while. 🧨 And when it has appeared these few times, it showed up at the worst moment for sentiment: ▪️ 2015: with Bitcoin near $200, and Mt. Gox still fresh ▪️ 2019: near $3,200, after the crypto winter ▪️ 2023: near $16,000, with FTX just collapsed 📍 And today the indicator is back in the cross zone, with Bitcoin around $63,500—45% below the value it had a year ago. Do you think we’re facing the same always-familiar FLOOR pattern⁉️
🔥BRUTAL🔥

THREE TIMES THE SAME SIGNAL WAS USED. ALL THREE TIMES, NOBODY WANTED TO BUY.

What would happen if I told you that the Bitcoin chart has a clock that goes off every four years, and today it’s about to ring again⁉️

🎯 The Stochastic RSI measures the exhaustion of the move. It tells you whether the force that pushed the market has already been spent.
🎯 When the fast line crosses above the slow line while it’s on the floor, it’s the first sign that the seller is running out of ammo.

👉 What’s different here is the timeframe: each candle on this chart represents 2 months. That means the signal shows up two or three times every LONG while.

🧨 And when it has appeared these few times, it showed up at the worst moment for sentiment:

▪️ 2015: with Bitcoin near $200, and Mt. Gox still fresh
▪️ 2019: near $3,200, after the crypto winter
▪️ 2023: near $16,000, with FTX just collapsed

📍 And today the indicator is back in the cross zone, with Bitcoin around $63,500—45% below the value it had a year ago.

Do you think we’re facing the same always-familiar FLOOR pattern⁉️
🚨 STOP! STOP! STOP! This could be the best trade of the day. Don’t miss it. 👀 🚀 $CYS BULLISH SETUP CONFIRMED Leverage: Up to the trader 📍 Entry: Current market price 🛑 Stop Loss: 0.45 🎯 TP1: 0.80 Why am I bullish? • The price is showing strong buying pressure after the recent surge. • The short-term structure favors continuation of the bullish move. • Market interest continues to rise, supporting a potential advance to higher levels. • As long as the price stays above 0.45, the bullish scenario remains valid with a target at 0.80. Risk Management Consider taking partial profits when approaching the target and moving your stop loss to breakeven once the trade moves in your favor. Always protect your capital and avoid over-leveraging. Question: Do you think $CYS will reach 0.80, or will we see a pullback before the next bullish push? 👇 Trade $CYS here {future}(CYSUSDT) #CYS
🚨 STOP! STOP! STOP!
This could be the best trade of the day. Don’t miss it. 👀

🚀 $CYS BULLISH SETUP CONFIRMED

Leverage: Up to the trader

📍 Entry: Current market price

🛑 Stop Loss: 0.45

🎯 TP1: 0.80

Why am I bullish?

• The price is showing strong buying pressure after the recent surge.

• The short-term structure favors continuation of the bullish move.

• Market interest continues to rise, supporting a potential advance to higher levels.

• As long as the price stays above 0.45, the bullish scenario remains valid with a target at 0.80.

Risk Management

Consider taking partial profits when approaching the target and moving your stop loss to breakeven once the trade moves in your favor. Always protect your capital and avoid over-leveraging.

Question: Do you think $CYS will reach 0.80, or will we see a pullback before the next bullish push?

👇 Trade $CYS here

#CYS
ETH 12H - We have had a third rejection in the 12H trend, along with a bearish divergence in the RSI and selling pressure. Now the RSI is losing the 50 level. This last rejection is aligned with a successful bearish auction and a failure to reclaim that most recent range. 2H - The local price has once again lost the 2H trend, with the representation of the local trend on the way up. This most recent range is showing signs of distribution, but we are still maintaining, to some extent, a macro support/resistance level. Due to the bearish bias of the higher time frame, I could justify a short position if we get a new bounce toward the Fibonacci levels and a bit closer to the range high. I still see those poor lows from the higher time frame below as a potential turning target. To change the bias, price will need to reclaim the 12H trend and the upper range. $ETH {spot}(ETHUSDT)
ETH

12H - We have had a third rejection in the 12H trend, along with a bearish divergence in the RSI and selling pressure. Now the RSI is losing the 50 level. This last rejection is aligned with a successful bearish auction and a failure to reclaim that most recent range.

2H - The local price has once again lost the 2H trend, with the representation of the local trend on the way up. This most recent range is showing signs of distribution, but we are still maintaining, to some extent, a macro support/resistance level.

Due to the bearish bias of the higher time frame, I could justify a short position if we get a new bounce toward the Fibonacci levels and a bit closer to the range high. I still see those poor lows from the higher time frame below as a potential turning target.

To change the bias, price will need to reclaim the 12H trend and the upper range.

$ETH
🚨 STOP! STOP! STOP! This could be the best operation of the day. Don’t miss it. 👀 🚀 $BTC BULLISH SETUP CONFIRMED Leverage: At the trader’s discretion 📍 Entry: Current market price 🛑 Stop Loss: 63,500 🎯 TP1: 65,000 Why am I bullish? • Bitcoin continues to defend a key support zone. • The short-term bullish structure remains valid. • Buying momentum is strengthening further, favoring a continuation of the move. • As long as the price stays above 63,500, the bullish scenario will remain valid with a target at 65,000. • A confirmed breakout above resistance could accelerate the move toward higher levels. Risk Management Consider taking partial profits as you approach the target and moving your stop loss to break-even when the trade moves in your favor. Always protect your capital and avoid over-leveraging. Question: Do you think $BTC will reach 65,000, or will we see one last pullback before the next bullish push? 👇 Trade $BTC here {spot}(BTCUSDT) #BTC
🚨 STOP! STOP! STOP!
This could be the best operation of the day. Don’t miss it. 👀

🚀 $BTC BULLISH SETUP CONFIRMED

Leverage: At the trader’s discretion

📍 Entry: Current market price

🛑 Stop Loss: 63,500

🎯 TP1: 65,000

Why am I bullish?

• Bitcoin continues to defend a key support zone.

• The short-term bullish structure remains valid.

• Buying momentum is strengthening further, favoring a continuation of the move.

• As long as the price stays above 63,500, the bullish scenario will remain valid with a target at 65,000.

• A confirmed breakout above resistance could accelerate the move toward higher levels.

Risk Management

Consider taking partial profits as you approach the target and moving your stop loss to break-even when the trade moves in your favor. Always protect your capital and avoid over-leveraging.

Question: Do you think $BTC will reach 65,000, or will we see one last pullback before the next bullish push?

👇 Trade $BTC here

#BTC
$ETH: THE LONG-TERM PLAN REMAINS INTACT My strategy for Ethereum hasn’t changed. Months ago, I took profits by selling the rest of my positions near the 100-Day Moving Average (MA100), and since then I’ve mostly stayed in cash, waiting for a better opportunity. What’s the plan? • The long-term structure continues to develop as expected. • I’ve been waiting almost 8 months for the ideal moment to re-enter. • My goal is to wait for one final significant low before fully deploying my capital into $ETH. • I already have the exact buy and sell levels defined, and I’m not going to let emotions change my strategy. Patience is still the best tool. Big opportunities come to those who know how to wait. Question: Do you think $ETH will mark a final low before the next major bull cycle, or has the market already started its next move? 👇 $ETH {spot}(ETHUSDT) #ETH
$ETH : THE LONG-TERM PLAN REMAINS INTACT

My strategy for Ethereum hasn’t changed.

Months ago, I took profits by selling the rest of my positions near the 100-Day Moving Average (MA100), and since then I’ve mostly stayed in cash, waiting for a better opportunity.

What’s the plan?

• The long-term structure continues to develop as expected.

• I’ve been waiting almost 8 months for the ideal moment to re-enter.

• My goal is to wait for one final significant low before fully deploying my capital into $ETH .

• I already have the exact buy and sell levels defined, and I’m not going to let emotions change my strategy.

Patience is still the best tool. Big opportunities come to those who know how to wait.

Question: Do you think $ETH will mark a final low before the next major bull cycle, or has the market already started its next move? 👇

$ETH

#ETH
🚨 Many are thinking that now $lab will reverse... But the 1D chart is telling me that the reversal has just started... And a big bearish move is coming 🔻 $LAB BEARISH SETUP CONFIRMED Leverage: Trader’s choice 📍 Entry Zone: 0.1413 – 0.1429 🛑 Stop Loss: 0.1451 🎯 TP1: 0.1385 🎯 TP2: 0.1345 🎯 TP3: 0.1285 Why am I bearish? • $LAB was rejected at the 0.1421 resistance, without managing to reclaim the previous highs. • Price reached the upper Bollinger Bands band (1H), trapping buyers who were chasing the momentum. • The distribution observed above 0.1421 suggests liquidity was taken before a possible bearish move. • Open Interest fell by 3.96% while funding remains positive—an interplay that may favor a correction. • As long as price stays below 0.1451, the bearish scenario will remain valid with targets at 0.1385, 0.1345, and 0.1285. Risk Management Consider taking partial profits at each target and moving your stop loss to breakeven after hitting TP1. Always protect your capital and avoid over-leverage. Question: Do you think LAB will fall to 0.1285, or will buyers regain control above 0.1451? 👇 Trade $LAB here {future}(LABUSDT) #LAB #Trading #Binance #Futuros
🚨 Many are thinking that now $lab will reverse... But the 1D chart is telling me that the reversal has just started... And a big bearish move is coming

🔻 $LAB BEARISH SETUP CONFIRMED

Leverage: Trader’s choice

📍 Entry Zone: 0.1413 – 0.1429

🛑 Stop Loss: 0.1451

🎯 TP1: 0.1385

🎯 TP2: 0.1345

🎯 TP3: 0.1285

Why am I bearish?

$LAB was rejected at the 0.1421 resistance, without managing to reclaim the previous highs.

• Price reached the upper Bollinger Bands band (1H), trapping buyers who were chasing the momentum.

• The distribution observed above 0.1421 suggests liquidity was taken before a possible bearish move.

• Open Interest fell by 3.96% while funding remains positive—an interplay that may favor a correction.

• As long as price stays below 0.1451, the bearish scenario will remain valid with targets at 0.1385, 0.1345, and 0.1285.

Risk Management

Consider taking partial profits at each target and moving your stop loss to breakeven after hitting TP1. Always protect your capital and avoid over-leverage.

Question: Do you think LAB will fall to 0.1285, or will buyers regain control above 0.1451?

👇 Trade $LAB here

#LAB #Trading #Binance #Futuros
📊 $ETH UPDATE: THE $2,400 TARGET IS STILL ON My outlook on $ETH hasn’t changed. The chart structure remains solid and the plan stays exactly the same. There’s no reason to change the strategy as long as the market respects the key levels. What am I seeing? • The bullish structure remains intact. • We’re continuing to monitor the price step by step to seize new opportunities. • There are no signs that justify entering out of FOMO or getting carried away by the FUD. • Patience is still the best strategy right now. As long as the structure holds, the $2,400 target remains on the table. Question: Do you think $ETH will reach $2,400 this cycle, or will we see a correction before the next push? 👇 $ETH {spot}(ETHUSDT) #ETH #Ethereum
📊 $ETH UPDATE: THE $2,400 TARGET IS STILL ON

My outlook on $ETH hasn’t changed.

The chart structure remains solid and the plan stays exactly the same. There’s no reason to change the strategy as long as the market respects the key levels.

What am I seeing?

• The bullish structure remains intact.

• We’re continuing to monitor the price step by step to seize new opportunities.

• There are no signs that justify entering out of FOMO or getting carried away by the FUD.

• Patience is still the best strategy right now.

As long as the structure holds, the $2,400 target remains on the table.

Question: Do you think $ETH will reach $2,400 this cycle, or will we see a correction before the next push? 👇

$ETH

#ETH #Ethereum
🚀 $MU BULLISH SETUP CONFIRMED Leverage: 10X 📍 Entry Zone: 850 – 860 🛑 Stop Loss: 810 🎯 TP1: 880 🎯 TP2: 905 🎯 TP3: 930 🎯 TP4: 960 Why am I bullish? • The strong rebound from the demand zone 780–800 confirms that buyers are still defending support. • Price remains above 850, preserving a short-term bullish structure. • The formation of higher lows reflects strengthening buying momentum. • A confirmed break above 880 could trigger a new bullish leg toward 905, 930, and 960. • As long as price stays above 810, the bullish scenario will remain valid. Risk Management Risk only between 1% and 2% of your capital in this trade. Consider moving the stop loss to breakeven after reaching TP1 and always protect your capital. Question: Do you think $MU will break 880 and seek 960, or will we see a pullback before the next bullish push? 👇 Trade $MU here {future}(MUUSDT) #MU
🚀 $MU BULLISH SETUP CONFIRMED

Leverage: 10X

📍 Entry Zone: 850 – 860

🛑 Stop Loss: 810

🎯 TP1: 880

🎯 TP2: 905

🎯 TP3: 930

🎯 TP4: 960

Why am I bullish?

• The strong rebound from the demand zone 780–800 confirms that buyers are still defending support.

• Price remains above 850, preserving a short-term bullish structure.

• The formation of higher lows reflects strengthening buying momentum.

• A confirmed break above 880 could trigger a new bullish leg toward 905, 930, and 960.

• As long as price stays above 810, the bullish scenario will remain valid.

Risk Management

Risk only between 1% and 2% of your capital in this trade. Consider moving the stop loss to breakeven after reaching TP1 and always protect your capital.

Question: Do you think $MU will break 880 and seek 960, or will we see a pullback before the next bullish push?

👇 Trade $MU here

#MU
Guys, believe me: this is your day to trade... just short now $SKYAI with 25x and thank me later...🤝 🚀 $SKYAI BULLISH SETUP CONFIRMED Leverage: Up to the trader 📍 Entry Zone: 0.0468 – 0.0478 🛑 Stop Loss: 0.0335 🎯 TP1: 0.0500 🎯 TP2: 0.0540 🎯 TP3: 0.0580 🎯 TP4: 0.0620 Why am I bullish? • The price broke out of a long accumulation period after a prolonged downtrend. • Strong buying volume confirms renewed market interest. • Staying above the 0.0465 – 0.0470 zone preserves the bullish structure. • A confirmed break above 0.0500 could drive a new move toward the higher targets. • As long as the price remains above 0.0335, the bullish scenario will stay valid. Risk Management Consider taking partial profits at each target and moving your stop loss to break-even after reaching TP1. Always protect your capital and avoid over-leverage. Question: Do you think SKYAI will break 0.0500 and go for 0.0620, or will we see a pullback before the next bullish push? 👇 Trade $SKYAI here {future}(SKYAIUSDT) #SKYAI
Guys, believe me: this is your day to trade... just short now $SKYAI with 25x and thank me later...🤝

🚀 $SKYAI BULLISH SETUP CONFIRMED

Leverage: Up to the trader

📍 Entry Zone: 0.0468 – 0.0478

🛑 Stop Loss: 0.0335

🎯 TP1: 0.0500

🎯 TP2: 0.0540

🎯 TP3: 0.0580

🎯 TP4: 0.0620

Why am I bullish?

• The price broke out of a long accumulation period after a prolonged downtrend.

• Strong buying volume confirms renewed market interest.

• Staying above the 0.0465 – 0.0470 zone preserves the bullish structure.

• A confirmed break above 0.0500 could drive a new move toward the higher targets.

• As long as the price remains above 0.0335, the bullish scenario will stay valid.

Risk Management

Consider taking partial profits at each target and moving your stop loss to break-even after reaching TP1. Always protect your capital and avoid over-leverage.

Question: Do you think SKYAI will break 0.0500 and go for 0.0620, or will we see a pullback before the next bullish push?

👇 Trade $SKYAI here

#SKYAI
$HYPE OBJECTIVE ACHIEVED 🎯 Another operation closed successfully. 🚀 📈 The price already made a strong bullish move from the entry zone, confirming the strength of the buyers and creating an excellent opportunity for those who followed the signal. 👏 Congratulations to everyone who traded this setup! Who took this trade with me? 👇 #HYPE #Trading #Crypto #Binance #Futuros
$HYPE OBJECTIVE ACHIEVED 🎯

Another operation closed successfully. 🚀

📈 The price already made a strong bullish move from the entry zone, confirming the strength of the buyers and creating an excellent opportunity for those who followed the signal.

👏 Congratulations to everyone who traded this setup!

Who took this trade with me? 👇

#HYPE #Trading #Crypto #Binance #Futuros
CRYPTOVISION _BNB
·
--
Bullish
🚨 STOP! STOP! STOP!
This could be the best trade of the day. Don’t miss it. 👀

🚀 $HYPE BULLISH SETUP CONFIRMED

Leverage: Cross 25X

📍 Entry: 51.60

🛑 Stop Loss: 49.35

🎯 TP1: 52.25

🎯 TP2: 53.15

🎯 TP3: 54.50

Why am I bullish?

• Buyers continue to defend a key support zone.

• The short-term bullish structure still favors a continuation of the move.

• Buying momentum remains strong, increasing the probability of reaching new highs.

• As long as price stays above 49.35, the bullish scenario will remain valid with targets at 52.25, 53.15, and 54.50.

Risk Management

Consider taking partial profits at each target and moving your stop loss to break-even after hitting TP1. Always protect your capital and avoid over-leveraging.

Question: Do you think $HYPE will reach the final target of 54.50, or will we see a pullback before the next bullish push?

👇 Trade $HYPE here


#HYPE
🚨🚨 BITCOIN IS DEAD 🚨🚨 Bitcoin’s "ATR" indicator, or Mean True Range, has reached its lowest level since February 2024. Right now, volatility in BTC is at its lowest levels in more than 2 years—which is the same as 892 days... This situation could reverse at any moment. But the question is: where will the price turn when volatility starts to increase again? It’s clear that nobody would expect a bull run to start from here... It would be the most hated rally in history. $BTC {spot}(BTCUSDT)
🚨🚨 BITCOIN IS DEAD 🚨🚨

Bitcoin’s "ATR" indicator, or Mean True Range, has reached its lowest level since February 2024.

Right now, volatility in BTC is at its lowest levels in more than 2 years—which is the same as 892 days...

This situation could reverse at any moment.

But the question is: where will the price turn when volatility starts to increase again?

It’s clear that nobody would expect a bull run to start from here...

It would be the most hated rally in history.

$BTC
Log in to explore more content
Join global crypto users on Binance Square
⚡️ Get latest and useful information about crypto.
💬 Trusted by the world’s largest crypto exchange.
👍 Discover real insights from verified creators.
Email / Phone number
Sitemap
Cookie Preferences
Platform T&Cs