
Chart-Sniper
595 Posts

Chart-Sniper
Report
Block User
🎯 ChartSniper is your go-to spot for spotting top crypto gainers and breakout setups in real time. I focus on clean chart analysis, key support and resistance.
Open Trade
Occasional Trader
4.5 Months
5 Following
47 Followers
138 Liked
Posts
Portfolio
·
--
Article
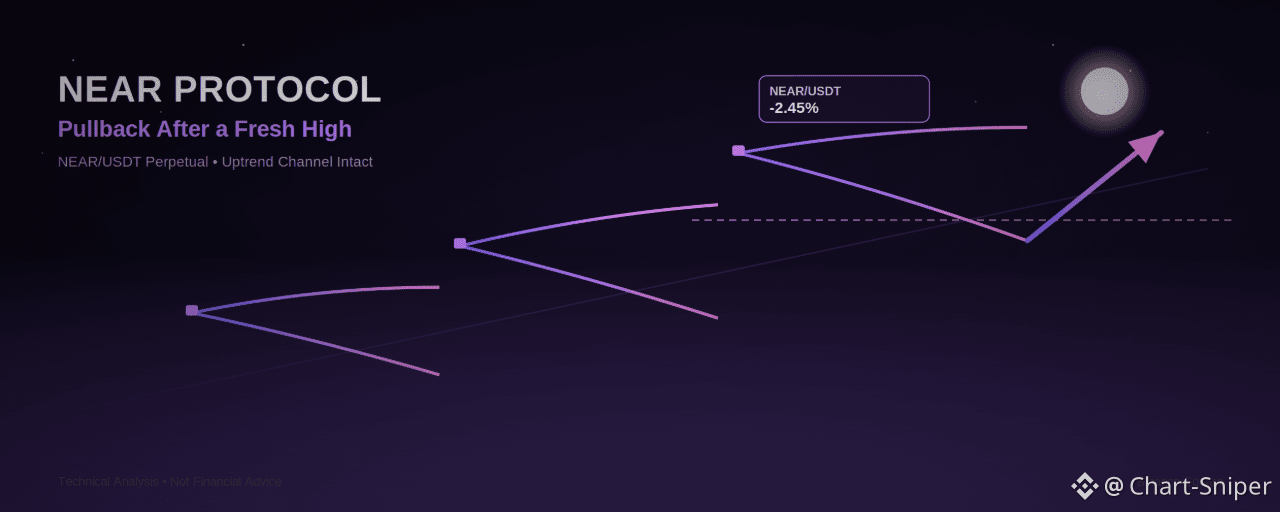
NEAR Protocol Pulls Back From a Fresh High — Is the Uptrend Bridge Still Standing?$NEAR
{future}(NEARUSDT)
NEAR (NEAR/USDT Perpetual) is cooling off after tagging a new local high. On the 1H chart, price opened at 2.616, spiked to 2.639, then sold off to a low of 2.526 before settling around 2.552, putting the candle down -2.45%. After a strong multi-day rally off the early-September low, this looks like a routine pullback inside a still-intact uptrend rather than a trend change — but the next few candles at the current support shelf will tell the real story.
Reading the Structure
The broader move on this chart is a clean impulsive rally: price bottomed at a Lower Low (LL) near 1.882, rallied into a Lower High (LH) area, dipped again, then broke decisively higher into a sequence of Higher Highs (HH) — first testing resistance in the mid-2.30s to 2.40s (the "Retracement Area" box on the chart), consolidating there, and then thrusting to the latest HH at 2.639.
That consolidation box wasn't just a pause — it acted as a launchpad. Price built a base there before breaking out to fresh highs, which is a constructive sign for trend continuation. Two parallel ascending trendlines are visible on the chart, forming a rising channel that has guided price higher since the early-September low; as long as price respects the lower boundary of that channel, the broader uptrend structure remains valid.
Key Levels on the Chart
Using the Fibonacci retracement drawn from the swing low (1.882) to the new swing high (2.639):
2.639 — the fresh high (0 fib), immediate overhead resistance2.460 — 23.6% retracement, highlighted as a key horizontal support/resistance level (green line) — price is currently trading just above this2.350 — 38.2% retracement, aligning closely with the top of the prior consolidation box2.261 — 50% retracement, the midpoint and the "structure test" level2.171 — 61.8% retracement, deep pullback zone2.044 — 78.6% retracement, the last line of defense before the move is fully retraced1.882 — the origin low (1 fib)
Current price (2.552) is holding comfortably above the 2.460 support and inside the upper third of this range, which keeps the near-term bullish structure intact.
Trade Setups
Setup 1 — Support Bounce Long (favored) Look for price to hold or reclaim the 2.460–2.500 zone (23.6% fib / the highlighted green support line) before entering.
Entry: 2.460 – 2.500Stop Loss: below 2.350 (38.2% fib, below the old consolidation top)Target 1: 2.639 (recent high)Target 2: 2.75 (channel extension)Target 3 (extended): 2.90 (upper trendline projection)
Setup 2 — Breakout Continuation (aggressive) For traders who prefer confirmation over anticipation, wait for a 1H close back above 2.639.
Entry: above 2.639 on a confirmed closeStop Loss: below 2.460Target 1: 2.75Target 2: 2.90
Invalidation: A decisive break and hold below 2.350 (38.2% fib) would signal the pullback is deepening beyond a routine retest, opening the door toward the 2.261–2.171 zone (50%–61.8% fib). A break below 2.044 (78.6% fib) would put the entire rally structure — and the higher-low sequence — in question.
The Bigger Picture
NEAR's current -2.45% candle looks like healthy profit-taking after a strong impulsive leg rather than a structural breakdown, since price is still trading well above the mid-range fib levels and inside the rising channel. That said, perpetual contracts can move fast in both directions, so waiting for price to confirm support at the 2.460 zone (or a clean breakout reclaim above 2.639) is the more disciplined approach versus buying into the middle of a red candle.
Live cross-checks of NEAR/USD across other sources returned a wide, inconsistent spread — from roughly $2.33 to $9.70 depending on the source and pair, several clearly stale or unrelated to the current Binance perpetual price — so the chart's own timestamped price (2.552) was treated as the authoritative reference for this analysis.
This is not financial advice. Perpetual futures carry additional funding-rate and liquidation risk on top of normal price volatility. Always size positions responsibly, use a stop loss, and do your own research before entering any trade.
@Binance_Square_Official #BitcoinSurpasses$79K #BrentCrudeTops$100 #USADPWeeklyEmploymentRises12000 #Binance #ChartSniper
NEAR Protocol Pulls Back From a Fresh High — Is the Uptrend Bridge Still Standing?
$NEAR
NEAR (NEAR/USDT Perpetual) is cooling off after tagging a new local high. On the 1H chart, price opened at 2.616, spiked to 2.639, then sold off to a low of 2.526 before settling around 2.552, putting the candle down -2.45%. After a strong multi-day rally off the early-September low, this looks like a routine pullback inside a still-intact uptrend rather than a trend change — but the next few candles at the current support shelf will tell the real story.
Reading the Structure
The broader move on this chart is a clean impulsive rally: price bottomed at a Lower Low (LL) near 1.882, rallied into a Lower High (LH) area, dipped again, then broke decisively higher into a sequence of Higher Highs (HH) — first testing resistance in the mid-2.30s to 2.40s (the "Retracement Area" box on the chart), consolidating there, and then thrusting to the latest HH at 2.639.
That consolidation box wasn't just a pause — it acted as a launchpad. Price built a base there before breaking out to fresh highs, which is a constructive sign for trend continuation. Two parallel ascending trendlines are visible on the chart, forming a rising channel that has guided price higher since the early-September low; as long as price respects the lower boundary of that channel, the broader uptrend structure remains valid.
Key Levels on the Chart
Using the Fibonacci retracement drawn from the swing low (1.882) to the new swing high (2.639):
2.639 — the fresh high (0 fib), immediate overhead resistance2.460 — 23.6% retracement, highlighted as a key horizontal support/resistance level (green line) — price is currently trading just above this2.350 — 38.2% retracement, aligning closely with the top of the prior consolidation box2.261 — 50% retracement, the midpoint and the "structure test" level2.171 — 61.8% retracement, deep pullback zone2.044 — 78.6% retracement, the last line of defense before the move is fully retraced1.882 — the origin low (1 fib)
Current price (2.552) is holding comfortably above the 2.460 support and inside the upper third of this range, which keeps the near-term bullish structure intact.
Trade Setups
Setup 1 — Support Bounce Long (favored) Look for price to hold or reclaim the 2.460–2.500 zone (23.6% fib / the highlighted green support line) before entering.
Entry: 2.460 – 2.500Stop Loss: below 2.350 (38.2% fib, below the old consolidation top)Target 1: 2.639 (recent high)Target 2: 2.75 (channel extension)Target 3 (extended): 2.90 (upper trendline projection)
Setup 2 — Breakout Continuation (aggressive) For traders who prefer confirmation over anticipation, wait for a 1H close back above 2.639.
Entry: above 2.639 on a confirmed closeStop Loss: below 2.460Target 1: 2.75Target 2: 2.90
Invalidation: A decisive break and hold below 2.350 (38.2% fib) would signal the pullback is deepening beyond a routine retest, opening the door toward the 2.261–2.171 zone (50%–61.8% fib). A break below 2.044 (78.6% fib) would put the entire rally structure — and the higher-low sequence — in question.
The Bigger Picture
NEAR's current -2.45% candle looks like healthy profit-taking after a strong impulsive leg rather than a structural breakdown, since price is still trading well above the mid-range fib levels and inside the rising channel. That said, perpetual contracts can move fast in both directions, so waiting for price to confirm support at the 2.460 zone (or a clean breakout reclaim above 2.639) is the more disciplined approach versus buying into the middle of a red candle.
Live cross-checks of NEAR/USD across other sources returned a wide, inconsistent spread — from roughly $2.33 to $9.70 depending on the source and pair, several clearly stale or unrelated to the current Binance perpetual price — so the chart's own timestamped price (2.552) was treated as the authoritative reference for this analysis.
This is not financial advice. Perpetual futures carry additional funding-rate and liquidation risk on top of normal price volatility. Always size positions responsibly, use a stop loss, and do your own research before entering any trade.
@Binance Square Official #BitcoinSurpasses$79K #BrentCrudeTops$100 #USADPWeeklyEmploymentRises12000 #Binance #ChartSniper
NEAR (NEAR/USDT Perpetual) is cooling off after tagging a new local high. On the 1H chart, price opened at 2.616, spiked to 2.639, then sold off to a low of 2.526 before settling around 2.552, putting the candle down -2.45%. After a strong multi-day rally off the early-September low, this looks like a routine pullback inside a still-intact uptrend rather than a trend change — but the next few candles at the current support shelf will tell the real story.
Reading the Structure
The broader move on this chart is a clean impulsive rally: price bottomed at a Lower Low (LL) near 1.882, rallied into a Lower High (LH) area, dipped again, then broke decisively higher into a sequence of Higher Highs (HH) — first testing resistance in the mid-2.30s to 2.40s (the "Retracement Area" box on the chart), consolidating there, and then thrusting to the latest HH at 2.639.
That consolidation box wasn't just a pause — it acted as a launchpad. Price built a base there before breaking out to fresh highs, which is a constructive sign for trend continuation. Two parallel ascending trendlines are visible on the chart, forming a rising channel that has guided price higher since the early-September low; as long as price respects the lower boundary of that channel, the broader uptrend structure remains valid.
Key Levels on the Chart
Using the Fibonacci retracement drawn from the swing low (1.882) to the new swing high (2.639):
2.639 — the fresh high (0 fib), immediate overhead resistance2.460 — 23.6% retracement, highlighted as a key horizontal support/resistance level (green line) — price is currently trading just above this2.350 — 38.2% retracement, aligning closely with the top of the prior consolidation box2.261 — 50% retracement, the midpoint and the "structure test" level2.171 — 61.8% retracement, deep pullback zone2.044 — 78.6% retracement, the last line of defense before the move is fully retraced1.882 — the origin low (1 fib)
Current price (2.552) is holding comfortably above the 2.460 support and inside the upper third of this range, which keeps the near-term bullish structure intact.
Trade Setups
Setup 1 — Support Bounce Long (favored) Look for price to hold or reclaim the 2.460–2.500 zone (23.6% fib / the highlighted green support line) before entering.
Entry: 2.460 – 2.500Stop Loss: below 2.350 (38.2% fib, below the old consolidation top)Target 1: 2.639 (recent high)Target 2: 2.75 (channel extension)Target 3 (extended): 2.90 (upper trendline projection)
Setup 2 — Breakout Continuation (aggressive) For traders who prefer confirmation over anticipation, wait for a 1H close back above 2.639.
Entry: above 2.639 on a confirmed closeStop Loss: below 2.460Target 1: 2.75Target 2: 2.90
Invalidation: A decisive break and hold below 2.350 (38.2% fib) would signal the pullback is deepening beyond a routine retest, opening the door toward the 2.261–2.171 zone (50%–61.8% fib). A break below 2.044 (78.6% fib) would put the entire rally structure — and the higher-low sequence — in question.
The Bigger Picture
NEAR's current -2.45% candle looks like healthy profit-taking after a strong impulsive leg rather than a structural breakdown, since price is still trading well above the mid-range fib levels and inside the rising channel. That said, perpetual contracts can move fast in both directions, so waiting for price to confirm support at the 2.460 zone (or a clean breakout reclaim above 2.639) is the more disciplined approach versus buying into the middle of a red candle.
Live cross-checks of NEAR/USD across other sources returned a wide, inconsistent spread — from roughly $2.33 to $9.70 depending on the source and pair, several clearly stale or unrelated to the current Binance perpetual price — so the chart's own timestamped price (2.552) was treated as the authoritative reference for this analysis.
This is not financial advice. Perpetual futures carry additional funding-rate and liquidation risk on top of normal price volatility. Always size positions responsibly, use a stop loss, and do your own research before entering any trade.
@Binance Square Official #BitcoinSurpasses$79K #BrentCrudeTops$100 #USADPWeeklyEmploymentRises12000 #Binance #ChartSniper
70
·
--
Article
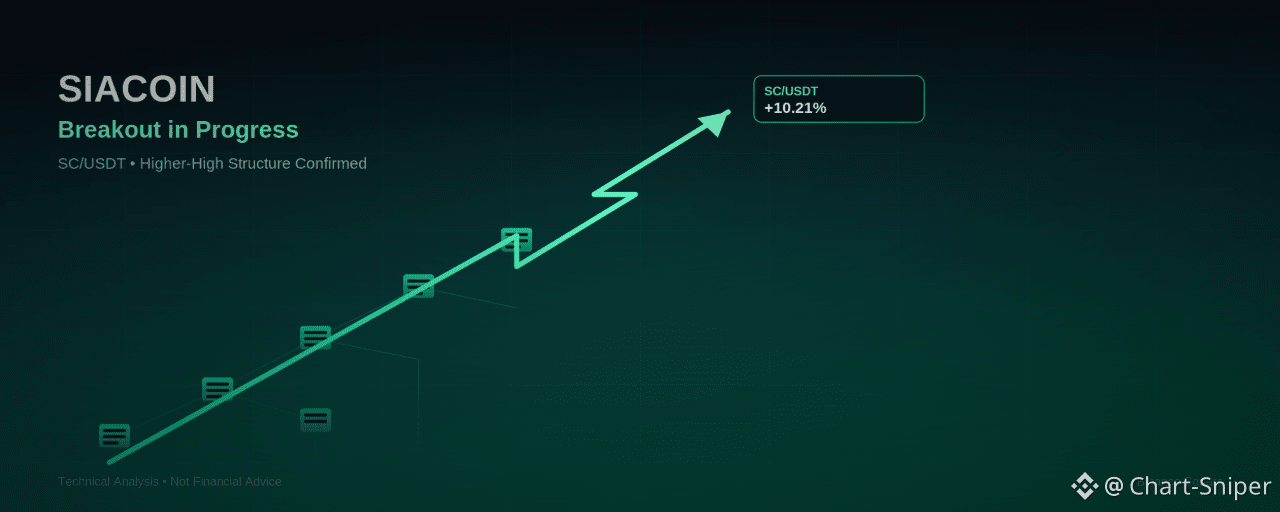
Siacoin Breaks Structure: Is SC/USDT Loading Up for the Next Higher High?$SC
{spot}(SCUSDT)
Siacoin (SC/USDT) has forced its way back onto trader radars after a sharp intraday move. On the 1H chart, price is up +10.21%, running from an open of 0.000871 to a high of 0.000993, before cooling off to trade around 0.000961 at the time of writing. For a coin that spent the better part of a week grinding sideways in a tight range, this kind of expansion candle is the type of move that shows up on "top gainer" screeners — and the market structure behind it suggests this may not be a one-candle wonder.
Reading the Structure: A Clean Higher-High, Higher-Low Sequence
Zooming out on the chart tells the real story. After an initial blow-off top and sharp correction earlier in the move (marked HH near 0.00110, followed by a Lower Low around 0.00072), SC carved out a textbook Dow Theory reversal sequence:
LL (Lower Low) — capitulation low near 0.000730HL (Higher Low) — demand stepped in around 0.000735–0.000750LH (Lower High) — early resistance test near 0.00087A rising trendline connecting the HL to the LH, acting as dynamic supportHH (Higher High) — the breakout high of 0.000993 that just printed, decisively clearing the prior LH resistance shelf
This progression — LL → HL → LH → HH — is the classic footprint of a trend reversal maturing into an uptrend. The fact that price broke and briefly held above the previous swing high (the old LH resistance, now acting as support) is a meaningfully bullish structural signal, not just noise from a green candle.
Key Levels on the Chart
Using the Fibonacci retracement drawn from the recent swing low (0.000735) to the new high (0.000986), several confluence zones stand out:
0.000910 — horizontal support/order-block level (highlighted in green on the chart) and the current battleground0.000927 — 23.6% retracement, first line of defense on a pullback0.000890 — 38.2% retracement0.000860 — 50% retracement, the "make-or-break" mean-reversion level0.000831 — 61.8% retracement, the deep pullback zone where the breakout thesis starts to weaken0.001006 — overhead resistance (red line), the level that capped the move and needs to flip into support for continuation0.000986 — the swing high (0 fib level) from this leg
Price is currently digesting just above the 0.000910–0.000927 confluence zone after tagging its high, which is a healthy, controlled pullback rather than a violent rejection.
Trade Setups
Setup 1 — Pullback Long (favored, better risk/reward) Wait for price to retrace into the 0.000910–0.000927 zone (the green support / 23.6% fib confluence). This is where the rising trendline and the prior breakout shelf line up.
Entry: 0.000910 – 0.000927Stop Loss: below 0.000860 (below the 50% fib and the rising trendline)Target 1: 0.000986 (prior swing high)Target 2: 0.001006 (red resistance line)Target 3 (extended): 0.00110 (the original HH, if momentum resumes)
Setup 2 — Breakout Continuation (aggressive) For traders who don't want to wait for a pullback, a confirmed 1H close back above 0.000993 with rising volume would signal the uptrend resuming directly.
Entry: above 0.000993 on a confirmed closeStop Loss: below 0.000927 (23.6% fib)Target 1: 0.001006Target 2: 0.00110
Invalidation: A clean break and hold below 0.000860 (50% fib) would undermine the higher-low structure and open the door back toward the 0.000788–0.000831 zone. Below the HL at ~0.000735 would invalidate the reversal thesis entirely.
The Bigger Picture
Structurally, SC looks like a coin transitioning out of a multi-day basing pattern into the early stage of a fresh uptrend, with the +10% expansion candle serving as confirmation rather than the whole story. That said, moves of this size after a quiet range can also attract fast profit-taking, so chasing the wick at 0.000993 is riskier than waiting for the market to come back to a defined support zone.
Live cross-checks of SC/USD across other data sources returned inconsistent, lagging figures — a common issue with lower-liquidity pairs during fast intraday moves — so the chart's own timestamped Binance price (0.000961) was treated as the authoritative reference for this analysis.
This is not financial advice. Crypto markets are highly volatile, and Siacoin in particular is prone to sharp reversals after fast expansion moves. Always size positions responsibly, use a stop loss, and do your own research before entering any trade.
@Binance_Square_Official #BitcoinSurpasses$79K #BrentCrudeTops$100 #USADPWeeklyEmploymentRises12000 #Binance #ChartSniper
Siacoin Breaks Structure: Is SC/USDT Loading Up for the Next Higher High?
$SC
Siacoin (SC/USDT) has forced its way back onto trader radars after a sharp intraday move. On the 1H chart, price is up +10.21%, running from an open of 0.000871 to a high of 0.000993, before cooling off to trade around 0.000961 at the time of writing. For a coin that spent the better part of a week grinding sideways in a tight range, this kind of expansion candle is the type of move that shows up on "top gainer" screeners — and the market structure behind it suggests this may not be a one-candle wonder.
Reading the Structure: A Clean Higher-High, Higher-Low Sequence
Zooming out on the chart tells the real story. After an initial blow-off top and sharp correction earlier in the move (marked HH near 0.00110, followed by a Lower Low around 0.00072), SC carved out a textbook Dow Theory reversal sequence:
LL (Lower Low) — capitulation low near 0.000730HL (Higher Low) — demand stepped in around 0.000735–0.000750LH (Lower High) — early resistance test near 0.00087A rising trendline connecting the HL to the LH, acting as dynamic supportHH (Higher High) — the breakout high of 0.000993 that just printed, decisively clearing the prior LH resistance shelf
This progression — LL → HL → LH → HH — is the classic footprint of a trend reversal maturing into an uptrend. The fact that price broke and briefly held above the previous swing high (the old LH resistance, now acting as support) is a meaningfully bullish structural signal, not just noise from a green candle.
Key Levels on the Chart
Using the Fibonacci retracement drawn from the recent swing low (0.000735) to the new high (0.000986), several confluence zones stand out:
0.000910 — horizontal support/order-block level (highlighted in green on the chart) and the current battleground0.000927 — 23.6% retracement, first line of defense on a pullback0.000890 — 38.2% retracement0.000860 — 50% retracement, the "make-or-break" mean-reversion level0.000831 — 61.8% retracement, the deep pullback zone where the breakout thesis starts to weaken0.001006 — overhead resistance (red line), the level that capped the move and needs to flip into support for continuation0.000986 — the swing high (0 fib level) from this leg
Price is currently digesting just above the 0.000910–0.000927 confluence zone after tagging its high, which is a healthy, controlled pullback rather than a violent rejection.
Trade Setups
Setup 1 — Pullback Long (favored, better risk/reward) Wait for price to retrace into the 0.000910–0.000927 zone (the green support / 23.6% fib confluence). This is where the rising trendline and the prior breakout shelf line up.
Entry: 0.000910 – 0.000927Stop Loss: below 0.000860 (below the 50% fib and the rising trendline)Target 1: 0.000986 (prior swing high)Target 2: 0.001006 (red resistance line)Target 3 (extended): 0.00110 (the original HH, if momentum resumes)
Setup 2 — Breakout Continuation (aggressive) For traders who don't want to wait for a pullback, a confirmed 1H close back above 0.000993 with rising volume would signal the uptrend resuming directly.
Entry: above 0.000993 on a confirmed closeStop Loss: below 0.000927 (23.6% fib)Target 1: 0.001006Target 2: 0.00110
Invalidation: A clean break and hold below 0.000860 (50% fib) would undermine the higher-low structure and open the door back toward the 0.000788–0.000831 zone. Below the HL at ~0.000735 would invalidate the reversal thesis entirely.
The Bigger Picture
Structurally, SC looks like a coin transitioning out of a multi-day basing pattern into the early stage of a fresh uptrend, with the +10% expansion candle serving as confirmation rather than the whole story. That said, moves of this size after a quiet range can also attract fast profit-taking, so chasing the wick at 0.000993 is riskier than waiting for the market to come back to a defined support zone.
Live cross-checks of SC/USD across other data sources returned inconsistent, lagging figures — a common issue with lower-liquidity pairs during fast intraday moves — so the chart's own timestamped Binance price (0.000961) was treated as the authoritative reference for this analysis.
This is not financial advice. Crypto markets are highly volatile, and Siacoin in particular is prone to sharp reversals after fast expansion moves. Always size positions responsibly, use a stop loss, and do your own research before entering any trade.
@Binance Square Official #BitcoinSurpasses$79K #BrentCrudeTops$100 #USADPWeeklyEmploymentRises12000 #Binance #ChartSniper
Siacoin (SC/USDT) has forced its way back onto trader radars after a sharp intraday move. On the 1H chart, price is up +10.21%, running from an open of 0.000871 to a high of 0.000993, before cooling off to trade around 0.000961 at the time of writing. For a coin that spent the better part of a week grinding sideways in a tight range, this kind of expansion candle is the type of move that shows up on "top gainer" screeners — and the market structure behind it suggests this may not be a one-candle wonder.
Reading the Structure: A Clean Higher-High, Higher-Low Sequence
Zooming out on the chart tells the real story. After an initial blow-off top and sharp correction earlier in the move (marked HH near 0.00110, followed by a Lower Low around 0.00072), SC carved out a textbook Dow Theory reversal sequence:
LL (Lower Low) — capitulation low near 0.000730HL (Higher Low) — demand stepped in around 0.000735–0.000750LH (Lower High) — early resistance test near 0.00087A rising trendline connecting the HL to the LH, acting as dynamic supportHH (Higher High) — the breakout high of 0.000993 that just printed, decisively clearing the prior LH resistance shelf
This progression — LL → HL → LH → HH — is the classic footprint of a trend reversal maturing into an uptrend. The fact that price broke and briefly held above the previous swing high (the old LH resistance, now acting as support) is a meaningfully bullish structural signal, not just noise from a green candle.
Key Levels on the Chart
Using the Fibonacci retracement drawn from the recent swing low (0.000735) to the new high (0.000986), several confluence zones stand out:
0.000910 — horizontal support/order-block level (highlighted in green on the chart) and the current battleground0.000927 — 23.6% retracement, first line of defense on a pullback0.000890 — 38.2% retracement0.000860 — 50% retracement, the "make-or-break" mean-reversion level0.000831 — 61.8% retracement, the deep pullback zone where the breakout thesis starts to weaken0.001006 — overhead resistance (red line), the level that capped the move and needs to flip into support for continuation0.000986 — the swing high (0 fib level) from this leg
Price is currently digesting just above the 0.000910–0.000927 confluence zone after tagging its high, which is a healthy, controlled pullback rather than a violent rejection.
Trade Setups
Setup 1 — Pullback Long (favored, better risk/reward) Wait for price to retrace into the 0.000910–0.000927 zone (the green support / 23.6% fib confluence). This is where the rising trendline and the prior breakout shelf line up.
Entry: 0.000910 – 0.000927Stop Loss: below 0.000860 (below the 50% fib and the rising trendline)Target 1: 0.000986 (prior swing high)Target 2: 0.001006 (red resistance line)Target 3 (extended): 0.00110 (the original HH, if momentum resumes)
Setup 2 — Breakout Continuation (aggressive) For traders who don't want to wait for a pullback, a confirmed 1H close back above 0.000993 with rising volume would signal the uptrend resuming directly.
Entry: above 0.000993 on a confirmed closeStop Loss: below 0.000927 (23.6% fib)Target 1: 0.001006Target 2: 0.00110
Invalidation: A clean break and hold below 0.000860 (50% fib) would undermine the higher-low structure and open the door back toward the 0.000788–0.000831 zone. Below the HL at ~0.000735 would invalidate the reversal thesis entirely.
The Bigger Picture
Structurally, SC looks like a coin transitioning out of a multi-day basing pattern into the early stage of a fresh uptrend, with the +10% expansion candle serving as confirmation rather than the whole story. That said, moves of this size after a quiet range can also attract fast profit-taking, so chasing the wick at 0.000993 is riskier than waiting for the market to come back to a defined support zone.
Live cross-checks of SC/USD across other data sources returned inconsistent, lagging figures — a common issue with lower-liquidity pairs during fast intraday moves — so the chart's own timestamped Binance price (0.000961) was treated as the authoritative reference for this analysis.
This is not financial advice. Crypto markets are highly volatile, and Siacoin in particular is prone to sharp reversals after fast expansion moves. Always size positions responsibly, use a stop loss, and do your own research before entering any trade.
@Binance Square Official #BitcoinSurpasses$79K #BrentCrudeTops$100 #USADPWeeklyEmploymentRises12000 #Binance #ChartSniper
59
·
--
📊 $BANK USDT — TECHNICAL SETUP
BANK is trading near $0.0353, consolidating around support after recent volatility. The $0.0340 area is key support, while $0.0360–$0.0370 is the first resistance zone. A reclaim above $0.036 can open room toward $0.040.
🟢 LONG ENTRY: $0.03530
🛑 SL: $0.03380
🎯 TP1: $0.03700
🎯 TP2: $0.04000
🎯 TP3: $0.04500
⚡ Entry is executable now.
⚠️ Not financial advice. Manage risk carefully
@Binance_Square_Official #AEROSurges17%In24Hours #IranSaysItCapturedUSUnmannedSubmarine #SaudiHaltsSouthernEnergySitesAfterAttacks #Binance #ChartSniper
{future}(BANKUSDT)
📊 $BANK USDT — TECHNICAL SETUP
BANK is trading near $0.0353, consolidating around support after recent volatility. The $0.0340 area is key support, while $0.0360–$0.0370 is the first resistance zone. A reclaim above $0.036 can open room toward $0.040.
🟢 LONG ENTRY: $0.03530
🛑 SL: $0.03380
🎯 TP1: $0.03700
🎯 TP2: $0.04000
🎯 TP3: $0.04500
⚡ Entry is executable now.
⚠️ Not financial advice. Manage risk carefully
@Binance Square Official #AEROSurges17%In24Hours #IranSaysItCapturedUSUnmannedSubmarine #SaudiHaltsSouthernEnergySitesAfterAttacks #Binance #ChartSniper
BANK is trading near $0.0353, consolidating around support after recent volatility. The $0.0340 area is key support, while $0.0360–$0.0370 is the first resistance zone. A reclaim above $0.036 can open room toward $0.040.
🟢 LONG ENTRY: $0.03530
🛑 SL: $0.03380
🎯 TP1: $0.03700
🎯 TP2: $0.04000
🎯 TP3: $0.04500
⚡ Entry is executable now.
⚠️ Not financial advice. Manage risk carefully
@Binance Square Official #AEROSurges17%In24Hours #IranSaysItCapturedUSUnmannedSubmarine #SaudiHaltsSouthernEnergySitesAfterAttacks #Binance #ChartSniper
292
·
--
📈 PI USDT — LONG SETUP
PI is trading near $0.09635, showing modest bullish momentum. Price is holding around the $0.096 support area, while a break above $0.100 could strengthen the continuation setup.
🟢 LONG ENTRY: $0.09635
🛑 SL: $0.09200
🎯 TP1: $0.10000
🎯 TP2: $0.10500
🎯 TP3: $0.11200
⚡ Entry: Current Market Price
⚠️ Not financial advice. Manage risk carefully.
@Binance_Square_Official #IranSaysItCapturedUSUnmannedSubmarine #AEROSurges17%In24Hours #SaudiHaltsSouthernEnergySitesAfterAttacks #Binance #ChartSniper
📈 PI USDT — LONG SETUP
PI is trading near $0.09635, showing modest bullish momentum. Price is holding around the $0.096 support area, while a break above $0.100 could strengthen the continuation setup.
🟢 LONG ENTRY: $0.09635
🛑 SL: $0.09200
🎯 TP1: $0.10000
🎯 TP2: $0.10500
🎯 TP3: $0.11200
⚡ Entry: Current Market Price
⚠️ Not financial advice. Manage risk carefully.
@Binance Square Official #IranSaysItCapturedUSUnmannedSubmarine #AEROSurges17%In24Hours #SaudiHaltsSouthernEnergySitesAfterAttacks #Binance #ChartSniper
PI is trading near $0.09635, showing modest bullish momentum. Price is holding around the $0.096 support area, while a break above $0.100 could strengthen the continuation setup.
🟢 LONG ENTRY: $0.09635
🛑 SL: $0.09200
🎯 TP1: $0.10000
🎯 TP2: $0.10500
🎯 TP3: $0.11200
⚡ Entry: Current Market Price
⚠️ Not financial advice. Manage risk carefully.
@Binance Square Official #IranSaysItCapturedUSUnmannedSubmarine #AEROSurges17%In24Hours #SaudiHaltsSouthernEnergySitesAfterAttacks #Binance #ChartSniper
46
·
--
📈 $XRP USDT — LONG SETUP
XRP is around $1.42, with RSI near 57 and most moving averages showing a buy signal. Price is holding above the $1.40 area, supporting a bullish continuation setup.
🟢 LONG ENTRY: $1.42
🛑 SL: $1.38
🎯 TP1: $1.47
🎯 TP2: $1.55
🎯 TP3: $1.68
⚡ Entry is executable at current market price.
⚠️ Not financial advice. Manage risk carefully.
@Binance_Square_Official #AEROSurges17%In24Hours #IranSaysItCapturedUSUnmannedSubmarine #SaudiHaltsSouthernEnergySitesAfterAttacks #Binance #ChartSniper
{future}(XRPUSDT)
📈 $XRP USDT — LONG SETUP
XRP is around $1.42, with RSI near 57 and most moving averages showing a buy signal. Price is holding above the $1.40 area, supporting a bullish continuation setup.
🟢 LONG ENTRY: $1.42
🛑 SL: $1.38
🎯 TP1: $1.47
🎯 TP2: $1.55
🎯 TP3: $1.68
⚡ Entry is executable at current market price.
⚠️ Not financial advice. Manage risk carefully.
@Binance Square Official #AEROSurges17%In24Hours #IranSaysItCapturedUSUnmannedSubmarine #SaudiHaltsSouthernEnergySitesAfterAttacks #Binance #ChartSniper
XRP is around $1.42, with RSI near 57 and most moving averages showing a buy signal. Price is holding above the $1.40 area, supporting a bullish continuation setup.
🟢 LONG ENTRY: $1.42
🛑 SL: $1.38
🎯 TP1: $1.47
🎯 TP2: $1.55
🎯 TP3: $1.68
⚡ Entry is executable at current market price.
⚠️ Not financial advice. Manage risk carefully.
@Binance Square Official #AEROSurges17%In24Hours #IranSaysItCapturedUSUnmannedSubmarine #SaudiHaltsSouthernEnergySitesAfterAttacks #Binance #ChartSniper
79
·
--
🔥 $DOT USDT — TOP HOT COIN
DOT is showing strong momentum, trading near $1.08 and up over 10% today. Price is pushing toward the $1.10–$1.12 resistance zone; holding above $1.00 keeps the short-term structure bullish.
🟢 LONG ENTRY: $1.08
🛑 SL: $1.00
🎯 TP1: $1.15
🎯 TP2: $1.22
🎯 TP3: $1.30
⚡ Signal: Strong momentum
⚠️ Not financial advice. Manage risk carefully.
@Binance_Square_Official #USIranTradeTankerStrikesEscalate #CanadaToImpose15%To50%TariffsOnUSGoods #ZcashRises45%WeeklyToHighestSince2016 #Binance #ChartSniper
{future}(DOTUSDT)
🔥 $DOT USDT — TOP HOT COIN
DOT is showing strong momentum, trading near $1.08 and up over 10% today. Price is pushing toward the $1.10–$1.12 resistance zone; holding above $1.00 keeps the short-term structure bullish.
🟢 LONG ENTRY: $1.08
🛑 SL: $1.00
🎯 TP1: $1.15
🎯 TP2: $1.22
🎯 TP3: $1.30
⚡ Signal: Strong momentum
⚠️ Not financial advice. Manage risk carefully.
@Binance Square Official #USIranTradeTankerStrikesEscalate #CanadaToImpose15%To50%TariffsOnUSGoods #ZcashRises45%WeeklyToHighestSince2016 #Binance #ChartSniper
DOT is showing strong momentum, trading near $1.08 and up over 10% today. Price is pushing toward the $1.10–$1.12 resistance zone; holding above $1.00 keeps the short-term structure bullish.
🟢 LONG ENTRY: $1.08
🛑 SL: $1.00
🎯 TP1: $1.15
🎯 TP2: $1.22
🎯 TP3: $1.30
⚡ Signal: Strong momentum
⚠️ Not financial advice. Manage risk carefully.
@Binance Square Official #USIranTradeTankerStrikesEscalate #CanadaToImpose15%To50%TariffsOnUSGoods #ZcashRises45%WeeklyToHighestSince2016 #Binance #ChartSniper
126
·
--
🔥 $BNB USDT — TOP HOT COIN
BNB is showing strong momentum, trading around $775 after a sharp weekly recovery. Technical bias remains bullish, with price holding above the $765–$770 area.
🟢 LONG ENTRY: $775
🛑 SL: $758
🎯 TP1: $795
🎯 TP2: $820
🎯 TP3: $850
📊 Signal: Bullish momentum
⚡ Entry is executable at current market price.
⚠️ Not financial advice. Manage risk carefully.
@Binance_Square_Official #ZECHitsANewAllTimeHigh #LululemonTumbles20%OnWeakGuidance #BitcoinETFsBiggestDailyInflowSinceJanuary #Binance #ChartSniper
{future}(BNBUSDT)
🔥 $BNB USDT — TOP HOT COIN
BNB is showing strong momentum, trading around $775 after a sharp weekly recovery. Technical bias remains bullish, with price holding above the $765–$770 area.
🟢 LONG ENTRY: $775
🛑 SL: $758
🎯 TP1: $795
🎯 TP2: $820
🎯 TP3: $850
📊 Signal: Bullish momentum
⚡ Entry is executable at current market price.
⚠️ Not financial advice. Manage risk carefully.
@Binance Square Official #ZECHitsANewAllTimeHigh #LululemonTumbles20%OnWeakGuidance #BitcoinETFsBiggestDailyInflowSinceJanuary #Binance #ChartSniper
BNB is showing strong momentum, trading around $775 after a sharp weekly recovery. Technical bias remains bullish, with price holding above the $765–$770 area.
🟢 LONG ENTRY: $775
🛑 SL: $758
🎯 TP1: $795
🎯 TP2: $820
🎯 TP3: $850
📊 Signal: Bullish momentum
⚡ Entry is executable at current market price.
⚠️ Not financial advice. Manage risk carefully.
@Binance Square Official #ZECHitsANewAllTimeHigh #LululemonTumbles20%OnWeakGuidance #BitcoinETFsBiggestDailyInflowSinceJanuary #Binance #ChartSniper
1
81
·
--
📉 $HYPE USDT — SHORT SETUP
HYPE is around $85.56, testing the $86.5–$87 resistance zone after a strong rally. With a major token unlock adding volatility, rejection here could trigger a pullback.
🔴 SHORT ENTRY: $85.56
🛑 SL: $88.20
🎯 TP1: $82.50
🎯 TP2: $79.80
🎯 TP3: $76.50
⚠️ Invalidation: Above $88.20
Not financial advice. Manage risk carefully.
@Binance_Square_Official #ZECHitsANewAllTimeHigh #LululemonTumbles20%OnWeakGuidance #BitcoinETFsBiggestDailyInflowSinceJanuary #Binance #ChartSniper
{future}(HYPEUSDT)
📉 $HYPE USDT — SHORT SETUP
HYPE is around $85.56, testing the $86.5–$87 resistance zone after a strong rally. With a major token unlock adding volatility, rejection here could trigger a pullback.
🔴 SHORT ENTRY: $85.56
🛑 SL: $88.20
🎯 TP1: $82.50
🎯 TP2: $79.80
🎯 TP3: $76.50
⚠️ Invalidation: Above $88.20
Not financial advice. Manage risk carefully.
@Binance Square Official #ZECHitsANewAllTimeHigh #LululemonTumbles20%OnWeakGuidance #BitcoinETFsBiggestDailyInflowSinceJanuary #Binance #ChartSniper
HYPE is around $85.56, testing the $86.5–$87 resistance zone after a strong rally. With a major token unlock adding volatility, rejection here could trigger a pullback.
🔴 SHORT ENTRY: $85.56
🛑 SL: $88.20
🎯 TP1: $82.50
🎯 TP2: $79.80
🎯 TP3: $76.50
⚠️ Invalidation: Above $88.20
Not financial advice. Manage risk carefully.
@Binance Square Official #ZECHitsANewAllTimeHigh #LululemonTumbles20%OnWeakGuidance #BitcoinETFsBiggestDailyInflowSinceJanuary #Binance #ChartSniper
1
122
·
--
📉 $CHIP USDT — SHORT SETUP
CHIP is showing extreme volatility after a sharp rally, with price around $0.0556 and momentum beginning to cool. A rejection near the current high can trigger a pullback toward lower supports.
🔴 SHORT ENTRY: $0.05560
🛑 SL: $0.05850
🎯 TP1: $0.05200
🎯 TP2: $0.04800
🎯 TP3: $0.04400
⚠️ Invalidation above SL.
Not financial advice. Manage risk carefully.
@Binance_Square_Official #USWeeklyInitialJoblessClaimsRiseTo206000 #SnowflakeSurges24%OnEarningsBeat #USISMServicesRisesTo55.4InAugust #Binance #ChartSniper
{future}(CHIPUSDT)
📉 $CHIP USDT — SHORT SETUP
CHIP is showing extreme volatility after a sharp rally, with price around $0.0556 and momentum beginning to cool. A rejection near the current high can trigger a pullback toward lower supports.
🔴 SHORT ENTRY: $0.05560
🛑 SL: $0.05850
🎯 TP1: $0.05200
🎯 TP2: $0.04800
🎯 TP3: $0.04400
⚠️ Invalidation above SL.
Not financial advice. Manage risk carefully.
@Binance Square Official #USWeeklyInitialJoblessClaimsRiseTo206000 #SnowflakeSurges24%OnEarningsBeat #USISMServicesRisesTo55.4InAugust #Binance #ChartSniper
CHIP is showing extreme volatility after a sharp rally, with price around $0.0556 and momentum beginning to cool. A rejection near the current high can trigger a pullback toward lower supports.
🔴 SHORT ENTRY: $0.05560
🛑 SL: $0.05850
🎯 TP1: $0.05200
🎯 TP2: $0.04800
🎯 TP3: $0.04400
⚠️ Invalidation above SL.
Not financial advice. Manage risk carefully.
@Binance Square Official #USWeeklyInitialJoblessClaimsRiseTo206000 #SnowflakeSurges24%OnEarningsBeat #USISMServicesRisesTo55.4InAugust #Binance #ChartSniper
1
175
·
--
📈 $LAB USDT — LONG SWING
LAB is holding a bullish structure around the $0.067–0.068 area, with buyers defending the current support zone. A sustained move above this area could open the next resistance levels. Recent LAB setups also highlight this zone as key support.
🟢 BUY ENTRY: $0.06750
🛑 SL: $0.06609
🎯 TP1: $0.07000
🎯 TP2: $0.07300
🎯 TP3: $0.07700
⚠️ Risk: 1% | Swing
Not financial advice.
@Binance_Square_Official #SnowflakeSurges24%OnEarningsBeat #USWeeklyInitialJoblessClaimsRiseTo206000 #USISMServicesRisesTo55.4InAugust #Binance #ChartSniper
{future}(LABUSDT)
📈 $LAB USDT — LONG SWING
LAB is holding a bullish structure around the $0.067–0.068 area, with buyers defending the current support zone. A sustained move above this area could open the next resistance levels. Recent LAB setups also highlight this zone as key support.
🟢 BUY ENTRY: $0.06750
🛑 SL: $0.06609
🎯 TP1: $0.07000
🎯 TP2: $0.07300
🎯 TP3: $0.07700
⚠️ Risk: 1% | Swing
Not financial advice.
@Binance Square Official #SnowflakeSurges24%OnEarningsBeat #USWeeklyInitialJoblessClaimsRiseTo206000 #USISMServicesRisesTo55.4InAugust #Binance #ChartSniper
LAB is holding a bullish structure around the $0.067–0.068 area, with buyers defending the current support zone. A sustained move above this area could open the next resistance levels. Recent LAB setups also highlight this zone as key support.
🟢 BUY ENTRY: $0.06750
🛑 SL: $0.06609
🎯 TP1: $0.07000
🎯 TP2: $0.07300
🎯 TP3: $0.07700
⚠️ Risk: 1% | Swing
Not financial advice.
@Binance Square Official #SnowflakeSurges24%OnEarningsBeat #USWeeklyInitialJoblessClaimsRiseTo206000 #USISMServicesRisesTo55.4InAugust #Binance #ChartSniper
1
397
·
--
Article
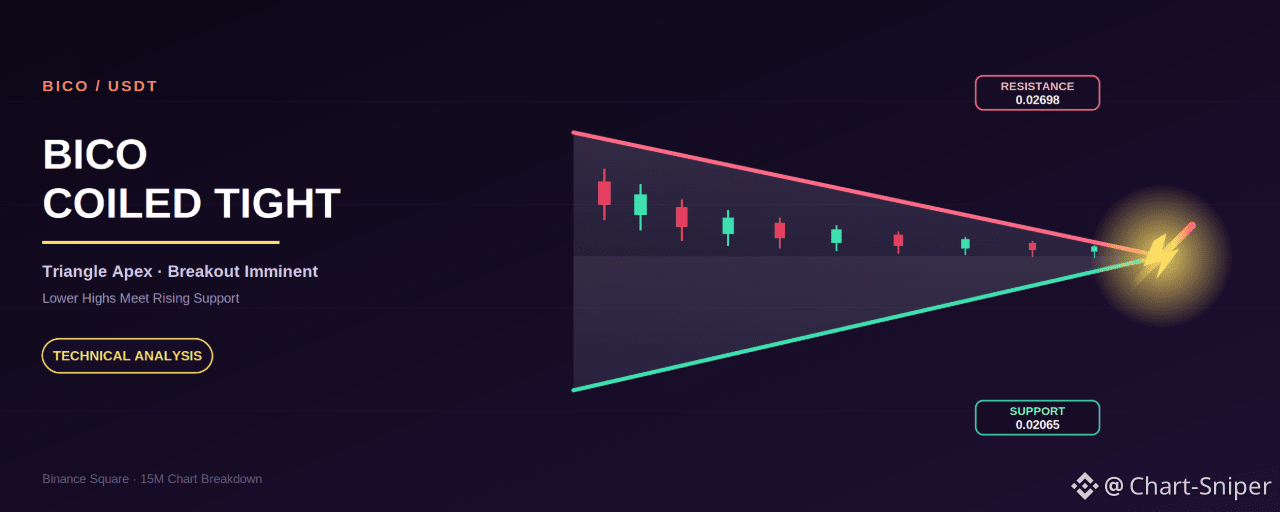
BICO Coiled Tight: Triangle Apex Points to a Big Move on BICOUSDT$BICO
{future}(BICOUSDT)
BICO/USDT Perpetual · 15-Minute Chart · Binance
Biconomy's BICO token has spent the last week compressing into one of the tightest technical setups you'll see on a lower timeframe chart — a textbook contracting triangle that's now converging at its apex. When price gets squeezed this hard, the move that follows tends to be sharp. Here's what the structure is telling us.
Reading the Compression
The story on the 15-minute chart starts with a sharp impulsive spike to a Higher High near 0.0305 on Aug 27, followed by a steady bleed lower. From that peak, a clean descending trendline connects a series of Lower Highs — first around 0.0242, then again near 0.0224 — each rejection weaker than the last, showing sellers gradually losing momentum rather than gaining it.
At the same time, a rising trendline has been quietly built from the early lows, anchoring a Higher Low structure beneath price and converging with that descending resistance line almost exactly where price sits right now, around 0.0211–0.0212. A flat horizontal resistance also sits overhead at 0.02698, marking the top of the initial post-spike consolidation range.
This is a classic symmetrical/descending triangle squeeze: lower highs meeting higher lows, volatility contracting candle by candle, and price now trading almost exactly on the apex. Triangles this tight rarely stay quiet for long — a decisive breakout in either direction is the most likely resolution.
The Two Scenarios to Watch
Bullish Scenario: A confirmed close back above the descending trendline and the most recent Lower High near 0.0224 would flip momentum back in the buyers' favor and open the path toward the 0.0242 Lower High, with the major 0.02698 resistance as the extended target if momentum carries through.
Bearish Scenario: A confirmed close below the rising trendline and the 0.0206 support shelf would signal the triangle is resolving lower, exposing the range low structure back toward 0.0187, with 0.0165 as a deeper extension if selling accelerates.
Given the sequence of progressively lower highs into the apex, the path of least resistance leans slightly bearish, but this is a genuine coin-flip setup until price actually commits — trading the breakout, not the anticipation, is the safer approach here.
Trade Setup (Educational Framework — Not Financial Advice)
Bias: Neutral-to-slightly-bearish inside the triangle; directional bias only confirms on a decisive breakout candle with a close outside the pattern.
Long Entry (Breakout): 0.0220 – 0.0228, on a confirmed close and retest above the descending trendline / 0.0224 Lower High Long Target 1: 0.0242 Long Target 2: 0.0270 Long Stop Loss: Below 0.0205
Short Entry (Breakdown): 0.0202 – 0.0208, on a confirmed close and retest below the rising trendline / 0.0206 support Short Target 1: 0.0187 Short Target 2: 0.0165 Short Stop Loss: Above 0.0222
Given how tight this apex is, false breakouts (wicks that pierce a trendline without a confirmed close) are common — waiting for the retest rather than chasing the first candle is the more disciplined approach.
Live Price Check
Cross-referencing against live market data at the time of writing showed a wide spread across sources — a byproduct of thin liquidity and feed lag common to smaller-cap tokens like BICO — with figures ranging from levels close to the chart's current 0.0211 zone up toward the 0.0270 resistance area. Given this scatter, the chart's own timestamped price is used as the primary reference for this analysis.
Final Thoughts
BICO has boiled its volatility down to almost nothing, and that's exactly the kind of setup that precedes an outsized move. Rather than guessing the direction, let the apex resolve itself — a confirmed breakout with a retest, in either direction, is the higher-probability trade.
Disclaimer: This article is for educational and informational purposes only and does not constitute financial, investment, or trading advice. Cryptocurrency markets are highly volatile and speculative. Always conduct your own research and risk management before making any trading decisions.
@Binance_Square_Official #SolanaFallsOver3% #DellSurges8%OnEarningsBeat #USAugADPJobsSmallestGainSinceJan #BINANCE #CHARTSNIPER
BICO Coiled Tight: Triangle Apex Points to a Big Move on BICOUSDT
$BICO
BICO/USDT Perpetual · 15-Minute Chart · Binance
Biconomy's BICO token has spent the last week compressing into one of the tightest technical setups you'll see on a lower timeframe chart — a textbook contracting triangle that's now converging at its apex. When price gets squeezed this hard, the move that follows tends to be sharp. Here's what the structure is telling us.
Reading the Compression
The story on the 15-minute chart starts with a sharp impulsive spike to a Higher High near 0.0305 on Aug 27, followed by a steady bleed lower. From that peak, a clean descending trendline connects a series of Lower Highs — first around 0.0242, then again near 0.0224 — each rejection weaker than the last, showing sellers gradually losing momentum rather than gaining it.
At the same time, a rising trendline has been quietly built from the early lows, anchoring a Higher Low structure beneath price and converging with that descending resistance line almost exactly where price sits right now, around 0.0211–0.0212. A flat horizontal resistance also sits overhead at 0.02698, marking the top of the initial post-spike consolidation range.
This is a classic symmetrical/descending triangle squeeze: lower highs meeting higher lows, volatility contracting candle by candle, and price now trading almost exactly on the apex. Triangles this tight rarely stay quiet for long — a decisive breakout in either direction is the most likely resolution.
The Two Scenarios to Watch
Bullish Scenario: A confirmed close back above the descending trendline and the most recent Lower High near 0.0224 would flip momentum back in the buyers' favor and open the path toward the 0.0242 Lower High, with the major 0.02698 resistance as the extended target if momentum carries through.
Bearish Scenario: A confirmed close below the rising trendline and the 0.0206 support shelf would signal the triangle is resolving lower, exposing the range low structure back toward 0.0187, with 0.0165 as a deeper extension if selling accelerates.
Given the sequence of progressively lower highs into the apex, the path of least resistance leans slightly bearish, but this is a genuine coin-flip setup until price actually commits — trading the breakout, not the anticipation, is the safer approach here.
Trade Setup (Educational Framework — Not Financial Advice)
Bias: Neutral-to-slightly-bearish inside the triangle; directional bias only confirms on a decisive breakout candle with a close outside the pattern.
Long Entry (Breakout): 0.0220 – 0.0228, on a confirmed close and retest above the descending trendline / 0.0224 Lower High Long Target 1: 0.0242 Long Target 2: 0.0270 Long Stop Loss: Below 0.0205
Short Entry (Breakdown): 0.0202 – 0.0208, on a confirmed close and retest below the rising trendline / 0.0206 support Short Target 1: 0.0187 Short Target 2: 0.0165 Short Stop Loss: Above 0.0222
Given how tight this apex is, false breakouts (wicks that pierce a trendline without a confirmed close) are common — waiting for the retest rather than chasing the first candle is the more disciplined approach.
Live Price Check
Cross-referencing against live market data at the time of writing showed a wide spread across sources — a byproduct of thin liquidity and feed lag common to smaller-cap tokens like BICO — with figures ranging from levels close to the chart's current 0.0211 zone up toward the 0.0270 resistance area. Given this scatter, the chart's own timestamped price is used as the primary reference for this analysis.
Final Thoughts
BICO has boiled its volatility down to almost nothing, and that's exactly the kind of setup that precedes an outsized move. Rather than guessing the direction, let the apex resolve itself — a confirmed breakout with a retest, in either direction, is the higher-probability trade.
Disclaimer: This article is for educational and informational purposes only and does not constitute financial, investment, or trading advice. Cryptocurrency markets are highly volatile and speculative. Always conduct your own research and risk management before making any trading decisions.
@Binance Square Official #SolanaFallsOver3% #DellSurges8%OnEarningsBeat #USAugADPJobsSmallestGainSinceJan #BINANCE #CHARTSNIPER
BICO/USDT Perpetual · 15-Minute Chart · Binance
Biconomy's BICO token has spent the last week compressing into one of the tightest technical setups you'll see on a lower timeframe chart — a textbook contracting triangle that's now converging at its apex. When price gets squeezed this hard, the move that follows tends to be sharp. Here's what the structure is telling us.
Reading the Compression
The story on the 15-minute chart starts with a sharp impulsive spike to a Higher High near 0.0305 on Aug 27, followed by a steady bleed lower. From that peak, a clean descending trendline connects a series of Lower Highs — first around 0.0242, then again near 0.0224 — each rejection weaker than the last, showing sellers gradually losing momentum rather than gaining it.
At the same time, a rising trendline has been quietly built from the early lows, anchoring a Higher Low structure beneath price and converging with that descending resistance line almost exactly where price sits right now, around 0.0211–0.0212. A flat horizontal resistance also sits overhead at 0.02698, marking the top of the initial post-spike consolidation range.
This is a classic symmetrical/descending triangle squeeze: lower highs meeting higher lows, volatility contracting candle by candle, and price now trading almost exactly on the apex. Triangles this tight rarely stay quiet for long — a decisive breakout in either direction is the most likely resolution.
The Two Scenarios to Watch
Bullish Scenario: A confirmed close back above the descending trendline and the most recent Lower High near 0.0224 would flip momentum back in the buyers' favor and open the path toward the 0.0242 Lower High, with the major 0.02698 resistance as the extended target if momentum carries through.
Bearish Scenario: A confirmed close below the rising trendline and the 0.0206 support shelf would signal the triangle is resolving lower, exposing the range low structure back toward 0.0187, with 0.0165 as a deeper extension if selling accelerates.
Given the sequence of progressively lower highs into the apex, the path of least resistance leans slightly bearish, but this is a genuine coin-flip setup until price actually commits — trading the breakout, not the anticipation, is the safer approach here.
Trade Setup (Educational Framework — Not Financial Advice)
Bias: Neutral-to-slightly-bearish inside the triangle; directional bias only confirms on a decisive breakout candle with a close outside the pattern.
Long Entry (Breakout): 0.0220 – 0.0228, on a confirmed close and retest above the descending trendline / 0.0224 Lower High Long Target 1: 0.0242 Long Target 2: 0.0270 Long Stop Loss: Below 0.0205
Short Entry (Breakdown): 0.0202 – 0.0208, on a confirmed close and retest below the rising trendline / 0.0206 support Short Target 1: 0.0187 Short Target 2: 0.0165 Short Stop Loss: Above 0.0222
Given how tight this apex is, false breakouts (wicks that pierce a trendline without a confirmed close) are common — waiting for the retest rather than chasing the first candle is the more disciplined approach.
Live Price Check
Cross-referencing against live market data at the time of writing showed a wide spread across sources — a byproduct of thin liquidity and feed lag common to smaller-cap tokens like BICO — with figures ranging from levels close to the chart's current 0.0211 zone up toward the 0.0270 resistance area. Given this scatter, the chart's own timestamped price is used as the primary reference for this analysis.
Final Thoughts
BICO has boiled its volatility down to almost nothing, and that's exactly the kind of setup that precedes an outsized move. Rather than guessing the direction, let the apex resolve itself — a confirmed breakout with a retest, in either direction, is the higher-probability trade.
Disclaimer: This article is for educational and informational purposes only and does not constitute financial, investment, or trading advice. Cryptocurrency markets are highly volatile and speculative. Always conduct your own research and risk management before making any trading decisions.
@Binance Square Official #SolanaFallsOver3% #DellSurges8%OnEarningsBeat #USAugADPJobsSmallestGainSinceJan #BINANCE #CHARTSNIPER
1
351
·
--
Article
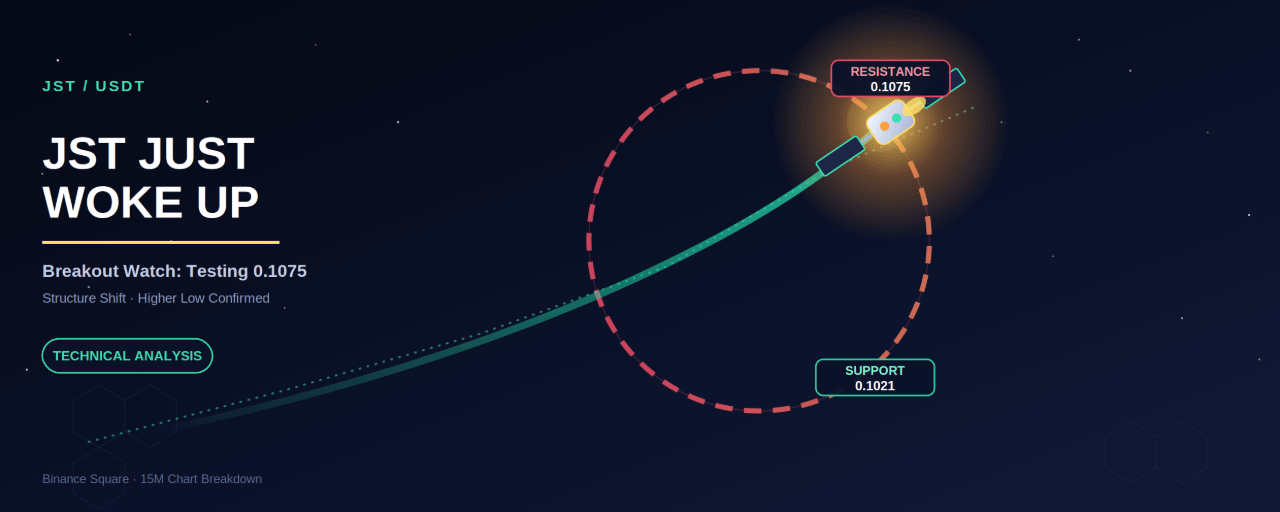
JST Just Woke Up: Is JSTUSDT Gearing Up for a Breakout Above $0.1075?$JST
{future}(JSTUSDT)
JST/USDT Perpetual · 15-Minute Chart · Binance
TRON's governance and lending token, JST, has quietly flipped its short-term structure from bearish to bullish — and the chart is now knocking on the door of a key resistance level that could decide where this move goes next.
Market Structure: A Clean Reversal Playing Out
Zooming into the 15-minute chart, JSTUSDT tells a textbook story of trend exhaustion followed by a structural reversal:
Downtrend phase (Aug 22–31): Price carved out a Higher High near 0.1075, then broke down into a sequence of Lower Lows, bottoming out first near 0.0958 and again closer to 0.0935. Momentum was firmly with the sellers through this stretch.The turn (Aug 31): A Higher Low printed around 0.0935, marking the first sign that sellers were losing control. From there, buyers pushed price into a Lower High near 0.1030 — still technically bearish structure, but the character of the move had clearly shifted.Confirmation (Sep 1–2): JST broke decisively above that Lower High and the 0.1021 horizontal level (the old support-turned-resistance zone from the initial breakdown), printing a fresh Higher High and confirming a bullish change of character on the lower timeframe.
That 0.1021 level is doing exactly what technical traders want to see from broken structure: it flipped from resistance to support and has been respected on the retest. Combine that with the rising trendline connecting the Higher Low to current price, and JST now has two layers of support beneath it.
The Level That Matters Right Now: 0.1075
Price is currently trading around 0.1065, grinding directly into the 0.1075 resistance zone — the same level that marked the prior swing high before the entire downtrend began. This is the single most important level on the chart today. A clean break and hold above it would confirm the reversal is more than just a short-term bounce and opens the door to a fresh leg higher. Rejection here, on the other hand, would put JST back into range-bound chop between 0.1021 and 0.1075.
Trade Setup (Educational Framework — Not Financial Advice)
Bias: Cautiously bullish while price holds above 0.1021 support and the rising trendline.
Entry Zone 1 – Breakout Continuation: 0.1065 – 0.1078 A momentum entry for traders comfortable buying strength, looking for a sustained close above 0.1075 with volume confirmation.
Entry Zone 2 – Pullback / Retest: 0.1021 – 0.1040 The more conservative entry — waiting for price to pull back into the flipped support zone or tag the rising trendline before continuing higher. This zone offers a tighter risk profile.
Target 1: 0.1100 Target 2: 0.1140 Target 3: 0.1180 (measured move objective, aligned with the upper visible range on the chart)
Stop Loss: Below 0.1005 (a close beneath the 0.1021 support and trendline confluence would invalidate the bullish setup)
Invalidation: A sustained close back below 0.1000 would suggest the reversal has failed, putting the Higher Low near 0.0935 back in play as downside support.
Live Price Check
Cross-referencing against live market data at the time of writing shows JST trading in the same broad vicinity as the chart's 0.1065 print, with some third-party sources lagging slightly due to feed delays — the chart's own timestamped price is used as the primary reference for this analysis.
Final Thoughts
JST has done the hard technical work: it broke a downtrend, printed a Higher Low, reclaimed a Lower High, and is now testing the exact level that started the sell-off in the first place. The next few candles at 0.1075 will likely set the tone for the coming sessions. Patient traders may prefer to let the breakout — or the retest — confirm itself before committing size.
Disclaimer: This article is for educational and informational purposes only and does not constitute financial, investment, or trading advice. Cryptocurrency markets are highly volatile and speculative. Always conduct your own research and risk management before making any trading decisions.
@Binance_Square_Official #SolanaFallsOver3% #USAugADPJobsSmallestGainSinceJan #SaudiSaysIranAttackedShipInHormuz #Binance #ChartSniper
JST Just Woke Up: Is JSTUSDT Gearing Up for a Breakout Above $0.1075?
$JST
JST/USDT Perpetual · 15-Minute Chart · Binance
TRON's governance and lending token, JST, has quietly flipped its short-term structure from bearish to bullish — and the chart is now knocking on the door of a key resistance level that could decide where this move goes next.
Market Structure: A Clean Reversal Playing Out
Zooming into the 15-minute chart, JSTUSDT tells a textbook story of trend exhaustion followed by a structural reversal:
Downtrend phase (Aug 22–31): Price carved out a Higher High near 0.1075, then broke down into a sequence of Lower Lows, bottoming out first near 0.0958 and again closer to 0.0935. Momentum was firmly with the sellers through this stretch.The turn (Aug 31): A Higher Low printed around 0.0935, marking the first sign that sellers were losing control. From there, buyers pushed price into a Lower High near 0.1030 — still technically bearish structure, but the character of the move had clearly shifted.Confirmation (Sep 1–2): JST broke decisively above that Lower High and the 0.1021 horizontal level (the old support-turned-resistance zone from the initial breakdown), printing a fresh Higher High and confirming a bullish change of character on the lower timeframe.
That 0.1021 level is doing exactly what technical traders want to see from broken structure: it flipped from resistance to support and has been respected on the retest. Combine that with the rising trendline connecting the Higher Low to current price, and JST now has two layers of support beneath it.
The Level That Matters Right Now: 0.1075
Price is currently trading around 0.1065, grinding directly into the 0.1075 resistance zone — the same level that marked the prior swing high before the entire downtrend began. This is the single most important level on the chart today. A clean break and hold above it would confirm the reversal is more than just a short-term bounce and opens the door to a fresh leg higher. Rejection here, on the other hand, would put JST back into range-bound chop between 0.1021 and 0.1075.
Trade Setup (Educational Framework — Not Financial Advice)
Bias: Cautiously bullish while price holds above 0.1021 support and the rising trendline.
Entry Zone 1 – Breakout Continuation: 0.1065 – 0.1078 A momentum entry for traders comfortable buying strength, looking for a sustained close above 0.1075 with volume confirmation.
Entry Zone 2 – Pullback / Retest: 0.1021 – 0.1040 The more conservative entry — waiting for price to pull back into the flipped support zone or tag the rising trendline before continuing higher. This zone offers a tighter risk profile.
Target 1: 0.1100 Target 2: 0.1140 Target 3: 0.1180 (measured move objective, aligned with the upper visible range on the chart)
Stop Loss: Below 0.1005 (a close beneath the 0.1021 support and trendline confluence would invalidate the bullish setup)
Invalidation: A sustained close back below 0.1000 would suggest the reversal has failed, putting the Higher Low near 0.0935 back in play as downside support.
Live Price Check
Cross-referencing against live market data at the time of writing shows JST trading in the same broad vicinity as the chart's 0.1065 print, with some third-party sources lagging slightly due to feed delays — the chart's own timestamped price is used as the primary reference for this analysis.
Final Thoughts
JST has done the hard technical work: it broke a downtrend, printed a Higher Low, reclaimed a Lower High, and is now testing the exact level that started the sell-off in the first place. The next few candles at 0.1075 will likely set the tone for the coming sessions. Patient traders may prefer to let the breakout — or the retest — confirm itself before committing size.
Disclaimer: This article is for educational and informational purposes only and does not constitute financial, investment, or trading advice. Cryptocurrency markets are highly volatile and speculative. Always conduct your own research and risk management before making any trading decisions.
@Binance Square Official #SolanaFallsOver3% #USAugADPJobsSmallestGainSinceJan #SaudiSaysIranAttackedShipInHormuz #Binance #ChartSniper
JST/USDT Perpetual · 15-Minute Chart · Binance
TRON's governance and lending token, JST, has quietly flipped its short-term structure from bearish to bullish — and the chart is now knocking on the door of a key resistance level that could decide where this move goes next.
Market Structure: A Clean Reversal Playing Out
Zooming into the 15-minute chart, JSTUSDT tells a textbook story of trend exhaustion followed by a structural reversal:
Downtrend phase (Aug 22–31): Price carved out a Higher High near 0.1075, then broke down into a sequence of Lower Lows, bottoming out first near 0.0958 and again closer to 0.0935. Momentum was firmly with the sellers through this stretch.The turn (Aug 31): A Higher Low printed around 0.0935, marking the first sign that sellers were losing control. From there, buyers pushed price into a Lower High near 0.1030 — still technically bearish structure, but the character of the move had clearly shifted.Confirmation (Sep 1–2): JST broke decisively above that Lower High and the 0.1021 horizontal level (the old support-turned-resistance zone from the initial breakdown), printing a fresh Higher High and confirming a bullish change of character on the lower timeframe.
That 0.1021 level is doing exactly what technical traders want to see from broken structure: it flipped from resistance to support and has been respected on the retest. Combine that with the rising trendline connecting the Higher Low to current price, and JST now has two layers of support beneath it.
The Level That Matters Right Now: 0.1075
Price is currently trading around 0.1065, grinding directly into the 0.1075 resistance zone — the same level that marked the prior swing high before the entire downtrend began. This is the single most important level on the chart today. A clean break and hold above it would confirm the reversal is more than just a short-term bounce and opens the door to a fresh leg higher. Rejection here, on the other hand, would put JST back into range-bound chop between 0.1021 and 0.1075.
Trade Setup (Educational Framework — Not Financial Advice)
Bias: Cautiously bullish while price holds above 0.1021 support and the rising trendline.
Entry Zone 1 – Breakout Continuation: 0.1065 – 0.1078 A momentum entry for traders comfortable buying strength, looking for a sustained close above 0.1075 with volume confirmation.
Entry Zone 2 – Pullback / Retest: 0.1021 – 0.1040 The more conservative entry — waiting for price to pull back into the flipped support zone or tag the rising trendline before continuing higher. This zone offers a tighter risk profile.
Target 1: 0.1100 Target 2: 0.1140 Target 3: 0.1180 (measured move objective, aligned with the upper visible range on the chart)
Stop Loss: Below 0.1005 (a close beneath the 0.1021 support and trendline confluence would invalidate the bullish setup)
Invalidation: A sustained close back below 0.1000 would suggest the reversal has failed, putting the Higher Low near 0.0935 back in play as downside support.
Live Price Check
Cross-referencing against live market data at the time of writing shows JST trading in the same broad vicinity as the chart's 0.1065 print, with some third-party sources lagging slightly due to feed delays — the chart's own timestamped price is used as the primary reference for this analysis.
Final Thoughts
JST has done the hard technical work: it broke a downtrend, printed a Higher Low, reclaimed a Lower High, and is now testing the exact level that started the sell-off in the first place. The next few candles at 0.1075 will likely set the tone for the coming sessions. Patient traders may prefer to let the breakout — or the retest — confirm itself before committing size.
Disclaimer: This article is for educational and informational purposes only and does not constitute financial, investment, or trading advice. Cryptocurrency markets are highly volatile and speculative. Always conduct your own research and risk management before making any trading decisions.
@Binance Square Official #SolanaFallsOver3% #USAugADPJobsSmallestGainSinceJan #SaudiSaysIranAttackedShipInHormuz #Binance #ChartSniper
78
·
--
📈 $OP USDT — LONG SWING SETUP
OP is trading around $0.096–0.097, with momentum turning bullish after a strong intraday move. Technical indicators remain broadly neutral, so holding the current zone is key for continuation.
🟢 ENTRY: $0.0967
🛑 SL: $0.0920
🎯 TP1: $0.1010
🎯 TP2: $0.1060
🎯 TP3: $0.1120
⚡ Swing setup | Manage risk carefully.
⚠️ Not financial advice.
@Binance_Square_Official #ARBRises30%OnRobinhoodChainRevenue #Japan10YYieldHits3%FirstSince1996 #EtherETFsExtendInflowStreakTo11Days #Binance #ChartSniper
{future}(OPUSDT)
📈 $OP USDT — LONG SWING SETUP
OP is trading around $0.096–0.097, with momentum turning bullish after a strong intraday move. Technical indicators remain broadly neutral, so holding the current zone is key for continuation.
🟢 ENTRY: $0.0967
🛑 SL: $0.0920
🎯 TP1: $0.1010
🎯 TP2: $0.1060
🎯 TP3: $0.1120
⚡ Swing setup | Manage risk carefully.
⚠️ Not financial advice.
@Binance Square Official #ARBRises30%OnRobinhoodChainRevenue #Japan10YYieldHits3%FirstSince1996 #EtherETFsExtendInflowStreakTo11Days #Binance #ChartSniper
OP is trading around $0.096–0.097, with momentum turning bullish after a strong intraday move. Technical indicators remain broadly neutral, so holding the current zone is key for continuation.
🟢 ENTRY: $0.0967
🛑 SL: $0.0920
🎯 TP1: $0.1010
🎯 TP2: $0.1060
🎯 TP3: $0.1120
⚡ Swing setup | Manage risk carefully.
⚠️ Not financial advice.
@Binance Square Official #ARBRises30%OnRobinhoodChainRevenue #Japan10YYieldHits3%FirstSince1996 #EtherETFsExtendInflowStreakTo11Days #Binance #ChartSniper
1
132
·
--
📈 $BTR USDT — BUY SWING SETUP
BTR is highly volatile after a massive move, with price around $0.08975. Momentum remains strong, but a pullback/retest is possible. Holding above the $0.08925 invalidation keeps the swing setup active.
🟢 ENTRY: $0.08975
🛑 SL: $0.08925
🎯 TP1: $0.1000
🎯 TP2: $0.1150
🎯 TP3: $0.1300
⚡ Risk: 1% | Swing
⚠️ Not financial advice. Manage risk carefully.
@Binance_Square_Official #ARBRises30%OnRobinhoodChainRevenue #Japan10YYieldHits3%FirstSince1996 #WTIOilRisesAsOpenInterestShrinks #Binance #ChartSniper
{future}(BTRUSDT)
📈 $BTR USDT — BUY SWING SETUP
BTR is highly volatile after a massive move, with price around $0.08975. Momentum remains strong, but a pullback/retest is possible. Holding above the $0.08925 invalidation keeps the swing setup active.
🟢 ENTRY: $0.08975
🛑 SL: $0.08925
🎯 TP1: $0.1000
🎯 TP2: $0.1150
🎯 TP3: $0.1300
⚡ Risk: 1% | Swing
⚠️ Not financial advice. Manage risk carefully.
@Binance Square Official #ARBRises30%OnRobinhoodChainRevenue #Japan10YYieldHits3%FirstSince1996 #WTIOilRisesAsOpenInterestShrinks #Binance #ChartSniper
BTR is highly volatile after a massive move, with price around $0.08975. Momentum remains strong, but a pullback/retest is possible. Holding above the $0.08925 invalidation keeps the swing setup active.
🟢 ENTRY: $0.08975
🛑 SL: $0.08925
🎯 TP1: $0.1000
🎯 TP2: $0.1150
🎯 TP3: $0.1300
⚡ Risk: 1% | Swing
⚠️ Not financial advice. Manage risk carefully.
@Binance Square Official #ARBRises30%OnRobinhoodChainRevenue #Japan10YYieldHits3%FirstSince1996 #WTIOilRisesAsOpenInterestShrinks #Binance #ChartSniper
157
·
--
📉 $LINK USDT — SHORT SETUP
LINK is around $11.22, slightly recovering intraday but down ~2.5% over 7D. Price is facing resistance near $11.50–11.55, while $11.30 is key support. A rejection can trigger another leg down.
🔴 SHORT ENTRY: $11.22
🛑 SL: $11.60
🎯 TP1: $11.00
🎯 TP2: $10.80
🎯 TP3: $10.50
⚡ Entry can be taken at current market price.
⚠️ Not financial advice. Manage risk carefully.
@Binance_Square_Official #ARBRises30%OnRobinhoodChainRevenue #Japan10YYieldHits3%FirstSince1996 #WTIOilRisesAsOpenInterestShrinks #Binance #ChartSniper
{future}(LINKUSDT)
📉 $LINK USDT — SHORT SETUP
LINK is around $11.22, slightly recovering intraday but down ~2.5% over 7D. Price is facing resistance near $11.50–11.55, while $11.30 is key support. A rejection can trigger another leg down.
🔴 SHORT ENTRY: $11.22
🛑 SL: $11.60
🎯 TP1: $11.00
🎯 TP2: $10.80
🎯 TP3: $10.50
⚡ Entry can be taken at current market price.
⚠️ Not financial advice. Manage risk carefully.
@Binance Square Official #ARBRises30%OnRobinhoodChainRevenue #Japan10YYieldHits3%FirstSince1996 #WTIOilRisesAsOpenInterestShrinks #Binance #ChartSniper
LINK is around $11.22, slightly recovering intraday but down ~2.5% over 7D. Price is facing resistance near $11.50–11.55, while $11.30 is key support. A rejection can trigger another leg down.
🔴 SHORT ENTRY: $11.22
🛑 SL: $11.60
🎯 TP1: $11.00
🎯 TP2: $10.80
🎯 TP3: $10.50
⚡ Entry can be taken at current market price.
⚠️ Not financial advice. Manage risk carefully.
@Binance Square Official #ARBRises30%OnRobinhoodChainRevenue #Japan10YYieldHits3%FirstSince1996 #WTIOilRisesAsOpenInterestShrinks #Binance #ChartSniper
89
·
--
📊 $OP USDT — TECHNICAL SETUP
OP is trading around $0.0903, with price sitting near a key psychological support at $0.0900. The market remains highly volatile, so reclaiming $0.0920 would strengthen bullish momentum.
🟢 LONG ENTRY: $0.0903
🛑 SL: $0.0870
🎯 TP1: $0.0940
🎯 TP2: $0.0980
🎯 TP3: $0.1030
⚡ Entry: Current market price.
⚠️ Not financial advice. Manage risk carefully.
@Binance_Square_Official #RussiaStartsLargeScaleDigitalRubleRolloutSep1 #BitcoinUp23%InAugustOutperformingGoldAndStocks #SaylorHintsStrategyBitcoinBuy #Binance #ChartSniper
{future}(OPUSDT)
📊 $OP USDT — TECHNICAL SETUP
OP is trading around $0.0903, with price sitting near a key psychological support at $0.0900. The market remains highly volatile, so reclaiming $0.0920 would strengthen bullish momentum.
🟢 LONG ENTRY: $0.0903
🛑 SL: $0.0870
🎯 TP1: $0.0940
🎯 TP2: $0.0980
🎯 TP3: $0.1030
⚡ Entry: Current market price.
⚠️ Not financial advice. Manage risk carefully.
@Binance Square Official #RussiaStartsLargeScaleDigitalRubleRolloutSep1 #BitcoinUp23%InAugustOutperformingGoldAndStocks #SaylorHintsStrategyBitcoinBuy #Binance #ChartSniper
OP is trading around $0.0903, with price sitting near a key psychological support at $0.0900. The market remains highly volatile, so reclaiming $0.0920 would strengthen bullish momentum.
🟢 LONG ENTRY: $0.0903
🛑 SL: $0.0870
🎯 TP1: $0.0940
🎯 TP2: $0.0980
🎯 TP3: $0.1030
⚡ Entry: Current market price.
⚠️ Not financial advice. Manage risk carefully.
@Binance Square Official #RussiaStartsLargeScaleDigitalRubleRolloutSep1 #BitcoinUp23%InAugustOutperformingGoldAndStocks #SaylorHintsStrategyBitcoinBuy #Binance #ChartSniper
147
·
--
📊 $ONG USDT — TECHNICAL SETUP
ONG is around $0.1061, down ~13.9% today after rejecting $0.1243. Price is near the $0.104 support, while momentum has turned sharply bearish. A rebound from support could offer a quick long setup.
🟢 LONG ENTRY: $0.1061
🛑 SL: $0.1010
🎯 TP1: $0.1120
🎯 TP2: $0.1180
🎯 TP3: $0.1240
⚡ Entry: Current market price.
⚠️ Not financial advice. Manage risk carefully.
@Binance_Square_Official #RussiaStartsLargeScaleDigitalRubleRolloutSep1 #BitcoinUp23%InAugustOutperformingGoldAndStocks #SaylorHintsStrategyBitcoinBuy #Binance #ChartSniper
{future}(ONGUSDT)
📊 $ONG USDT — TECHNICAL SETUP
ONG is around $0.1061, down ~13.9% today after rejecting $0.1243. Price is near the $0.104 support, while momentum has turned sharply bearish. A rebound from support could offer a quick long setup.
🟢 LONG ENTRY: $0.1061
🛑 SL: $0.1010
🎯 TP1: $0.1120
🎯 TP2: $0.1180
🎯 TP3: $0.1240
⚡ Entry: Current market price.
⚠️ Not financial advice. Manage risk carefully.
@Binance Square Official #RussiaStartsLargeScaleDigitalRubleRolloutSep1 #BitcoinUp23%InAugustOutperformingGoldAndStocks #SaylorHintsStrategyBitcoinBuy #Binance #ChartSniper
ONG is around $0.1061, down ~13.9% today after rejecting $0.1243. Price is near the $0.104 support, while momentum has turned sharply bearish. A rebound from support could offer a quick long setup.
🟢 LONG ENTRY: $0.1061
🛑 SL: $0.1010
🎯 TP1: $0.1120
🎯 TP2: $0.1180
🎯 TP3: $0.1240
⚡ Entry: Current market price.
⚠️ Not financial advice. Manage risk carefully.
@Binance Square Official #RussiaStartsLargeScaleDigitalRubleRolloutSep1 #BitcoinUp23%InAugustOutperformingGoldAndStocks #SaylorHintsStrategyBitcoinBuy #Binance #ChartSniper
1
186
·
--
📈 $KAT USDT — LONG TECHNICAL SETUP
KAT is trading around $0.0047, with price holding near the $0.0046–0.0047 support area. Short-term momentum is attempting a recovery, but confirmation above $0.0048 would strengthen the setup.
🟢 LONG ENTRY: $0.00470
🛑 SL: $0.00440
🎯 TP1: $0.00495
🎯 TP2: $0.00520
🎯 TP3: $0.00550
⚡ Entry: Current market price.
⚠️ Not financial advice. Manage risk carefully.
@Binance_Square_Official #RussiaStartsLargeScaleDigitalRubleRolloutSep1 #BitcoinUp23%InAugustOutperformingGoldAndStocks #SaylorHintsStrategyBitcoinBuy #Binance #ChartSniper
{future}(KATUSDT)
📈 $KAT USDT — LONG TECHNICAL SETUP
KAT is trading around $0.0047, with price holding near the $0.0046–0.0047 support area. Short-term momentum is attempting a recovery, but confirmation above $0.0048 would strengthen the setup.
🟢 LONG ENTRY: $0.00470
🛑 SL: $0.00440
🎯 TP1: $0.00495
🎯 TP2: $0.00520
🎯 TP3: $0.00550
⚡ Entry: Current market price.
⚠️ Not financial advice. Manage risk carefully.
@Binance Square Official #RussiaStartsLargeScaleDigitalRubleRolloutSep1 #BitcoinUp23%InAugustOutperformingGoldAndStocks #SaylorHintsStrategyBitcoinBuy #Binance #ChartSniper
KAT is trading around $0.0047, with price holding near the $0.0046–0.0047 support area. Short-term momentum is attempting a recovery, but confirmation above $0.0048 would strengthen the setup.
🟢 LONG ENTRY: $0.00470
🛑 SL: $0.00440
🎯 TP1: $0.00495
🎯 TP2: $0.00520
🎯 TP3: $0.00550
⚡ Entry: Current market price.
⚠️ Not financial advice. Manage risk carefully.
@Binance Square Official #RussiaStartsLargeScaleDigitalRubleRolloutSep1 #BitcoinUp23%InAugustOutperformingGoldAndStocks #SaylorHintsStrategyBitcoinBuy #Binance #ChartSniper
61
·
--
📊 $BANK USDT — TECHNICAL SETUP
BANK is around 0.0358, up ~2.3% today, but TradingView’s technical rating remains Sell. Price is testing the 0.0361 resistance after bouncing from 0.0349.
🟢 LONG ENTRY: 0.0358
🛑 SL: 0.0348
🎯 TP1: 0.0368
🎯 TP2: 0.0378
🎯 TP3: 0.0390
⚡ Entry is executable at current price.
⚠️ Not financial advice. Manage risk carefully.
@Binance_Square_Official #RussiaStartsLargeScaleDigitalRubleRolloutSep1 #BitcoinUp23%InAugustOutperformingGoldAndStocks #SaylorHintsStrategyBitcoinBuy #Binance #ChartSniper
{future}(BANKUSDT)
📊 $BANK USDT — TECHNICAL SETUP
BANK is around 0.0358, up ~2.3% today, but TradingView’s technical rating remains Sell. Price is testing the 0.0361 resistance after bouncing from 0.0349.
🟢 LONG ENTRY: 0.0358
🛑 SL: 0.0348
🎯 TP1: 0.0368
🎯 TP2: 0.0378
🎯 TP3: 0.0390
⚡ Entry is executable at current price.
⚠️ Not financial advice. Manage risk carefully.
@Binance Square Official #RussiaStartsLargeScaleDigitalRubleRolloutSep1 #BitcoinUp23%InAugustOutperformingGoldAndStocks #SaylorHintsStrategyBitcoinBuy #Binance #ChartSniper
BANK is around 0.0358, up ~2.3% today, but TradingView’s technical rating remains Sell. Price is testing the 0.0361 resistance after bouncing from 0.0349.
🟢 LONG ENTRY: 0.0358
🛑 SL: 0.0348
🎯 TP1: 0.0368
🎯 TP2: 0.0378
🎯 TP3: 0.0390
⚡ Entry is executable at current price.
⚠️ Not financial advice. Manage risk carefully.
@Binance Square Official #RussiaStartsLargeScaleDigitalRubleRolloutSep1 #BitcoinUp23%InAugustOutperformingGoldAndStocks #SaylorHintsStrategyBitcoinBuy #Binance #ChartSniper
1
231
·
--
📈 $TNSR USDT — LONG TECHNICAL SETUP
TNSR is around $0.0363, down ~10% in 24H. Price is near the $0.0360 support, while momentum is mixed: short-term indicators show weakness, but broader moving averages remain constructive.
🟢 LONG ENTRY: $0.0363
🛑 SL: $0.0345
🎯 TP1: $0.0380
🎯 TP2: $0.0400
🎯 TP3: $0.0420
⚠️ Below $0.0345 invalidates the setup.
Not financial advice. Manage risk carefully.
@Binance_Square_Official #RussiaStartsLargeScaleDigitalRubleRolloutSep1 #BitcoinUp23%InAugustOutperformingGoldAndStocks #SaylorHintsStrategyBitcoinBuy #Binance #ChartSniper
{future}(TNSRUSDT)
📈 $TNSR USDT — LONG TECHNICAL SETUP
TNSR is around $0.0363, down ~10% in 24H. Price is near the $0.0360 support, while momentum is mixed: short-term indicators show weakness, but broader moving averages remain constructive.
🟢 LONG ENTRY: $0.0363
🛑 SL: $0.0345
🎯 TP1: $0.0380
🎯 TP2: $0.0400
🎯 TP3: $0.0420
⚠️ Below $0.0345 invalidates the setup.
Not financial advice. Manage risk carefully.
@Binance Square Official #RussiaStartsLargeScaleDigitalRubleRolloutSep1 #BitcoinUp23%InAugustOutperformingGoldAndStocks #SaylorHintsStrategyBitcoinBuy #Binance #ChartSniper
TNSR is around $0.0363, down ~10% in 24H. Price is near the $0.0360 support, while momentum is mixed: short-term indicators show weakness, but broader moving averages remain constructive.
🟢 LONG ENTRY: $0.0363
🛑 SL: $0.0345
🎯 TP1: $0.0380
🎯 TP2: $0.0400
🎯 TP3: $0.0420
⚠️ Below $0.0345 invalidates the setup.
Not financial advice. Manage risk carefully.
@Binance Square Official #RussiaStartsLargeScaleDigitalRubleRolloutSep1 #BitcoinUp23%InAugustOutperformingGoldAndStocks #SaylorHintsStrategyBitcoinBuy #Binance #ChartSniper
161
Log in to explore more content
Join global crypto users on Binance Square
⚡️ Get latest and useful information about crypto.
💬 Trusted by the world’s largest crypto exchange.
👍 Discover real insights from verified creators.
Email / Phone number
Trending Topics
SECApprovesNasdaqTexasCommodityTrustRule
11 views
40 Discussing
#secapprovesnasdaqtexascommoditytrustrule
🚨 SEC JUST OPENED ANOTHER DOOR FOR CRYPTO! 🇺🇸🔥
The SEC approved Nasdaq Texas’ updated rules for crypto commodity-trust products, creating a clearer framework for digital commodities and allowing more flexibility for crypto investment products.
The approved framework specifically uses $BTC , $ETH , $SOL and XRP as examples of assets meeting the relevant eligibility requirements. 👀
It also allows up to 15% of a trust’s NAV in certain assets that don't meet the standard eligibility tests.
🔥 More regulatory clarity
🔥 More flexibility for crypto ETPs
🔥 More potential institutional access
This could be another step toward deeper Wall Street + crypto integration. 🚀
#bitcoin #xrp #crypto
Faizan Crypto Learner
·0 Likes
·90 views
ECBRaisesRatesSecondTimeTo2.5%
26 views
23 Discussing
USContinuingJoblessClaims1.774M
1,449 views
124 Discussing