

1. BTC-ahr999 Hoarding Index

This index is used to assess Bitcoin's price and determine the appropriate time to buy. A value below 0.45 indicates a bargain hunting range; 0.45-1.2 indicates a fixed investment range; 1.2-5 indicates a bull market; and >5 indicates a high-risk range. The current value is 0.82, which is in the fixed investment range.
2. Two-year MA multiplier indicator

The indicator shows that Bitcoin is below the green line and is still in the bottom-picking area in the long term.
Note: The 2-Year MA Multiplier indicator is intended to be used as a long-term investment tool, and it highlights periods when buying and selling Bitcoin would produce outsized returns. To do this, it uses the 2-Year Moving Average (730-day equivalent, green line), and the 5-fold product of that moving average (red line). Historically: When the price falls below the 2-Year MA (green line), it is a buy signal to buy the dip, and buying Bitcoin will produce excess returns.
3. Proportion of holdings with a maturity greater than 1 year

The highest level of this data in the last cycle was 65.93%, the most recent high was 68.25%, and the current level is 67.59% (according to historical rules, less than 45% is a high-risk area).

The proportion of coins held with a current value of more than 6 months was 77% at the bottom of 2015 and 70% at the bottom of 2019. The highest value in this bear market was around 79%, and is currently 71.81%.
4. MVRV indicator

The indicator is near 0.74, having left the super-bottom zone (above 7 indicates high risk, below 0.1 indicates a super-bottom). MVRV is a relative metric, representing the ratio of market capitalization (MV) to realized value (RV). First proposed by Murad Mahmudov and David Puell, its expression is: MVRV = MV / RV. Realized Cap is based on the UTXO model and calculates the sum of the "last movement value" of all coins on the chain. Compared to market capitalization (current circulating supply * market price), RV offers the following advantages:
Reduces the impact of out-of-circulation (or lost) portions
Taking into account the market value of each coin flowing on the chain
Can indirectly reflect the chip cost of long-term holders
A high MVRV ratio (>1.0, orange) indicates a significant level of unrealized profits within the system. Historically, readings above 3.0 have signaled an overheated bull market.
A falling MVRV ratio (blue) indicates declining systemic profitability. This is the result of falling prices (lower market capitalization) and Bitcoin redistribution, as participants profit and sell Bitcoin acquired at lower prices to new sellers at higher prices (higher realized value). This mechanism led to a significant bearish divergence between April and November 2021 (shown in blue).
A low MVRV ratio (<1.0, red) means the market price is below the average purchase price by participants on-chain. This is typical of the late stages of a bear market and is often associated with bottom formation and accumulation.
5. NUPL indicator

The indicator rebounded near the "optimistic" zone. The NUPL indicator was invented by Adamant Capital, a market research firm and Bitcoin investment institution, and further refined by data scientist Rafael Schultze-Kraft. The basic algorithm is to calculate the difference between Bitcoin's market value and its realized value (the dollar value of the token at the time of its last movement on the blockchain), divided by the market value. Rafael believes that by setting different thresholds for the NUPL value, it is possible to clearly distinguish the current state of the cycle.
Indicator formula:
NUPL = Relative Unrealized Profit - Relative Unrealized Loss
or
NUPL = (Current coin market value - Realized coin value) / Current coin market value
6. Puell Multiple

The green area is a buy signal and the red area is a sell signal. It has now rebounded from the buy zone to the neutral zone.
Metric Overview: Value of Bitcoin mined on a given day divided by the 365-day moving average. The Puell Multiple is calculated by dividing the daily value of token issuance (in USD) by the 365-day moving average of that value. Daily issuance refers to the amount of new tokens added to the ecosystem by miners, who receive them as block rewards. Miners typically cover mining costs by selling tokens on the market.
7. CVDD coin-day destruction indicator
When an on-chain transaction occurs, in addition to the transfer of coins, coin-days are also destroyed. Coin-days destroyed is the number of coins multiplied by the number of days they were held at a particular address before the transfer. For example, if two bitcoins are held at one address and transferred to another address after 10 days, 2 * 10 = 20 coin-days are destroyed. This doesn't mean the coins are completely gone, but rather a specific calculation. Coin-days are a concept unique to blockchain-based ledger currencies like Bitcoin; traditional assets don't have this metric. CVDD stands for Cumulative Value of Days Destroyed, which is the cumulative market value of coin-days destroyed, a mathematically processed cumulative market value associated with the movement of bitcoins.

Looking back at the data of previous cycles, the bottoms in 2012, 2015, and 2018 all appeared near the purple line. Currently, a rebound occurred after touching the bottom area (purple line).
RHODL indicator

The indicator rebounded from near the green buy zone, similar to the bottom of the previous bear market cycle.
Reserve Risk

The reserve risk indicator can reflect the confidence of long-term Bitcoin holders in the Bitcoin price at a specific time.
Investing in Bitcoin when confidence is high and price is low (green area) is riskier
returns; conversely, investing in Bitcoin when confidence is low and prices are high (red area) will result in losses.
The indicator shows that at the peak of this bull market, Bitcoin was still a long way from the red area (top signal). It is still at the bottom of the green buy area, below the level of 3.12.
Number of whale wallet addresses

In February 2022, the number of whales soared from 2100 to 2280 and then continued to decline. The last update was in 2018 and is currently 2030.
Amount of BTC held by institutional funds
Funds include European and Canadian Bitcoin ETFs as well as U.S. and Canadian closed-end funds.
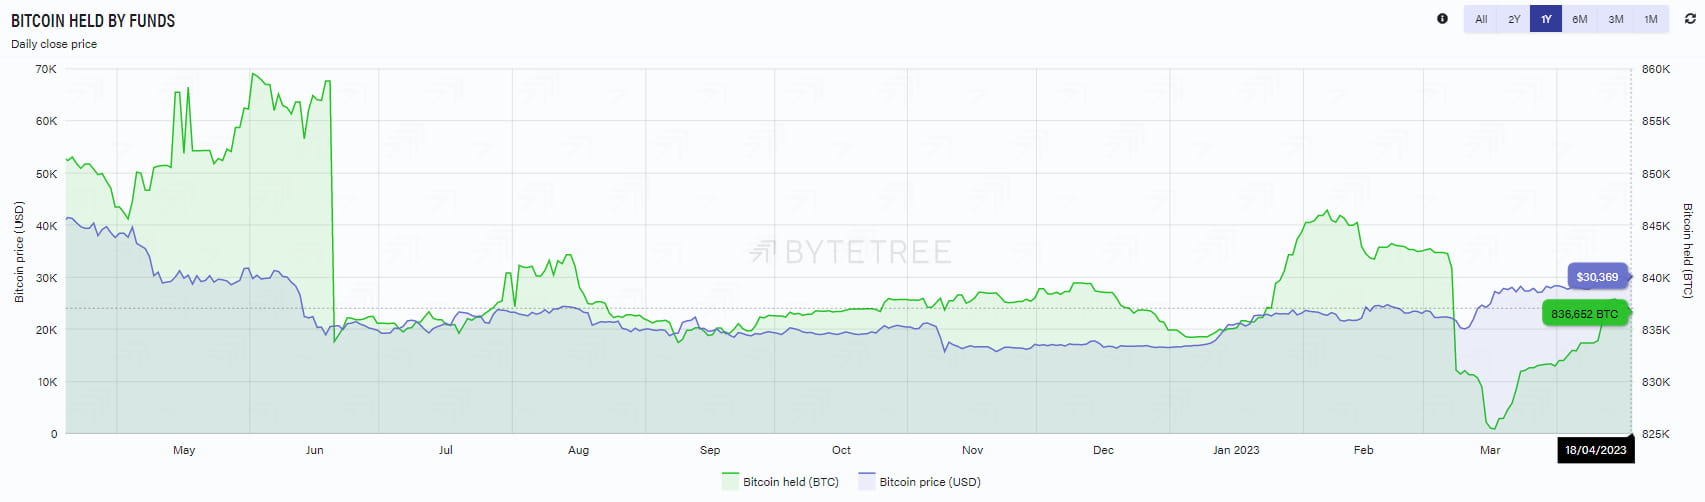
BTC institutional holdings: The previous historical high was around 860,000, the last updated data was 837,000, and the current data is 836,000.
ETH institutional holdings

ETH institutional holdings: The previous highest point was 4.51 million, the last update was 4.21 million, and the current data is 4.21 million.
机构产品表:Grayscale Ethereum Trust (ETHE), Ether Tracker Euro (COINETHE SS), Ether Tracker One / XBT PROVIDER ETHEREUM (COINETH SS), CoinShares Physical Ethereum (ETHE SW), WisdomTree Ethereum (ETHW SW), VanEck Vectors Ethereum ETN (VETH), ETC Group Physical Ethereum (ZETH), SA1 Ethereum ETP (SETH SW), 21Shares Ethereum ETP (AETH), CI Galaxy Ethereum ETF (US$ Series) (ETHX/U), CI Galaxy Ethereum ETF (C$ Unhedged Series) (ETHX /B)
Total stablecoin circulation

From June to the end of July 2021, the growth rate of the total circulation of stablecoins slowed down, and began to rise in August. Since 2022, it has experienced a continuous downward trend.
BTC and ETH exchange balances

The last data on the BTC exchange balance was 957,000, and the current data is 967,000.

The last data on the ETH exchange balance was 9.07 million, and the current data is 9.12 million.
Google Search Index
BTC search popularity in the past five years:

ETH search popularity in the past five years:

Recently, ETH's popularity is higher than BTC
Jiang Zhuoer's 60-day cumulative BTC increase

This indicator believes that when a bull market reaches its end and market sentiment becomes fanatical, the bubble is serious, and the short-term price increase exceeds the entry of new entrants and new funds, the bull market bubble will burst and a bear market will begin.
At the peaks of the two bull markets in 2013 and 2017, this indicator was 237% and 134%, respectively. During this bull market, when Bitcoin reached $47,000, the indicator peaked at 108%. However, when it continued to rise to $64,000, the indicator dropped to 34%. Currently, the indicator is -12.78%.
Total BTC held by listed companies

The total number of BTC held by listed companies has decreased from its peak.
Bitcoin Rainbow Ribbon

The indicator rose from the "buy zone" to the "hold zone".
[Note:] The rainbow chart is intended to be a way to observe long-term price changes without considering the "noise" of daily fluctuations. The color band follows a logarithmic regression. This index is used to assess the price sentiment range of Bitcoin and determine the appropriate time to buy. The closer the price of the coin is to the bottom of the rainbow band, the greater the investment value; the closer the price of the coin is to the top of the rainbow band, the bigger the bubble is, and you need to pay attention to the risks.
Ethereum Rainbow Ribbon

Ethereum is near the dividing line between the "low-price sell-off zone" and the "undervalued zone".
Other indicators:

Judging from the recent BTC selling pressure data, it is most likely that this selling pressure is due to profit-takers reducing their holdings, and the possibility of it being concentrated between $26,000 and $28,000 is even higher.
From a macro perspective, some analysts believe that the UK's excessively high inflation triggered the exodus of European investors, and there seems to be a connection in terms of timing. The main reason is that although the UK's CPI annual and monthly rates are lower than the previous values, they are higher than expected, which may trigger market concerns about the European Central Bank's continued interest rate hikes.
[Note: The above indicators are the latest data available on April 20, 2023]