Yield Guild Games (YGG)
This analysis visualizes the flow of capital into and out of YGG within one hour. The graphic and data show buying and selling activity, broken down by the size of the trader large, medium, and small. This offers an immediate view of market sentiment and helps understand who is providing liquidity and where the pressure is on the buy side or the sell side.
🟢🟥 Circular Flow Breakdown: Buy vs Sell Activity
The donut chart at the top shows the percentage of YGG's transactional balance between inflow (buying) and outflow (selling).
Buy Side (Green) totals:
48.69% of the activity
Sell Side (Red) totals:
51.31% of the activity
This suggests that, in the last hour, selling slightly surpassed buying, creating a small net outflow of capital from YGG. The difference isn’t large, but it shows that sellers currently have a slight advantage, especially among smaller participants.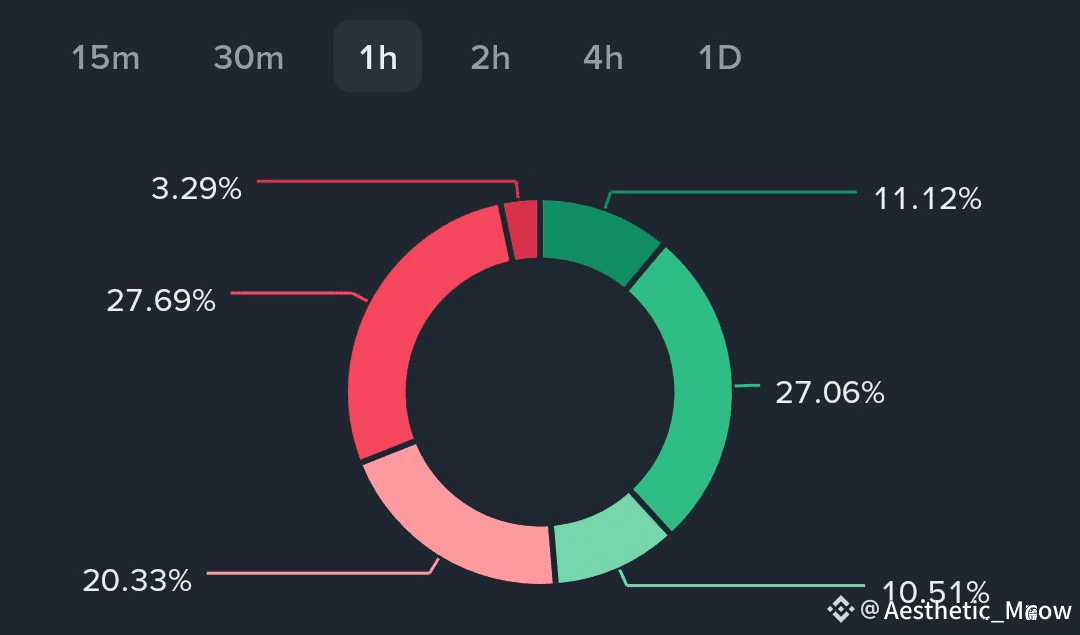
📦 Order Size Analysis: Who’s Buying, Who’s Selling?
Let’s look at how different trader groups have behaved:
🟩 Large Orders (Institutional or High-Cap Wallets)
Buys: 517,793 YGG
Sells: 153,145.80 YGG
Net Flow (Inflow): +364,647.20 YGG
🔹 Interpretation:
Large investors or institutional wallets are clearly accumulating. With buying volume more than three times higher than selling, this group has strong confidence in YGG at current prices. These are usually longer-term holders or strategic buyers.
🟨 Medium Orders (Active Traders, Smaller Funds)
Buys: 1.26M YGG
Sells: 1.29M YGG
Net Flow: −29,314.60 YGG
🔹 Interpretation:
Buying and selling are nearly equal in this segment, with a slight lean toward selling. This reflects a neutral to cautious outlook traders may be waiting for more information or making short-term adjustments.
🟥 Small Orders (Retail Traders, Individual Investors)
Buys: 489,516.40 YGG
Sells: 946,923.80 YGG
Net Flow: −457,407.40 YGG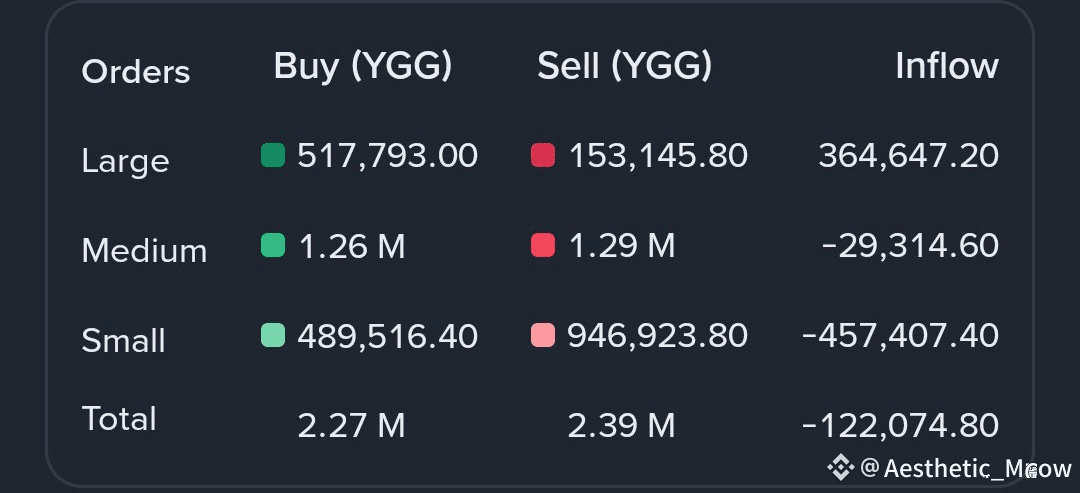
🔹 Interpretation:
Retail participants are showing clear signs of exiting. Selling is dominant here, almost double the buying activity. This suggests fear, uncertainty, or simply profit-taking, possibly in response to recent market changes.
🧮 Totals & Final Flow Summary
Total Buys: 2.27M YGG
Total Sells: 2.39M YGG
Overall Net Flow: −122,074.80 YGG
Despite strong buying from large entities, it wasn’t enough to completely offset the heavy selling by retail traders. The result: a moderate net capital outflow over this one-hour period.
📚 Educational Interpretation: What This Tells Us
1. Market Tone: Mildly Bearish
The balance slightly favors sellers, mainly driven by retail exits. This doesn’t mean a full bearish trend, but a short-term pullback or hesitation in market momentum.
2. Whales Buying the Dip
The large inflow from institutional or large wallets suggests smart money may be preparing for a rebound, buying at what they see as valuable prices.
3. Retail Traders Reacting Emotionally
Retail selling might be based on short-term volatility, rumors, or general unease in the market. This often contrasts with the more calculated actions of institutional players.
4. Strategic Insight
Experienced traders or analysts often see this as a bullish divergence where retail exits and whale accumulation happen at the same time, suggesting a possible reversal or underlying strength.
🧠 Final Thought
This one-hour snapshot shows a small capital outflow, but the difference between institutional accumulation and retail selling is important. This flow structure often comes before changes in price direction, especially if large wallets keep buying during dips. For a complete view, this should be combined with price chart trends, order book data, and flows over longer periods.
In conclusion:
Retail panic meets institutional patience. That’s always a signal to watch.
@Yield Guild Games #YGGPlay $YGG
