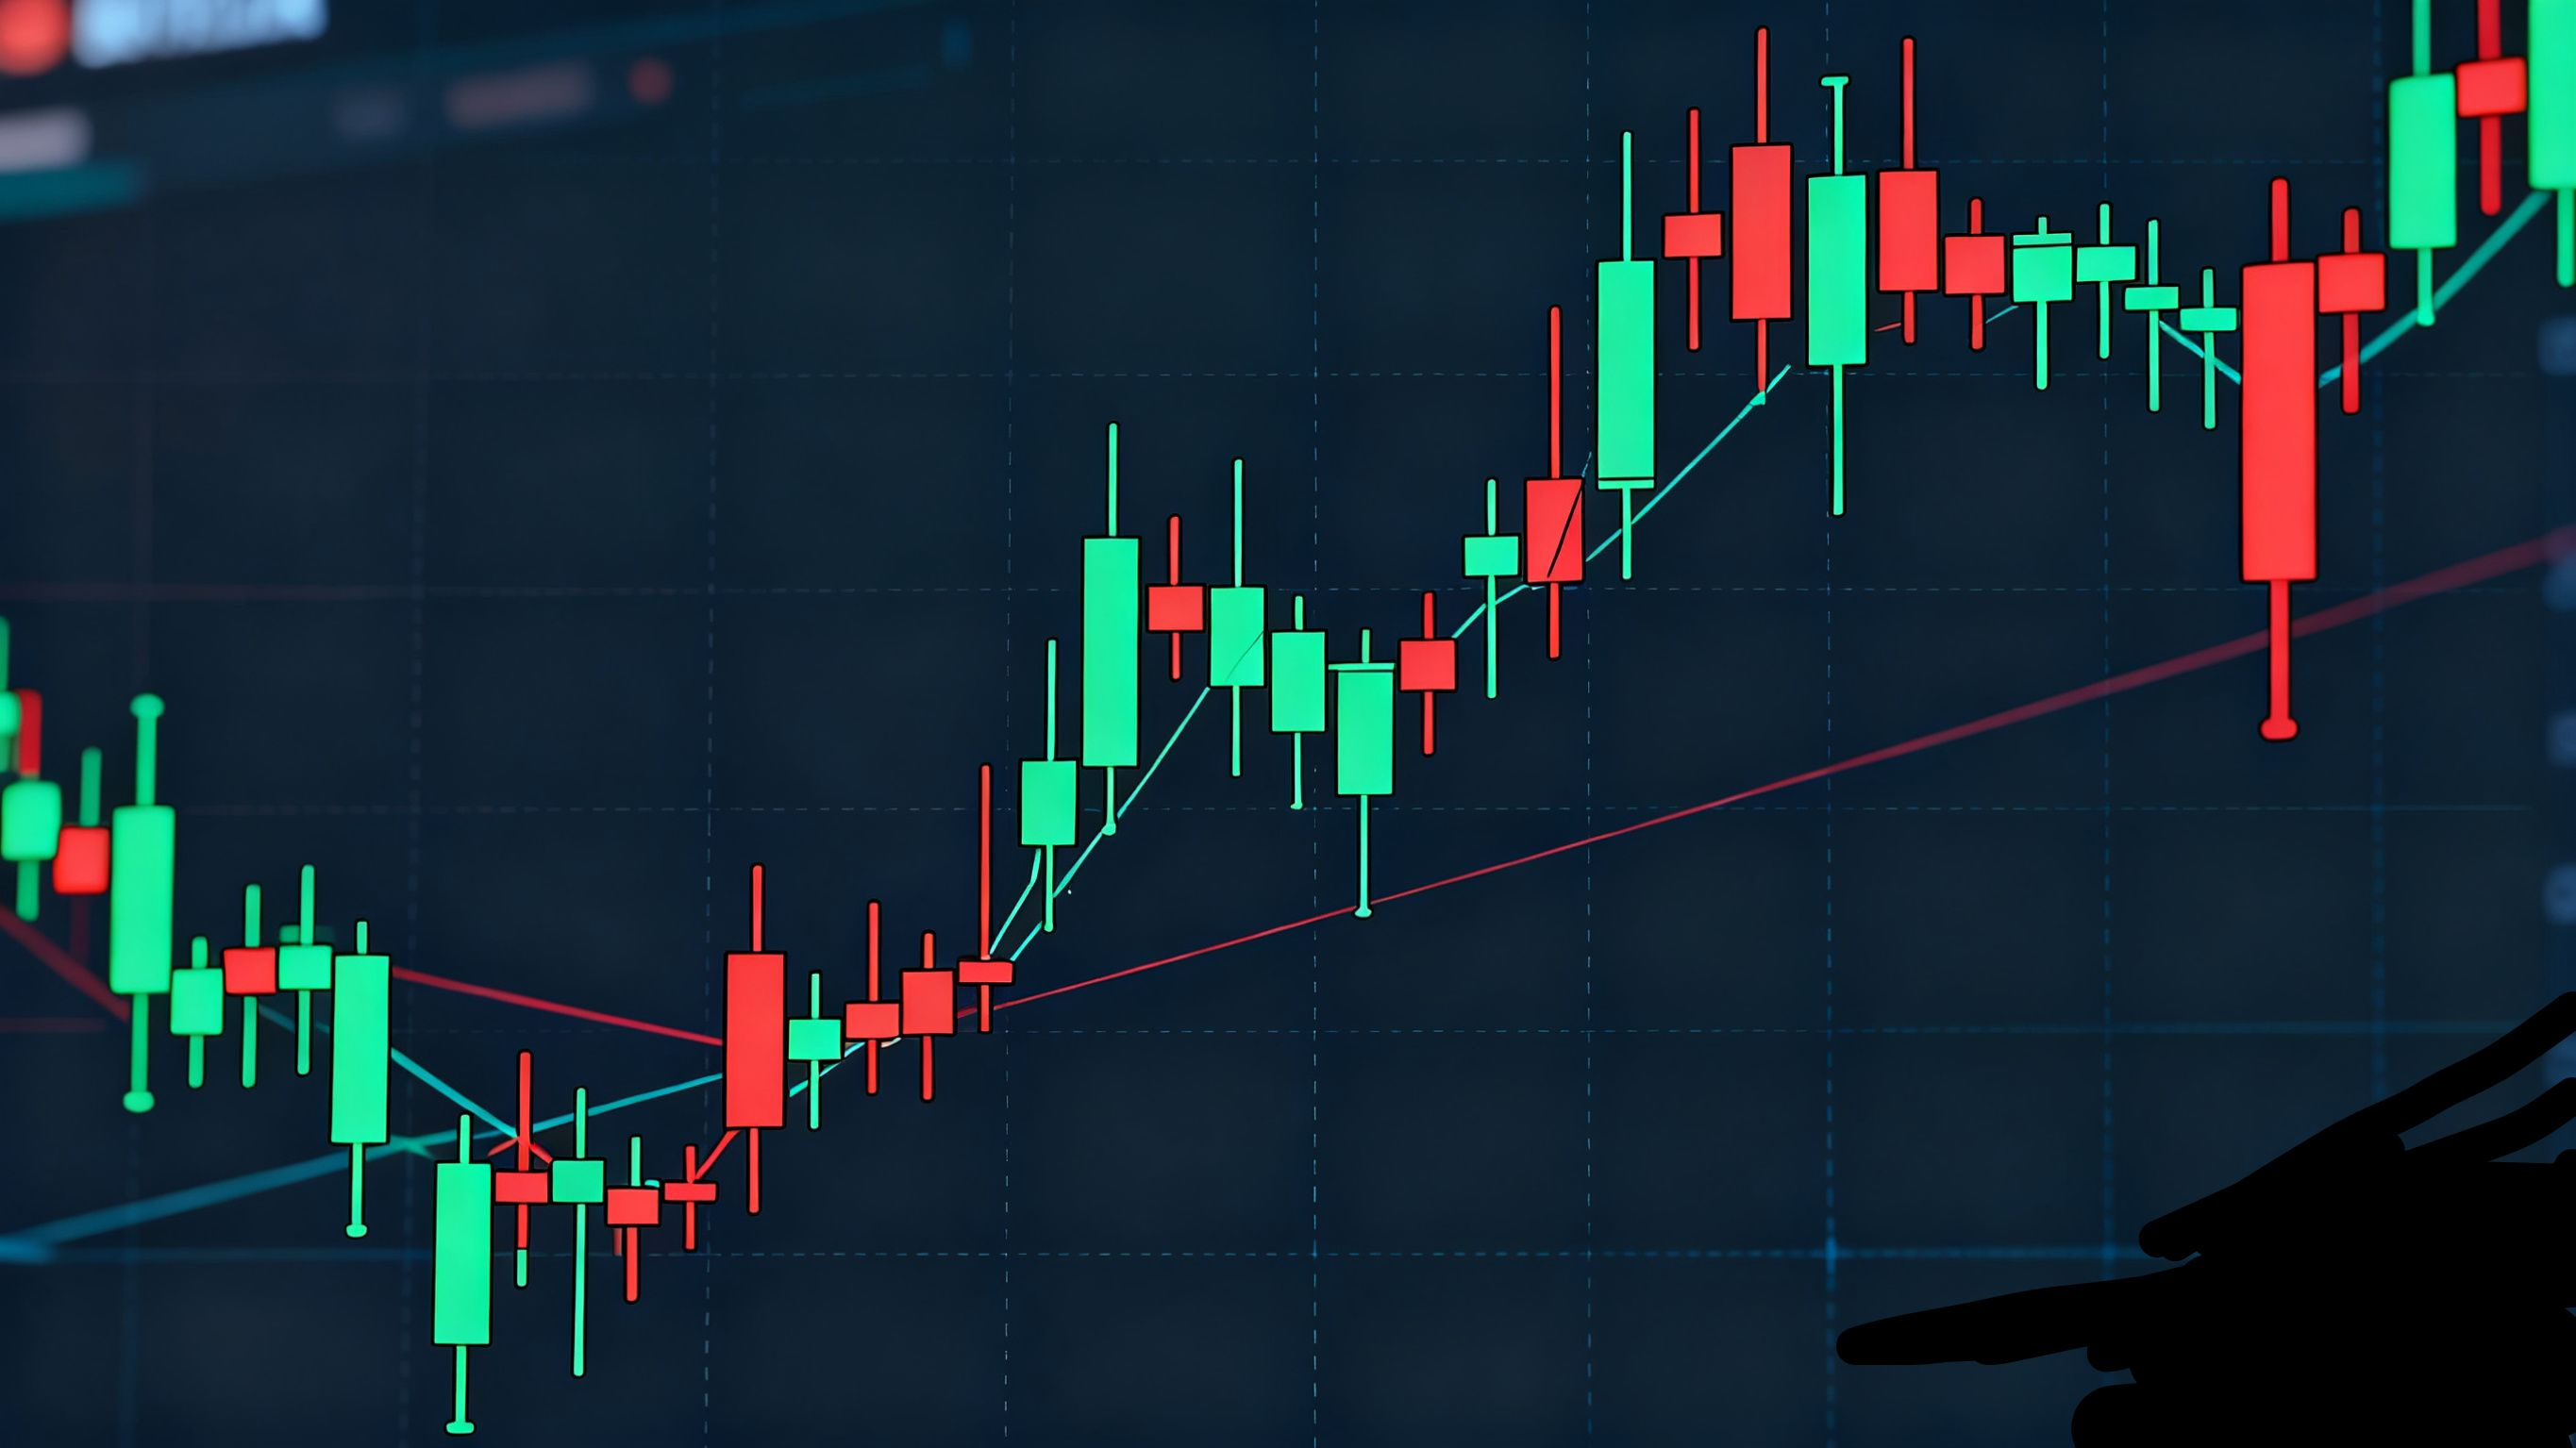
 This chart shows clear market sentiment shifts: from bullish momentum to a sharp decline, then early recovery. Here’s the breakdown:
1. Consolidation & Bullish Rise
Red and green candles traded in a tight range (consolidation), then long green candles signaled buyers took control, driving prices up.
2. Peak & Bearish Reversal
Prices peaked with long-bodied, short-wick candles (weakening buying pressure). A long red candle marked a reversal—sellers seized control, pushing prices down from a key level (blue circle).
3. Sharp Drop: Seller Dominance
Consecutive long red candles showed intense selling pressure, with prices breaking below a key support level (dotted line).
4. Early Recovery: Buyers Return
A long green candle with a long lower wick signaled recovery—prices dipped low but rebounded. The market then entered another consolidation phase.
Conclusion
Watch for consolidation phases, long candles as strength signals, and key support/resistance levels. Combine candlestick analysis with other tools and fundamentals. Crypto is volatile—always research and manage risk.
Disclaimer: For educational purposes only, not investment advice. Do your own research before trading.
#TradeCryptosOnX #bitcoin $BTC


