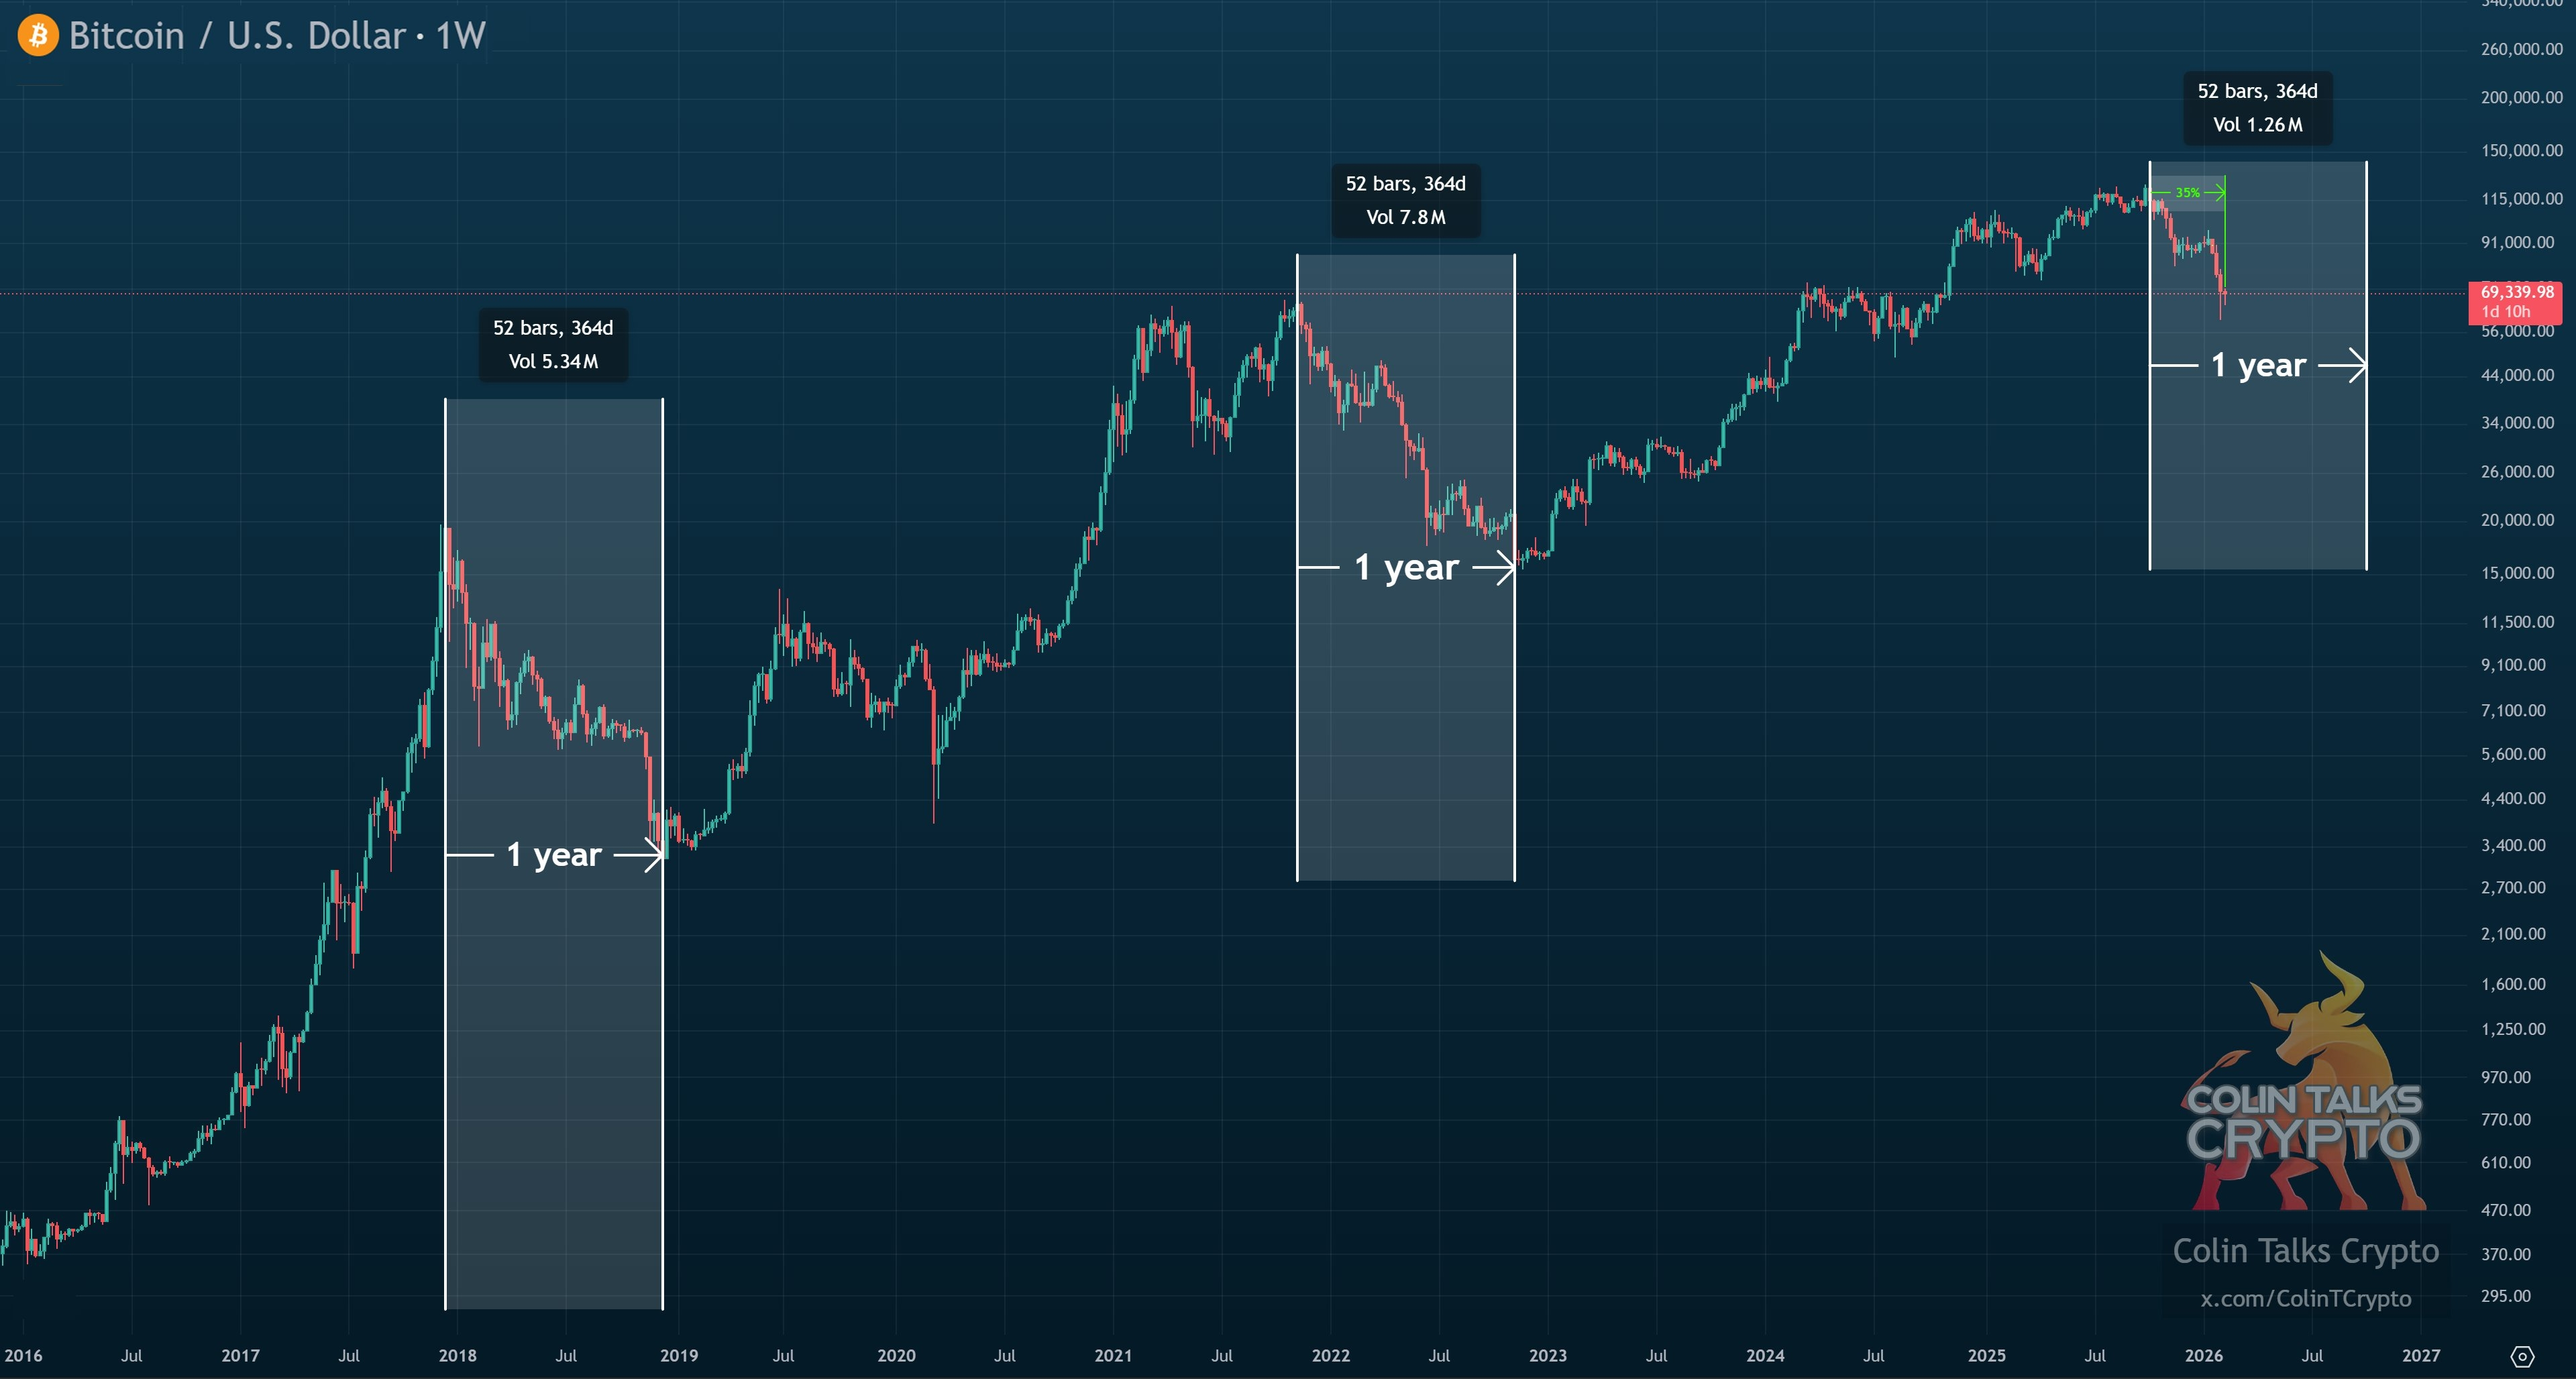
Since October 6, 2025, Bitcoin has been trading in what structurally qualifies as a bear market environment. That places the current downturn at just over four months in duration.
Historically, when analyzing prior macro drawdowns (2018 and 2022 cycles), the average bear market from peak to final bottom has lasted approximately one year — very close to 12 months from top formation to ultimate low.
If that historical rhythm were to repeat, the current cycle would be roughly 35% complete in terms of time.
Time matters.
While price captures attention, bear markets are often more about duration than magnitude. Capitulation, compression, distribution, and re-accumulation phases typically unfold gradually. By the time the broader market recognizes a bottoming structure, a significant portion of the recovery move has already occurred.
Potential Bottom Range
Based on prior retracement structures, liquidity pools, and macro support zones, a broad potential bottom range could reasonably fall between:
$32,000 – $60,000
If selecting a single midpoint estimate purely from a probabilistic perspective, the $49,000 region stands out as a technical confluence zone — but this remains a speculative projection, not a prediction.
The constructive takeaway: if the one-year historical pattern holds, we may already be deeper into the cycle than sentiment suggests.
Most participants realize the cycle shift late — both at tops and at bottoms.
This article is for informational purposes only and reflects personal market observations, not financial advice. Always conduct your own research before making investment decisions.
Follow for structured cycle analysis, macro timing insights, and objective crypto market breakdowns.