This chart is still carrying the weight of a larger downside impulse. The dominant move isn’t subtle: ETH sold off aggressively from the upper range, broke prior structure, and forced price into a new, lower regime. That matters, because everything happening now is a reaction to that damage, not a fresh trend yet.
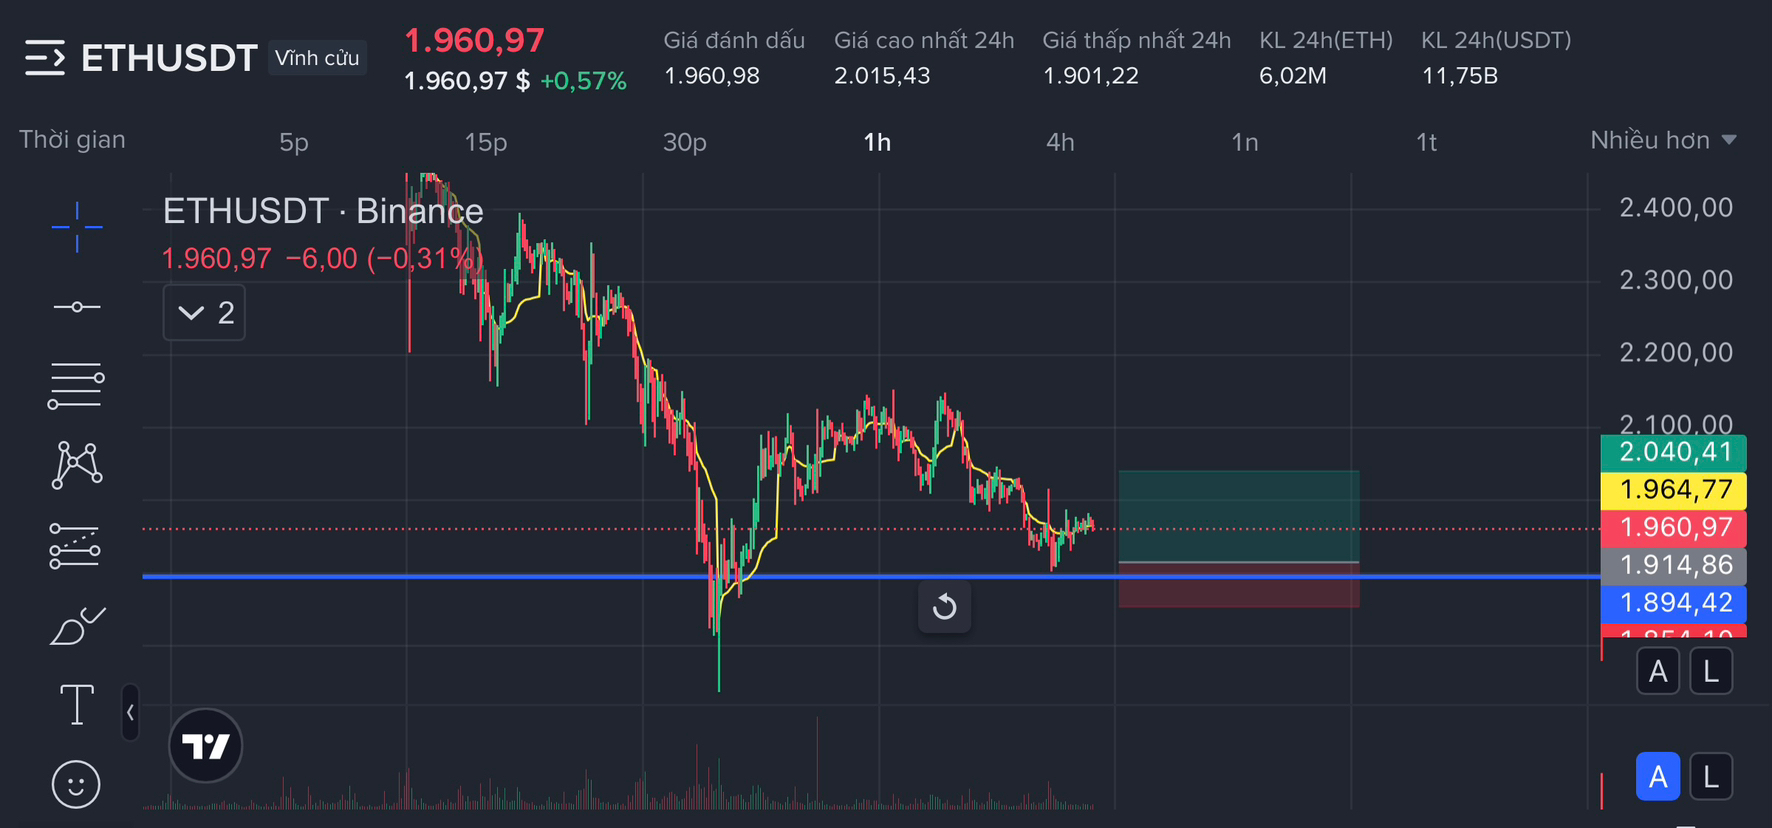
The most important feature on this chart is the blue horizontal level around 1,890–1,900. You can see it clearly acting as a demand reference. Price sold hard into it, flushed stops below, then snapped back with a sharp reaction. That wick isn’t random. It tells you sellers pressed too far, too fast, and got met by real buying interest — likely short covering mixed with responsive demand.
Since that bounce, ETH hasn’t impulsed higher. Instead, it’s grinding sideways and slightly down, compressing just above that same support. This is classic behavior when sellers fail to extend after a breakdown. Momentum has cooled, ranges have tightened, and price is spending time above the level it was supposed to lose. That’s information.
What’s also notable is the absence of aggressive continuation selling. After the initial selloff, every push lower has become more shallow. That usually reflects seller exhaustion, not strength. Shorts who entered late into the breakdown are now sitting on price that refuses to follow through. Meanwhile, dip buyers are defending the same zone repeatedly, building a visible line in the sand.
Above current price, the 1,960–2,040 zone is not clean air. That area was previously traded heavily during the breakdown and will act as overhead supply. Any upside attempt is likely to be contested there first. This is why upside needs to be treated as a reaction trade, not a trend reversal.
Right now, ETH is in a decision pocket:
• Lose 1,890 cleanly, and the market accepts lower value.
• Hold it, and pressure shifts onto trapped shorts who expected continuation.
That tension is what creates a tradable long — not because the market is bullish, but because downside has stalled exactly where it should have accelerated.
Trade Plan Long
Entry: 1,880 – 1,915
Stop Loss: 1,850
TP1: 1,960
TP2: 2,000
TP3: 2,040
Trade $ETH 👇

This long exists because ETH is holding above a clearly defended demand zone after a sharp selloff, while sellers are failing to regain control. The structure suggests absorption rather than continuation, and the grind near support increases pressure on short positioning. The trade stops making sense if price accepts below the demand base and accelerates, which would signal that the bid has stepped away and the market is ready to reprice lower.