Why the $65,000 Zone Could Define the Next Major Expansion
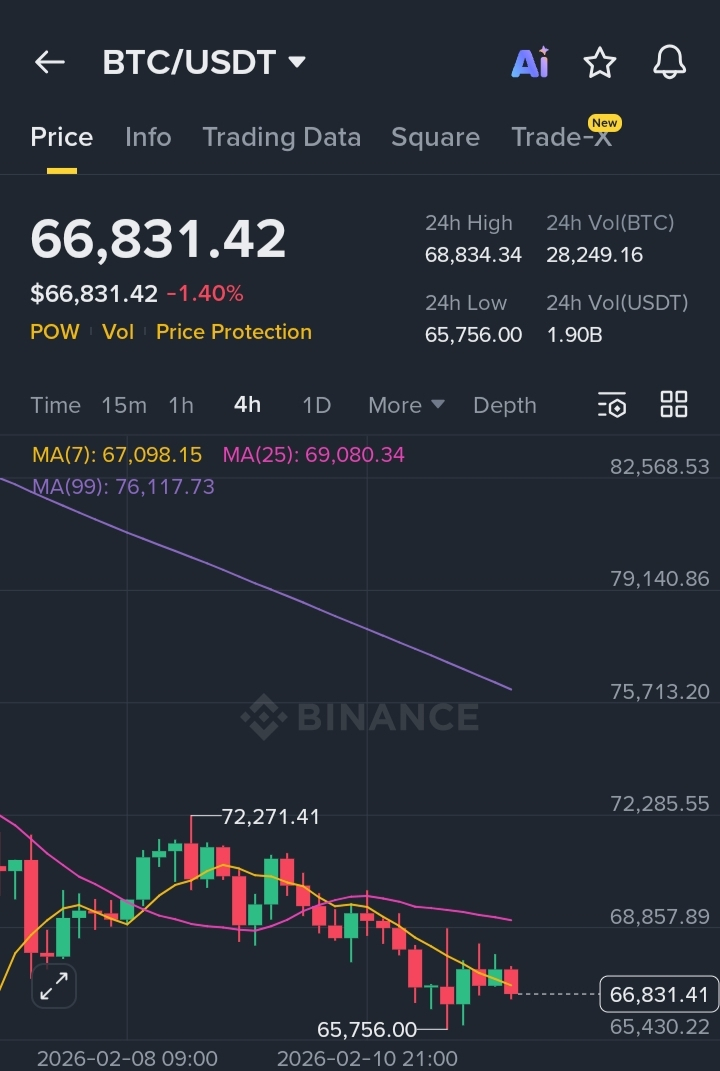
Bitcoin is currently trading near the $66,800 level following a rejection from the $72,200 resistance zone. The recent decline reflects a short term corrective movement within a broader consolidation structure rather than a confirmed trend reversal.
On the 4 hour timeframe, price action shows a transition from bullish momentum into a neutral to bearish short term bias. The formation of a lower high near $72,271 indicates temporary exhaustion in upside continuation. However, broader structural support levels remain intact, and no major macro breakdown has occurred.
The market is now positioned near the $65,000 support region, which serves as a key technical reference point for near term direction.
Bitcoin is currently trading below its short-term moving averages (MA7 and MA25), indicating weakening short-term momentum. These averages are beginning to flatten, suggesting reduced trend strength rather than aggressive downside acceleration.
The MA99 remains positioned significantly above the current price, reflecting that the larger timeframe structure remains within a broader consolidation range. This alignment suggests that the recent pullback may represent a corrective phase rather than the start of a sustained bearish cycle.
Price compression between $72,000 resistance and $65,000 support has narrowed volatility. Such compression often precedes expansion, though confirmation is required before directional bias is established.
Immediate support is located within the $65,700–$65,400 range. This zone has previously attracted demand and may continue to function as a stabilizing level in the short term.
If this support holds, recovery attempts toward the $68,800–$69,200 resistance region are likely. A sustained move above $69,000 would improve short-term structure and increase the probability of a retest of $72,300.
On the downside, a confirmed breakdown below $65,000 could expose liquidity zones near $63,800 and $62,500. These levels represent the next technical reference areas where demand may re-enter the market.
The $60,000 level remains a significant psychological and structural support on higher timeframes
Recent price movement has occurred without extreme volatility, suggesting controlled positioning rather than forced liquidation. Volume during the rejection near $72,000 indicated active supply, while the subsequent decline has shown moderate participation.
Momentum indicators on lower timeframes reflect cooling conditions but do not currently signal oversold extremes. This indicates that the market retains capacity for movement in either direction depending on participation levels at support.
A decisive move accompanied by increasing volume will likely determine the next directional phase
As long as Bitcoin remains below $69,000, short term pressure may persist. However, maintaining price stability above $65,000 keeps the broader consolidation structure intact.
A break above $72,300 would restore bullish momentum and re-establish upward continuation potential. Conversely, sustained trading below $65,000 would shift focus toward deeper retracement levels.
Market participants should monitor price behavior closely at these technical thresholds rather than anticipate direction prematurely.
Current conditions favor a disciplined approach. Consolidation phases near major support zones frequently produce false breakouts and short-term volatility spikes.
Clear confirmation through structure break and volume expansion should precede any directional conviction. Risk management remains essential in compressed market environments.
Conclusion
Bitcoin is currently positioned at a technically significant level near $65,000. The market structure reflects short-term corrective pressure within a broader consolidation framework.
The reaction at this support zone will likely determine whether Bitcoin resumes upward movement toward $72,000 or enters a deeper retracement phase toward lower liquidity levels.
