

Bitcoin Shockwave: How BTC’s Crash to $60K Triggered $2.6B in Liquidations and What It Means Going Forward
Bitcoin markets were shaken by a sudden and violent move that sent BTC plunging to nearly $60,000, triggering one of the largest liquidation cascades in recent history. In less than 24 hours, over $2.6 billion worth of leveraged positions were wiped out, fear surged to extreme levels, and traders were forced to reassess their strategies amid growing macro uncertainty.
While Bitcoin has since staged a sharp recovery back toward the $69,000 region, the damage left behind reveals deeper structural tensions beneath the surface of the market. This was not just a routine dip it was a stress test for leverage, liquidity, and investor psychology.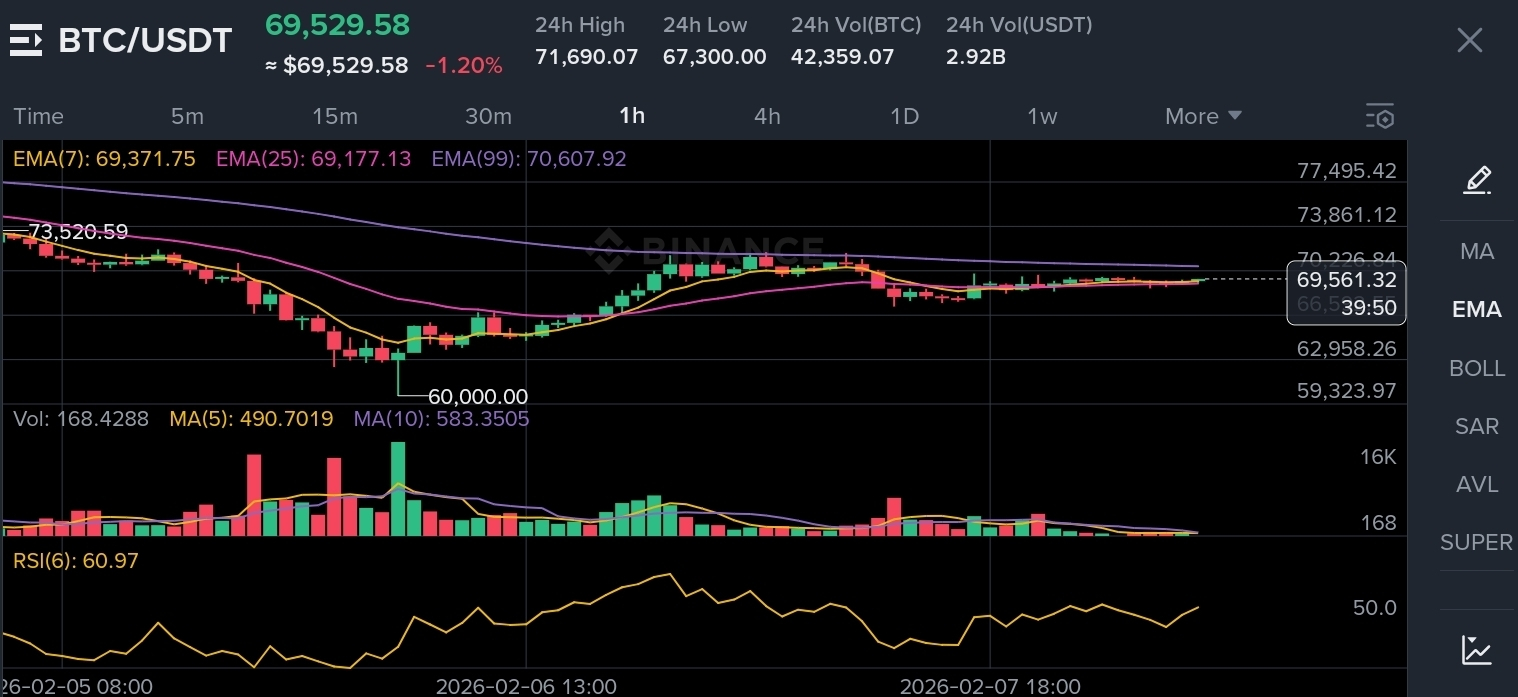
Understanding what caused this move, and what comes next, is crucial for anyone active in crypto markets.
The Price Collapse That Sparked Panic
Bitcoin briefly touched $60,074, a level that acted like a trigger point for widespread forced selling. As price fell rapidly, stop-losses and liquidation engines kicked in across centralized exchanges, accelerating the downside.
Within a single day: • BTC dropped violently before rebounding
• $2.6 billion in leveraged positions were liquidated
• 24-hour trading volume surged to $60.7 billion
• Market sentiment plunged into extreme fear territory
Despite the recovery, Bitcoin still ended the day down 1.11%, while its weekly performance showed a nearly 10% decline. The market capitalization fell to $1.38 trillion, reflecting how quickly confidence evaporated.
This wasn’t driven by retail panic alone. The structure of the move suggests deeper forces at play.
Extreme Fear on Technical Indicators
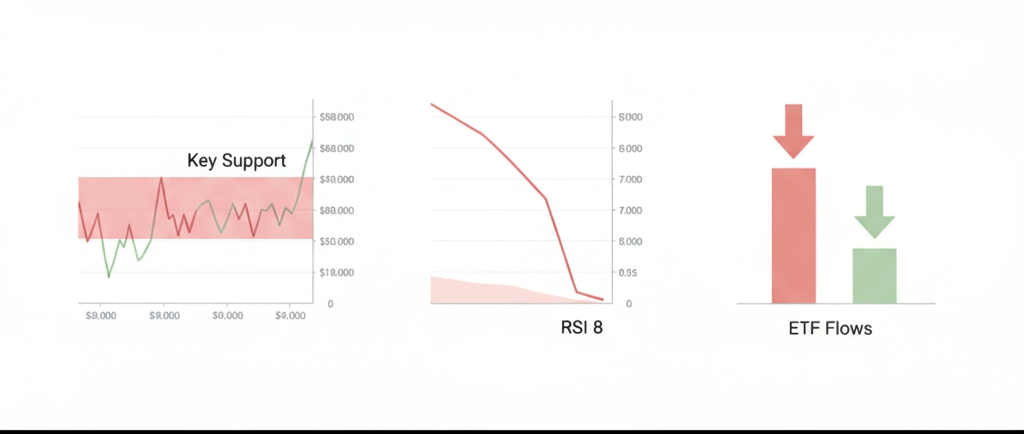
One of the most striking signals during the crash was the Relative Strength Index (RSI) plunging to 8. This is an exceptionally rare reading, even during major market drawdowns.
An RSI this low indicates: • Severe oversold conditions
• Panic-driven selling rather than rational price discovery
• Historically, zones where long-term bottoms often form
In addition, Bitcoin’s realized price—the average price at which all coins last moved—was sitting close to $60,000. This level is psychologically important because it often acts as a line between profit and loss for the average holder.
The $58,000–$60,000 range now stands out as a critical support zone, aligning with: • Long-term on-chain cost basis
• The 200-week moving average
• High historical demand areas
If this zone holds, it strengthens the case that the crash was a liquidity event rather than the start of a prolonged bear market.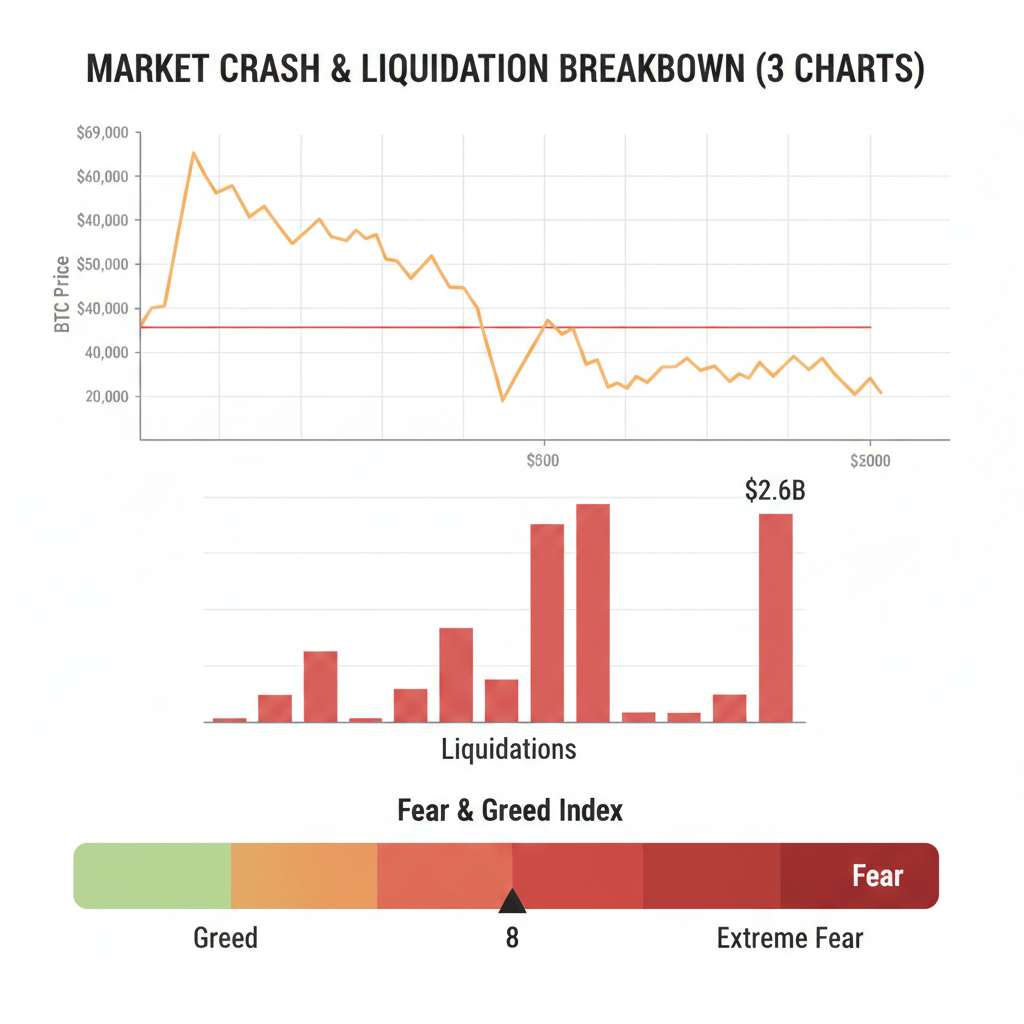
ETF Outflows and Institutional Pressure
Another major factor behind the sell-off was heavy outflows from spot Bitcoin ETFs. Over several days, capital steadily exited institutional products:
• February 4: $544.9M net outflow
• February 5: $434.1M net outflow
• February 6: $330.7M inflow (partial relief)
These flows matter because ETFs have become a key bridge between traditional finance and Bitcoin. When ETFs see sustained outflows, it often signals: • Institutional risk reduction
• Profit-taking after strong rallies
• Macro-driven reallocation into safer assets
Some analysts believe leveraged ETF-related strategies may have amplified the volatility, especially if positions were tied to borrowed capital from low-interest currencies like the Japanese yen.
Macro Concerns and Federal Reserve Uncertainty
Beyond crypto-specific factors, macroeconomic anxiety played a central role. Markets are increasingly uneasy about the future direction of U.S. monetary policy.
Key concerns include: • Uncertainty around Federal Reserve rate decisions
• Reduced dollar liquidity expectations
• The nomination of Kevin Warsh, seen as more hawkish, reigniting fears of tighter financial conditions
Bitcoin, despite its decentralized nature, remains highly sensitive to global liquidity cycles. When liquidity tightens, speculative assets—especially leveraged ones—are often the first to feel pressure.
Whale Movements Add Fuel to Speculation
On-chain data revealed notable whale activity during the chaos:
• 1,546 BTC (around $106.7M) withdrawn from Binance
• 817 BTC (about $56.5M) transferred from Robinhood to an unknown wallet
Large transfers like these often spark speculation about institutional repositioning. While withdrawals can signal long-term accumulation, during high-volatility events they can also reflect: • Margin stress
• Forced liquidation by large entities
• Strategic reshuffling of assets
There is growing speculation that a large non-crypto institution—possibly a sovereign fund or Asia-based entity—may have been forced to unwind positions, triggering a chain reaction across derivatives markets.
Altcoins Suffer Collateral Damage
As is typical during Bitcoin-driven liquidations, altcoins were hit even harder. Ethereum briefly fell below $1,900, while many mid- and small-cap assets saw double-digit percentage losses in hours.
This highlights a recurring market truth: When Bitcoin sneezes, altcoins catch a flu.
Liquidity drains faster from altcoins during panic events, making them more vulnerable to cascading sell-offs.
Market Positioning Shows Caution
Despite the rebound, data shows that large players remain cautious. The long/short ratio sits near 0.44, indicating short positions still dominate among whales.
This suggests: • Smart money is not aggressively chasing the bounce
• The recovery may face resistance without strong volume
• Volatility is likely to remain elevated
For any sustainable upside, Bitcoin must reclaim and hold higher levels with conviction.
Key Levels to Watch Going Forward
Support Zone
$58,000–$60,000 remains the most critical area. Losing this zone decisively could open the door to deeper downside.
Accumulation Range
$60,000–$65,000 is viewed as a potential accumulation area for long-term participants, provided support holds and macro conditions stabilize.
Major Resistance
$75,000 stands out as a strong resistance level. Breaking it would require: • High volume
• Renewed ETF inflows
• Improved macro sentiment
Without these factors, rallies may face rejection.
Smart Trading Strategy in High-Volatility Markets
Periods like this punish overconfidence and reward discipline.
Practical risk management principles: • Reduce leverage—ideally below 3x
• Always use hard stop-losses
• Avoid chasing sudden pumps after liquidation events
• Scale into positions rather than going all-in
Extreme fear often creates opportunity, but only for those who survive the volatility.
Bitcoin’s plunge to $60K was a brutal reminder that leverage is a double-edged sword. While the recovery shows resilience, the underlying drivers—ETF flows, macro uncertainty, and institutional positioning—suggest the market is still in a fragile phase.
This was not just a price move. It was a liquidity reset.
For long-term believers, such moments often mark areas of value. For short-term traders, patience and risk control are essential. The market has not made its final decision yet—but one thing is clear: Bitcoin just reminded everyone that volatility is the price of admission.
Stay sharp, stay patient, and most importantly stay liquid.

