


Before trading or investing in any financial asset, you must first know in which direction its price is moving. Determining the direction is a very important part of technical analysis and is the basis on which most trading strategies are based.
Prices generally move in three directions: up, down or sideways. We say that an asset is moving in an uptrend when its price forms rising bottoms (bottom above bottom), we say that an asset is moving in a downtrend when its price forms falling tops (top below top), and we say that an asset is moving sideways when the price forms bottoms and tops at the same horizontal level.
To determine the direction in which the price is moving, the trader draws lines above the peaks and bottoms. These lines are called trend lines or trend levels. They are lines that the trader draws to monitor the direction of the price movement and search for entry opportunities and determine his targets and exit points.
In technical analysis, trend refers to the general direction in which the price of a currency, commodity, or financial asset moves. Generally, prices move in three directions: Uptrend, Downtrend, or Sideway Trend.
In simple terms, trend lines are lines that traders draw over a series of peaks and troughs to identify and confirm the prevailing price trend. These lines act as moving support and resistance levels and are one of the most important and widely used technical analysis tools in analyzing the financial markets.
The uptrend line acts as a moving support line indicating that demand for the asset is increasing and that buyers' willingness to buy is renewed at each bottom.
To draw an upward trend line, we identify at least two upward lows and draw a line below them from left to right (see the illustrative example above).
The trend line in a Japanese candlestick chart is drawn on the shadows of the candles and should not penetrate their bodies.
To draw a trend line accurately and correctly, always use a line chart. Convert the candlestick chart to a line chart and make sure to draw the line below the chart bottoms accurately as shown in the image below.
Downtrend line
It is a straight line with a negative slope drawn on two descending peaks (peak below peak) above the price from right to left. This line is not considered valid until the third peak is formed.
The downtrend line acts as a moving resistance line indicating a steady decline in prices and the desire of traders and speculators to sell renewed at each peak.
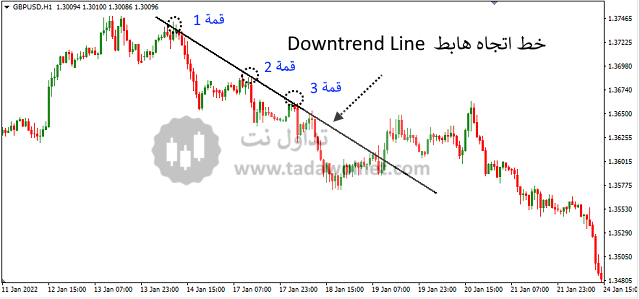 Downtrend Line on GBP/USD candlestick chart
How to draw a downtrend line
To draw a downtrend line, we identify at least two downtrend peaks and draw a line above them from left to right (see the illustrative example above).
The trend line in a Japanese candlestick chart is drawn on the shadows of the candles and should not penetrate their bodies.
To draw a trend line accurately and correctly, always use a line chart. Convert the candlestick chart to a line chart and make sure to draw the line above the chart peaks accurately as shown in the image below.
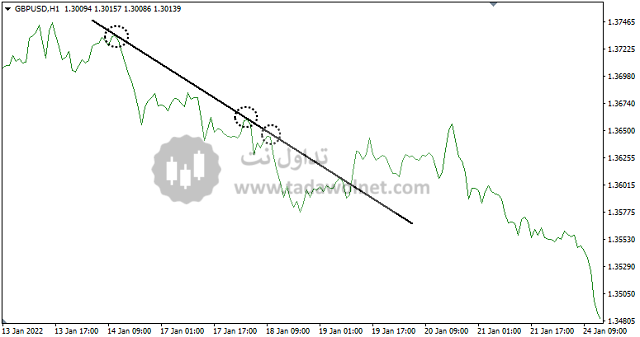 Downtrend Line on GBP/USD Line Chart
Remember💡
A downtrend line is drawn above two peaks and is not confirmed and traded until a third peak is formed.
Drawing a downtrend line requires two peaks, and the more peaks used to draw the line, the more valid it is.
The steeper the trend line, i.e. the steeper its angle, the weaker its validity.
Trend Lines Trading Strategies
There are two important rules about trends that you should remember when investing or trading in any financial market: “The trend is your friend” and “Don’t trade against the trend.” The first step to successful trading is to identify the trend.
There are many ways to use trend lines in trading, we will try to explain some of the most popular and powerful ones.
1- Apostasy
One of the most famous and simplest methods of trading using trend lines. This strategy is based on selling when the price approaches the downtrend line and buying when the price approaches the uptrend line. We do not mean buying and selling from these lines randomly.
Buy in an uptrend
To enter the Shaa Center based on this strategy, we follow the following steps:
- We determine the general direction of the price and draw a line under two clear bottoms.
- We wait for the price to form the third bottom to confirm the validity of the trend line.
- We wait for the price to approach the uptrend line again.
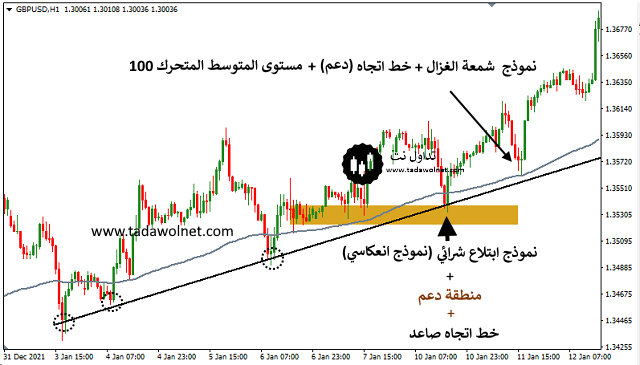
- If the price approaches the trend line and we find it also at a support level, we prepare to enter a buy trade after its confirmation.
There are a number of technical analysis tools that you can rely on to confirm your entry, including, for example, Japanese candlestick patterns, moving averages, or Fibonacci lines.
If the price forms a candlestick pattern indicating a possible reversal, we open a buy trade.
- We set stop loss below the trend line and take profit at double the stop loss (1:2).
Note the illustrative example below that illustrates what we explained above.
Sell in a downtrend
To enter into a selling position based on this strategy, we follow the following steps:
- We determine the general direction of the price and draw a line above two clear peaks.
- We wait for the price to form the third bottom to confirm the validity of the trend line.
- We wait for the price to approach the downtrend line again.
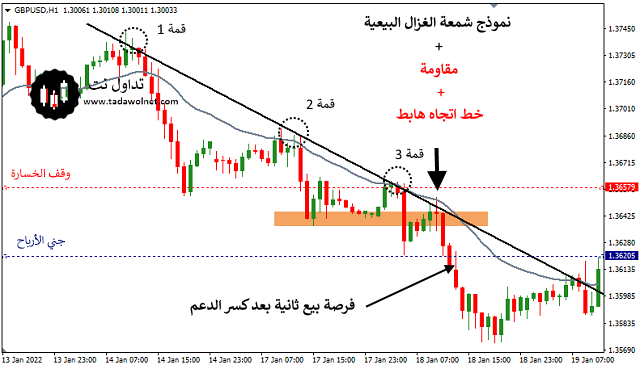
If the price approaches the trend line and we find it also at a resistance level, we prepare to enter a buy trade after its confirmation.
There are a number of technical analysis tools that you can rely on to confirm your entry, including, for example, Japanese candlestick patterns, moving averages, or Fibonacci levels.
- If the price forms a candlestick pattern indicating a possible reversal, we open a sell trade.
- We set the stop loss above the trend line and the take profit at least twice the stop loss (1:2).
Note the illustrative example below that illustrates what we explained above.
2- Breaking support and penetrating resistance
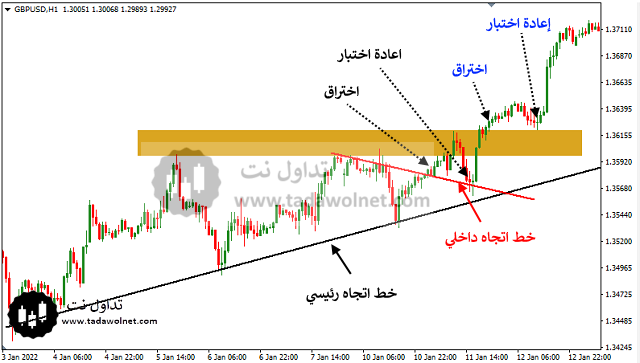
The breakout trading strategy is also a trend trading strategy, this strategy is based on buying in an uptrend when the price breaks a resistance level or after retesting it, and selling in a downtrend when the price breaks a support level or after retesting it.
To enter into a purchase position based on this strategy, we follow the following steps:
- We determine the main price trend and draw a line under three rising bottoms.
- If the price makes a short correction that goes against the trend (downtrend line), we draw the line of this correction.
- We open a buy deal immediately after the price breaks the trend line we drew or after retesting it.
- We can also enter immediately after the price breaks the nearest resistance area or after retesting it.
Note the illustrative example below that illustrates what we explained above.
3- Breaking trend lines
Remember that the trend does not last forever, the price does not continue moving in the same direction, the more the price tests the trend line, the more likely it is to be broken.
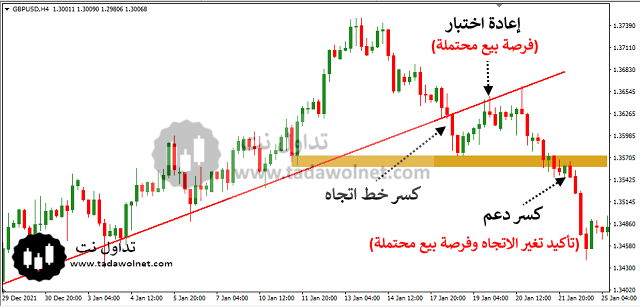
When the price approaches the trend line, only two events occur: either the price rebounds and continues in the same direction, or it breaks the line and changes direction.
Price breaking the trend line may be a signal that the current price trend has ended and a new trend has begun.
Trend lines are support and resistance levels. When these lines are broken, the roles are exchanged between them. The upward trend line, which is support, turns into resistance, and the downward trend line turns into support.
Trendline Breakout Trading Strategy A simple counter-trend strategy, the strategy is based on selling after the price breaks an upward trend line and retests it, and buying after the price breaks a downward trend line and retests it.
Remember💡
A breakout is when a candle opens and closes outside a support, resistance or trend line.
The trader can confirm the breakout using the volume indicator. Some technical analysts believe that the larger the trading volumes when the breakout occurs, the more credible and reliable the breakout is.
There are a set of technical analysis tools to confirm a change in trend (indicators, technical patterns, Japanese candlestick patterns, etc.).
Considerations and recommendations
Trend lines are moving support and resistance levels that are drawn to determine the direction in which the price is moving.
The trend line is drawn below two rising bottoms or above two falling tops and is not confirmed or relied upon until the third bottom or third top is formed.
The trend line is drawn on clear bases and its angle must be neither acute nor obtuse.
The credibility and strength of the trend line increases the longer the period of time the price commits to moving above it (preferably this period should not be less than 8 days at least).
Chart source: IC Markets MetaTrader 4 platform - Timeframes these illustrations are taken from: 1 hour and 4 hours - Price range: 29 December 2021 to 25 January 2022 - Currency pair: GBP/USD - Please note that past performance is not indicative of future results - The above content does not constitute investment advice.


