The crypto market has been through a wave of stellar recovery over the last week, and it's Christmas already for investors.
Around this time last week, the global crypto market cap sat at around $1.05 trillion.
This week, we now have a $1.07 trillion market cap and a heat map that looks like this:

Bitcoin is now closer than ever to breaking through $32,000 and investors are prepared. In terms of liquidations this time around, the margin is clearly there.

While the bulls have suffered a relatively small loss of $34 million, the bears have lost as much as $86 million over the last day, with the total liquidation figure coming in at around $121 million.
Let’s take a look at what to expect from the market today.
Bitcoin Waxes Strong
According to the chart below, Bitcoin is on the verge of breaking above the $31,000 resistance.

The bulls have pushed the cryptocurrency so far up, that it is now testing its $31,630 high and is showing strong signs of breaking above.
It is important to keep in mind though, that while a break through $31,230 is a good sign and would indicate Bitcon’s real chance at retesting $35,000 in over a year, we still need to break and close above this level to confirm a breakout.
Ethereum Is About To Break Through This Important Level
According to the charts, Ethereum was one of the most reluctant cryptocurrencies of last week.
The bears appeared bent on pushing the cryptocurrency below $1,523 and the bulls did not put up much of a fight.
Fast forward to today, and Ethereum is one of the most bullish cryptocurrencies out there.

As illustrated above, Ethereum has now broken past the $1,644 resistance, formed a higher high, and is now testing its 99-day MA.
A break and close above this moving average would signal a possible rally straight up to $2,000 or even higher.
Nothing Stands In Solana’s Way
Solana, according to the charts, is a bullish monster. The cryptocurrency continues to inch more and more towards the $32.13 high it last tested in July, and appears to be doing a good job at it.
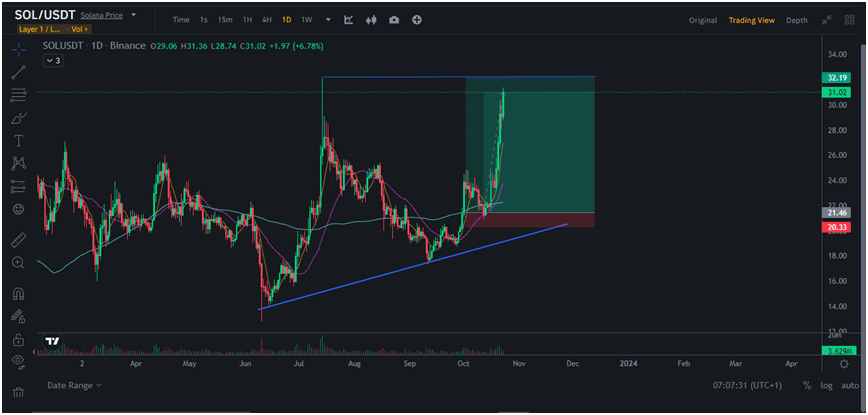
As an investor, though, keep in mind that the $32.13 zone is a very important one for Solana. This is because the bears are likely at this level, lying in wait. They will likely fight with all they've got.
And if the bulls are unable to sustain their momentum, we will inevitably see a downturn in SOL. However, if a break above occurs, absolutely nothing stops Solana from going parabolic.
Keep An Eye Out For This Level On XRP
XRP on the 4-hour chart, is in an ascending trendline.

Symmetric triangles are neutral formations, in that they give bulls and bears the same opportunity at brakouts.
In all, the bulls appear to be pushing hard against this formation’s upper trendline, and may even make headway somewhere around $0.53.
Keep an eye out for this price zone, and be prepared to take action at any sign of a breakout.
Signs Of Weakness On LINK?
According to the charts, LINK has been highly bullish over the last two weeks. The cryptocurrency broke through a symmetric triangle on its daily chart and has increased massively In price since.

However, LINK appears to have been stopped out at the $11 zone, and may be facing chances of a price reversal.
Investors are advised to keep an eye out for $11 and what happens around this zone. This will be one of the most important indicators of either a price reversal or a price continuation.