

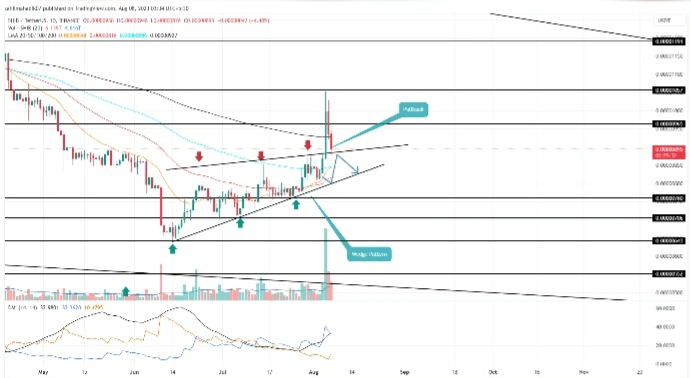
#FDUSD Despite the increasing FUD in the #crypto market, the Shiba Inu price showed a significant recovery in early August. This recent bullish swing formed a breakout from the resistance trendline of the rising wedge pattern. An upside breakout of this pattern is rare and signals a strong buying signal for traders. Is this setup enough to invest in SHIB?
Shiba Inu Price Daily Chart:
The SHIB price retraced to potential support for a bounce back to higher levels.
A bullish crossover between the 20-and-100-day EMA would attract more buyers in the market
The intraday trading volume of the Shiba Inu coin is $261.2 Million, showing a 38% loss.
Source- Tradingview
On August 5th, the Shiba Inu price offered a high momentum breakout from the resistance trendline of a rising wedge pattern. In theory, this pattern often results in a significant downfall but in a rare case, it breaks the above resistance as a signal for increased buying pressure.
This breakout rally reached a high of $0.0000105 and reverted immediately. In the last two days, the coin price tumbled 11-12% and retested the breached resistance for potential support. By press time, the Shiba Inu price trades at $0.00000895, trying to sustain above the aforementioned trendline.
If the memecoin shows demand pressure from the rising trendline, the buyers may extend the price 18% higher to reach $0.0000105, followed by $0.0000119.
Can $SHIB Price Revist $0.0000065?
If the sellers obtained the upper hand in the midst of increased uncertainty, the #Shibainu price could see a breakdown below the flipped trendline. This breakdown would invalidate the bullish thesis and plunge the coin price to 6.5% to $0.0000085 to test the lower trendline of the wedge pattern.
Average Directional Index: The daily ADX slope at 32% indicates the buyers’ enough ave strength
Exponential Moving Average: The daily EMAs(20, 50, and 100) could offer additional support to coin buyers.#MultiChain #Worldcoin