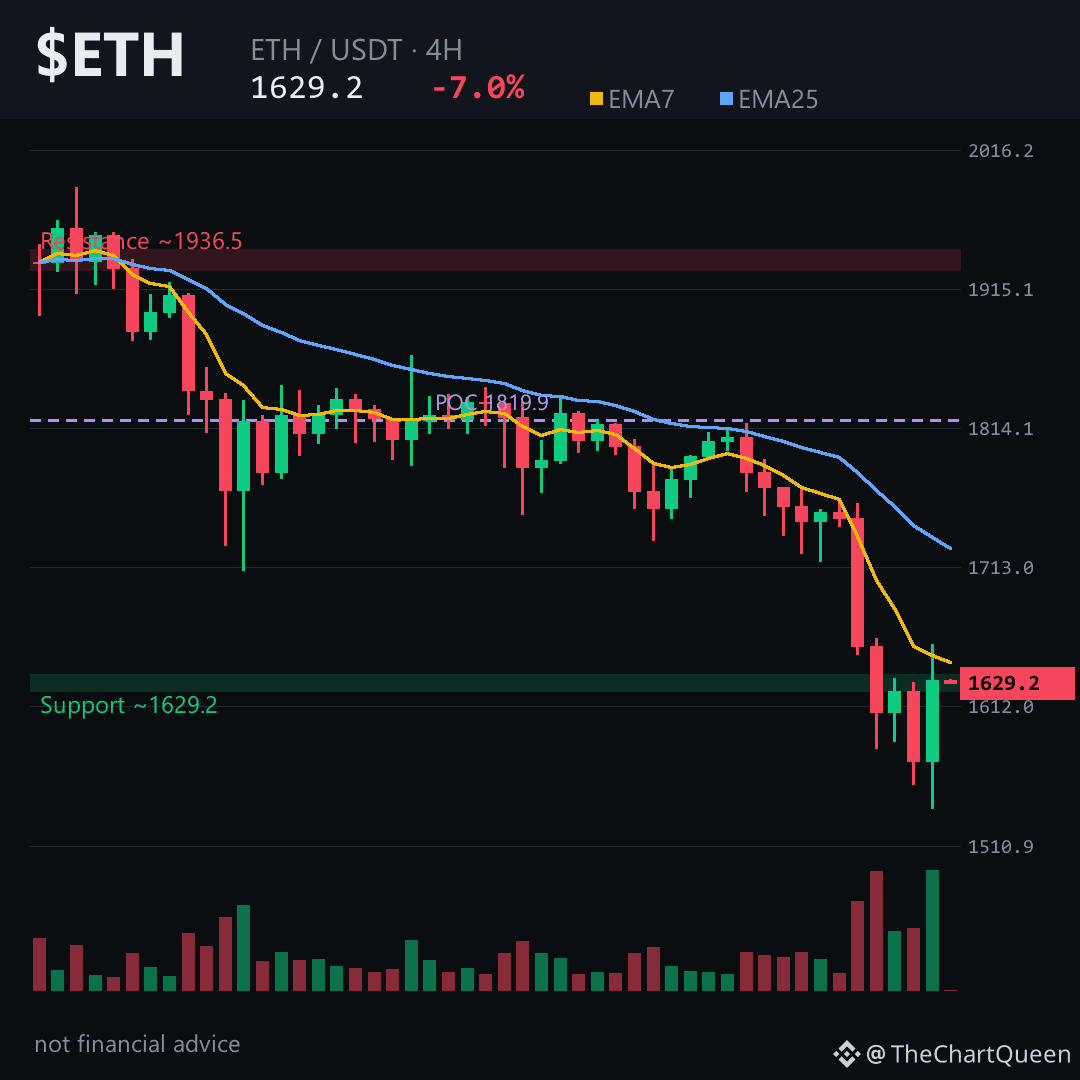
Your 4‑hour candle on $ETH just broke the $1743 bearish gap and is now stuck under the 7‑EMA at ~1644 – a red flag you can’t ignore.
Price is sliding, RSI sits in the low‑30s and funding is negative while longs are paying to stay, a classic sign of over‑leveraged bulls.
On the 4H chart the current area clusters around the 7‑EMA (~1644). Lose the ~1727 invalidation zone on a 4H close and the bearish case collapses. Hold the ~1495‑1500 objective zone as the next demand pocket if sellers stay in control. Tap $ETH to pull up the chart and see these levels yourself.
My read: the market is primed to test lower demand, with risk of a deeper slide toward the mid‑1490s.
Follow me for the next update when $ETH either breaks the 1720 barrier or dives into the 1500 zone – I’ll break down what that means for the longer picture.
What level do you think will hold the most pressure on ETH? 👇
⚠️ Not financial advice. DYOR.
#ETH #Ethereum #Crypto #BinanceSquare
Price is sliding, RSI sits in the low‑30s and funding is negative while longs are paying to stay, a classic sign of over‑leveraged bulls.
On the 4H chart the current area clusters around the 7‑EMA (~1644). Lose the ~1727 invalidation zone on a 4H close and the bearish case collapses. Hold the ~1495‑1500 objective zone as the next demand pocket if sellers stay in control. Tap $ETH to pull up the chart and see these levels yourself.
My read: the market is primed to test lower demand, with risk of a deeper slide toward the mid‑1490s.
Follow me for the next update when $ETH either breaks the 1720 barrier or dives into the 1500 zone – I’ll break down what that means for the longer picture.
What level do you think will hold the most pressure on ETH? 👇
⚠️ Not financial advice. DYOR.
#ETH #Ethereum #Crypto #BinanceSquare