
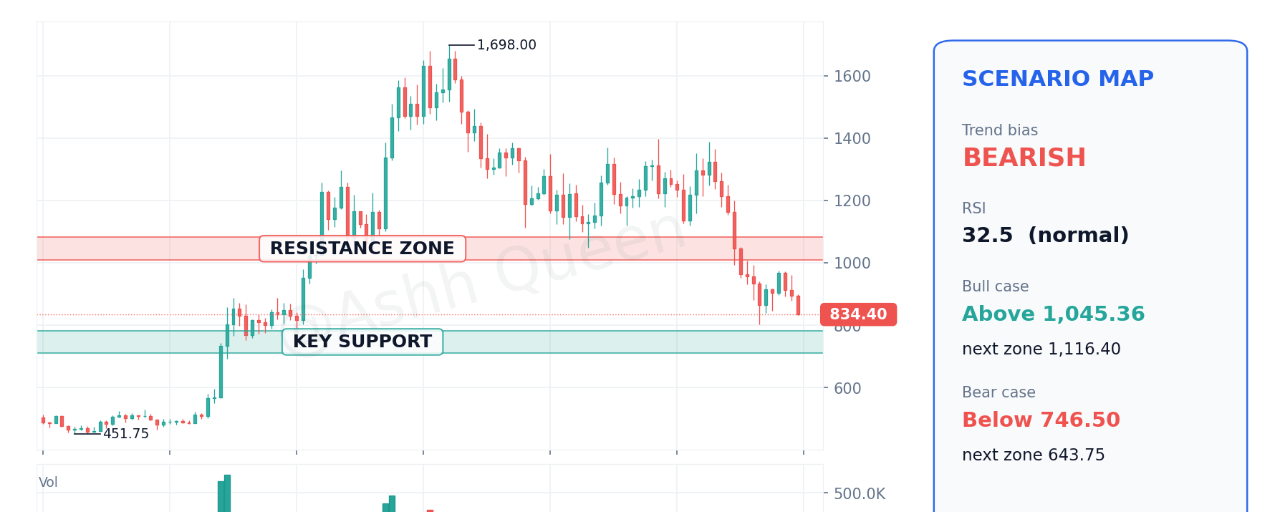

The current landscape for $ZEC reflects a distinct lack of upward momentum, as the asset trades at 834.35 while struggling to find a sustainable footing across multiple timeframes. Investors are closely monitoring the charts, as the persistent bearish sentiment currently dominating the 1h, 4h, and 1d charts suggests that buyers are finding little cause for optimism. With the asset consistently trading below key moving averages and indicators like the one-hour RSI at 27.31, the technical setup highlights a challenging environment for those looking for a reversal. This analysis explores the structural obstacles preventing a recovery, examining the significance of the four-hour RSI at 32.13 and the daily RSI at 32.53 in determining the asset's near-term path. By evaluating these levels, we can better understand the forces currently influencing ZEC and what conditions might be required to shift this prevailing technical narrative.
📊 The Big Picture: $ZEC on the Daily Chart
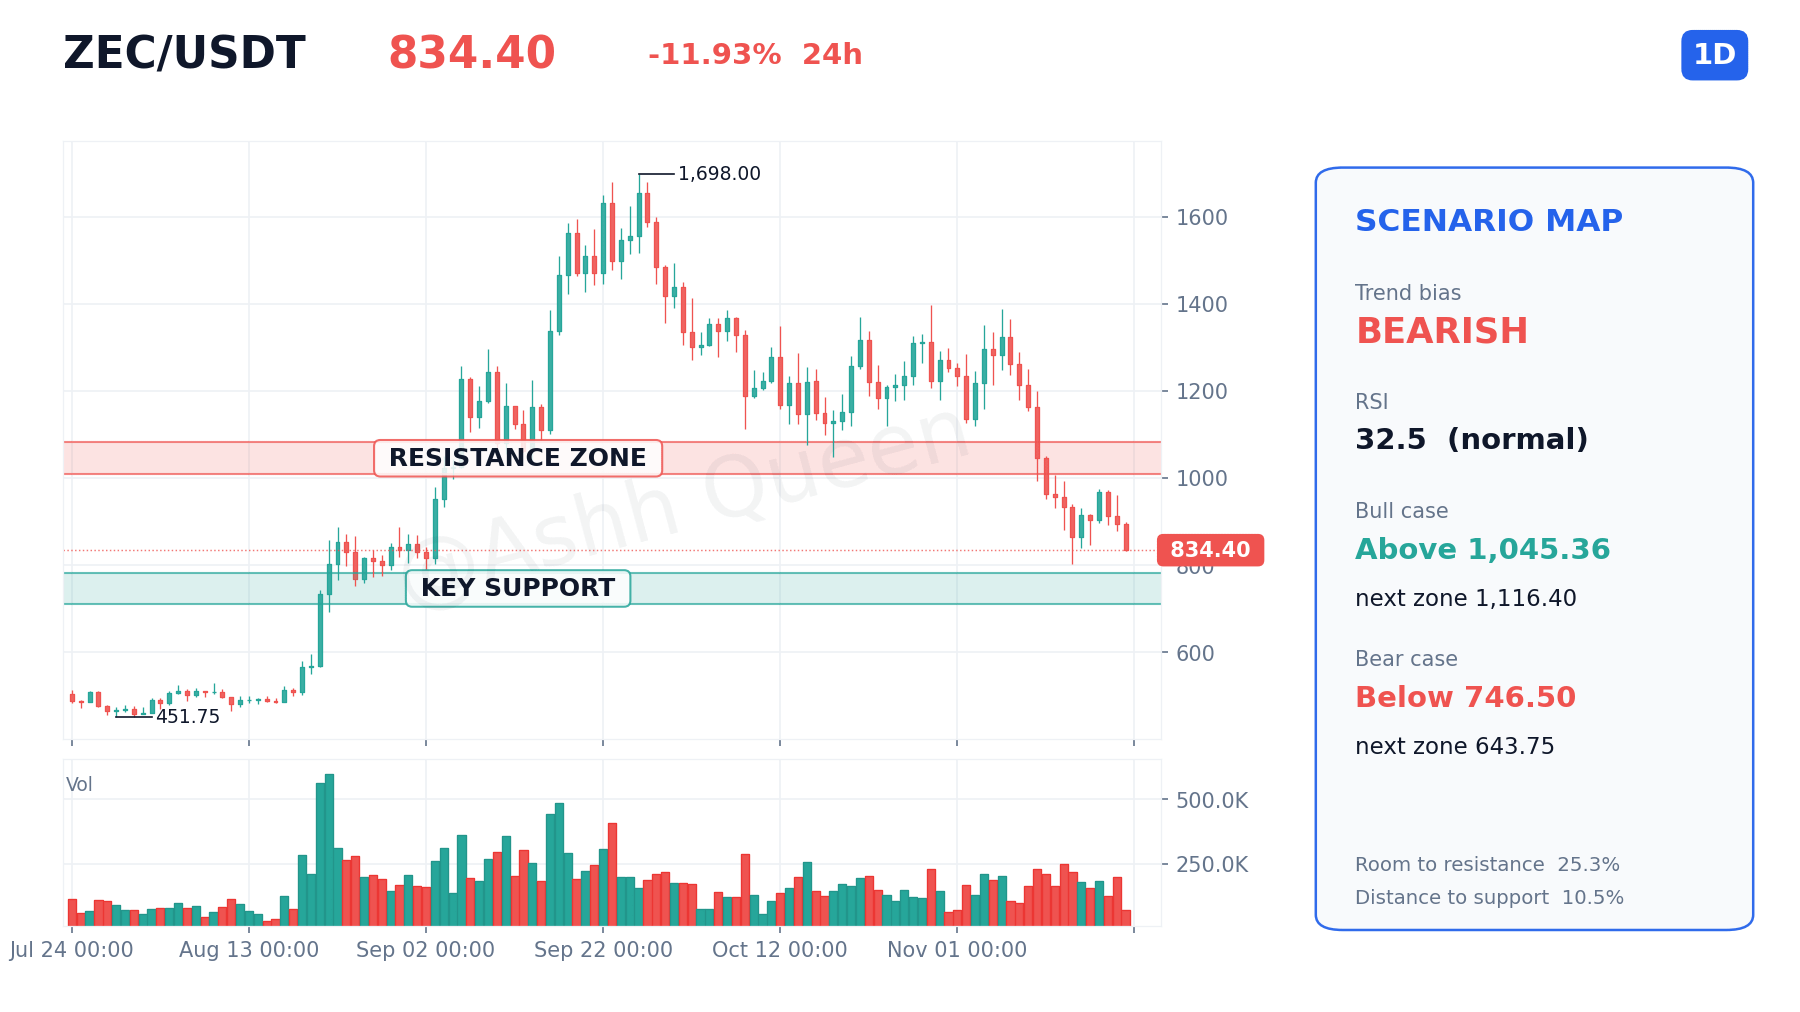
On the daily timeframe, the structure for ZEC reveals a clear struggle to regain footing, characterized by a persistent bearish bias. The current price at 834.40 sits significantly below key trend indicators, which highlights the structural difficulty the asset faces when attempting to shift back into a bullish phase. Most notably, the distance between the current price and the daily EMA50 at 1,111.87 serves as a primary marker of the ongoing supply dominance. Furthermore, the fact that the price remains below the daily EMA200 at 875.35 suggests that the longer-term trend remains under pressure, leaving little room for a quick recovery in the immediate term.
With the RSI at 32.53 resting in neutral territory, there is no immediate indication of an exhausted trend, which often leads patient market observers to wait for more definitive evidence of accumulation. The proximity of the daily VWAP at 855.51 provides a reference point for recent average activity; as long as the asset continues to trade below this level, the path of least resistance remains anchored to the lower end of the range. For those watching the broader landscape, the daily support at 746.50 becomes a critical area to monitor, as a failure to maintain this footing could shift the focus toward lower levels. Conversely, any attempt to reclaim lost ground must contend with the daily resistance at 1,045.36, which represents a significant hurdle for any potential momentum shift. The current setup reflects a market in consolidation, where structural recovery requires sustained volume above these established moving averages.
⏱️ Four-Hour Structure and Momentum
The four-hour timeframe for ZEC reveals a persistent bearish structure that underscores the current lack of upward momentum. With the price currently positioned at 834.40, the asset remains trapped below key technical benchmarks that typically define a healthy trend. Most notably, the price is trading well under the four-hour EMA50 at 946.78 and the four-hour EMA200 at 1,102.93, signaling that sellers maintain control over the medium-term direction. This alignment indicates that any brief attempts to recover are quickly met with resistance near the four-hour VWAP at 859.75.
The momentum indicators on the four-hour chart further reflect this exhaustion, with the RSI at 32.13 remaining in a neutral state rather than showing signs of a reversal. Furthermore, the asset is currently testing the boundaries of the lower range, as the price sits below the four-hour Bollinger Band lower at 850.79. Should the current structure fail to stabilize, market participants may look toward the four-hour support1 at 798.24 or the four-hour support2 at 749.56 as potential areas of interest. Conversely, a shift in sentiment would require a sustained breakout above the four-hour resistance1 at 886.79 to begin realigning with the broader moving averages. Until the price can reclaim these critical levels, the prevailing narrative remains one of caution.
🧭 The One-Hour Map: Levels That Matter Today
When zooming into the one-hour timeframe for $ZEC, the structure remains firmly under bearish control, reflecting the broader weakness seen across higher intervals. With the current price at 834.47, the market is struggling to find any meaningful footing, particularly as it remains significantly detached from the one-hour VWAP at 860.19. This lack of alignment with volume-weighted averages typically suggests that short-term sellers maintain dominance, preventing any sustainable recovery. The one-hour RSI at 27.31 currently sits in oversold territory, which warrants observation as it indicates extreme exhaustion, though this alone does not signal an immediate reversal.
Traders should keep a close watch on the relationship between price and the one-hour EMA20 at 873.67 and the one-hour EMA50 at 898.70. As long as price remains below these dynamic barriers, the path of least resistance continues to lean downward. Should the selling pressure persist, the one-hour support at 801.52 and the one-hour support at 778.65 become the primary areas of interest for potential stabilization. Conversely, if some stability emerges, the one-hour resistance at 876.76 and the one-hour resistance at 891.36 represent the initial obstacles for a retest of higher levels. Given the current one-hour ATR at 15.25, volatility remains a key factor that could influence how these levels are tested throughout the session. Keeping an eye on these specific markers provides a clearer view of whether ZEC can find a base or if the present intraday trend will continue to define the market environment.
📈 What the Derivatives Market Is Saying
The derivatives landscape for ZEC currently reflects a cautious environment, mirroring the broader technical softness observed across the 1d, 4h, and 1h charts. With a 24h move of -11.93%, market participants are navigating a period where conviction appears muted. The funding rate at +0.0047% remains near neutral territory, suggesting that neither side of the market is aggressively paying a premium to maintain positions, which often happens when the underlying trend lacks a clear directional catalyst.
Furthermore, the open interest sitting at 482,430 indicates that there is still capital deployed in the market, yet the lack of significant expansion in this figure suggests that traders are currently waiting for a more definitive breakout or breakdown before committing to larger size. This positioning can imply that the crowd is in a state of observation rather than accumulation. If the price of 834.35 continues to face headwinds below the daily VWAP at 855.51, market participants might remain hesitant, as the balance between supply and demand continues to favor those looking for stability before re-entering the market. Monitoring these metrics alongside the RSI at 32.13 on the four-hour timeframe may help identify if sentiment begins to shift toward a more aggressive stance.
🎯 Scenario Playbook: Bull, Base and Bear Cases
The current technical landscape for ZEC presents three distinct paths based on whether the price can reclaim lost ground or if the existing downward trend extends. In the bull scenario, a recovery begins if the price establishes a firm floor above the one-hour support at 801.52. For this case to gain traction, ZEC would need to reclaim the one-hour resistance at 876.76 and eventually push toward the four-hour resistance at 886.79. Such a move would be confirmed by the RSI at 27.31 shifting out of its current oversold territory, signaling a potential exhaustion of the selling pressure. This scenario remains invalidated if the asset fails to hold above the one-hour support at 801.52 on a closing basis.
In the base case, ZEC enters a period of consolidation within the range defined by the one-hour support at 801.52 and the four-hour resistance at 886.79. Given that the daily RSI at 32.53 is currently hovering at a neutral level, the asset may oscillate between these boundaries while awaiting a catalyst. This lateral movement would be characterized by the price remaining below the daily EMA200 at 875.35. This neutral outlook holds as long as the price does not breach the four-hour support at 798.24 or break through the four-hour resistance at 886.79.
Finally, the bear scenario involves a continuation of the current momentum, particularly if the asset fails to recover the one-hour VWAP at 860.19. Should the price decline below the one-hour support at 801.52, the next target for the downside trajectory becomes the daily support at 746.50. This path is confirmed if the four-hour RSI at 32.13 continues to trend downward without establishing a higher low. This bear case would be invalidated only if ZEC manages to clear the four-hour resistance at 886.79, thereby neutralizing the immediate downward bias across the shorter timeframes.
🛡️ Risk Management and Account Security
Navigating the market for ZEC requires more than just identifying trends; it demands a disciplined approach to risk management. Given the current volatility, as reflected by the four-hour ATR at 32.45, market participants must recognize that price swings can be significant. Sizing positions appropriately is critical, as larger exposure during periods of high ATR can lead to rapid capital erosion. Before considering any market interaction, it is essential to define invalidation points where the original thesis no longer holds. Relying on leverage is a common trap that often exacerbates emotional decision-making, especially when assets are moving against established trends. Prioritizing small, manageable position sizes helps maintain composure when the market experiences noise or unexpected shifts.
Account security serves as the foundation for any sustainable market activity. Ensure your assets are protected by enabling two-factor authentication on all platforms. Always verify that you are using the official application, and implement anti-phishing codes to confirm that communications are legitimate. Never share your private keys or seed phrases with anyone, as these are the keys to your personal vault. Maintaining a skeptical mindset regarding unsolicited offers or requests for information is a vital practice in keeping your account secure. Protecting your capital is just as important as the analysis of price levels themselves.
✅ Final Take
The structural weakness currently visible in $ZEC across the 1d, 4h, and 1h timeframes highlights a challenging environment for bulls. With the 834.35 trading significantly below the daily EMA200 at 875.35 and struggling to reclaim the four-hour VWAP at 859.75, the path of least resistance remains tilted toward the downside. While the one-hour RSI at 27.31 is currently indicating oversold conditions, this alone is rarely enough to trigger a trend reversal without a corresponding shift in market volume or a decisive move above the one-hour resistance at 876.76. If the price fails to stabilize, eyes will naturally turn toward the four-hour support at 798.24. Watching how the market interacts with these technical boundaries is vital for understanding if this is a temporary consolidation or a deeper trend continuation. Given the current lack of bullish momentum, do you believe the current support levels are robust enough to hold against further downside pressure?
#zec #CryptoMarketAlert #MarketOutlook #BinanceSquare
Not financial advice. Markets are volatile, so use stop-losses and only risk what you can afford to lose.