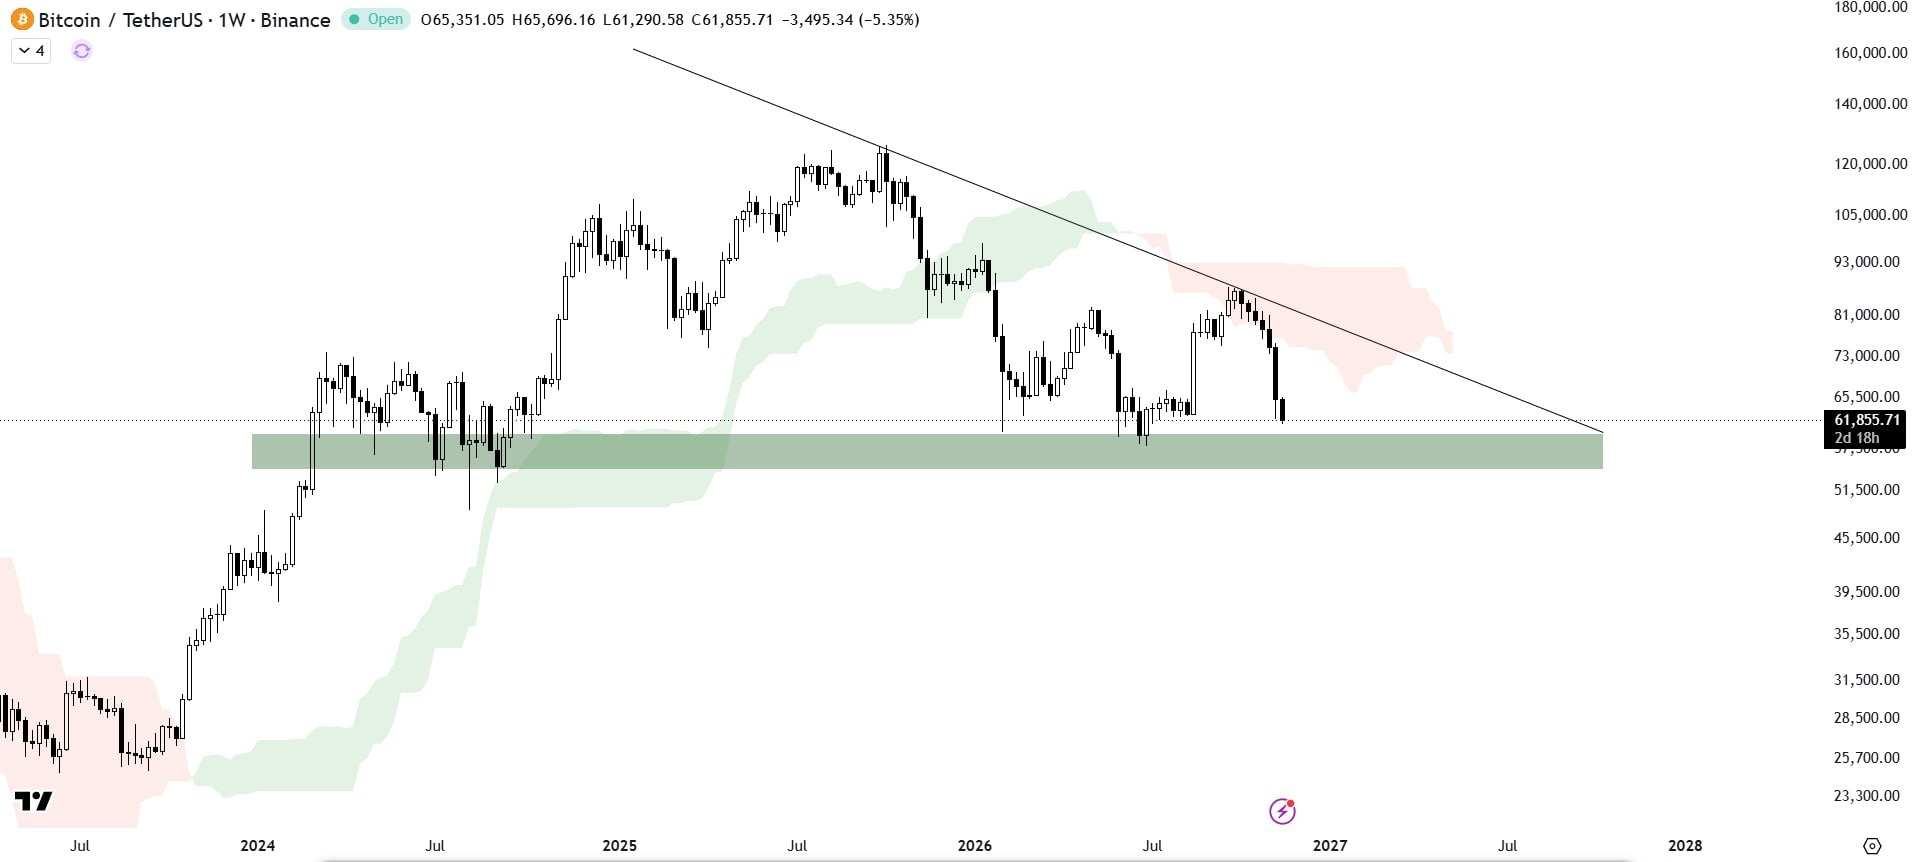

$BTC Bitcoin just hit about $61.3K, its lowest price since July, and it's heading straight for the biggest support zone on the weekly chart. This is the level the whole cycle may be decided on
THE BIG PICTURE (WEEKLY CHART)
• BTC peaked near $126K in Oct 2025. Now it's about 51% lower.
• Price has made lower highs since that peak, along one falling trendline
• Below, a wide support zone (roughly $55K-$60K by my read of the chart) has held since early 2024
• Falling resistance on top and flat support below is a descending triangle. These usually resolve down, but not always.
• The trendline was near the low $80Ks in October, when BTC was rejected. By my eye it meets the floor around late 2027.
• This week's candle is red again, and BTC is on track for a seventh straight weekly decline
WHAT FELL THIS WEEK
• Spot ETFs: about $582M left on Nov 19 (other trackers show about $297M in BTC terms). BlackRock's IBIT had its biggest single-day outflow ever, $541M. November's total is about $3.47B.
• Liquidations: about $530M-$700M in 24 hours across crypto, with about $170M-$203M in BTC. Longs were about 80-82% of it.
• Stocks: the S&P 500 fell 2% in its sixth straight down session. The VIX rose to about 28.
• Rates: Fed minutes suggested more hikes may be appropriate. The next FOMC is Dec 8-9.
THE SIGNALS
• Daily RSI: about 20, deeply oversold
• Peter Brandt warned of a major correction, noting past bull markets ended with falls of at least 75%. It's a history comparison, not a forecast.
• A reported mNAV for Strategy of 0.97 means its stock trades below the value of its coins. One source, so verify it.
• Big options expiry of about $6.7B on Nov 27
• Oversold readings can last for weeks in a downtrend
THE LEVELS
• Support: $61.3K (just tested), $60K, then the July cycle low at $57.8K, then the bottom of the zone near $55K
• Resistance: $62.5K (broken support), $64K, $65K, then $65.3K (last week's close)
• Above that: the falling trendline in the low $80Ks
3 SCENARIOS
Bull: the zone holds, BTC reclaims $62.5K, then $65.3K, and the market starts building a base.
Base: it chops inside $57K-$65K for weeks while ETF flows and rate fears settle.
Bear: a weekly close below the zone (under about $55K) breaks the 2-year floor, and the descending triangle plays out.
TRADE IDEA (analysis, not advice)
Entry zone: $60,000-$61,500 (example: $60,500)
Stop: daily close below $57,000
Targets: $65,000, then $70,000
Risk/reward: about 1.3:1 to the first target, 2.7:1 to the second
This is a counter-trend bounce at support, not a call that the bottom is in. A close under $57K cancels it. Scale in, and use small size. A safer way is to wait for a daily close above $62.5K.
RISKS
• Descending triangles often break down
• ETF outflows are still large and accelerating
• Stocks are falling too, so there's no safe corner
• Rate-hike fears can last into December
• A weekly close under the zone would open much lower prices
MY TAKE
The floor is real: it's been tested multiple times since 2024. But the pressure on it has never been this heavy, with record ETF outflows and falling stocks. I'd rather watch how BTC acts inside the zone than guess the bottom.
Does the 2-year floor hold, or break?
Not financial advice. DYOR. #bitcoin $BTC