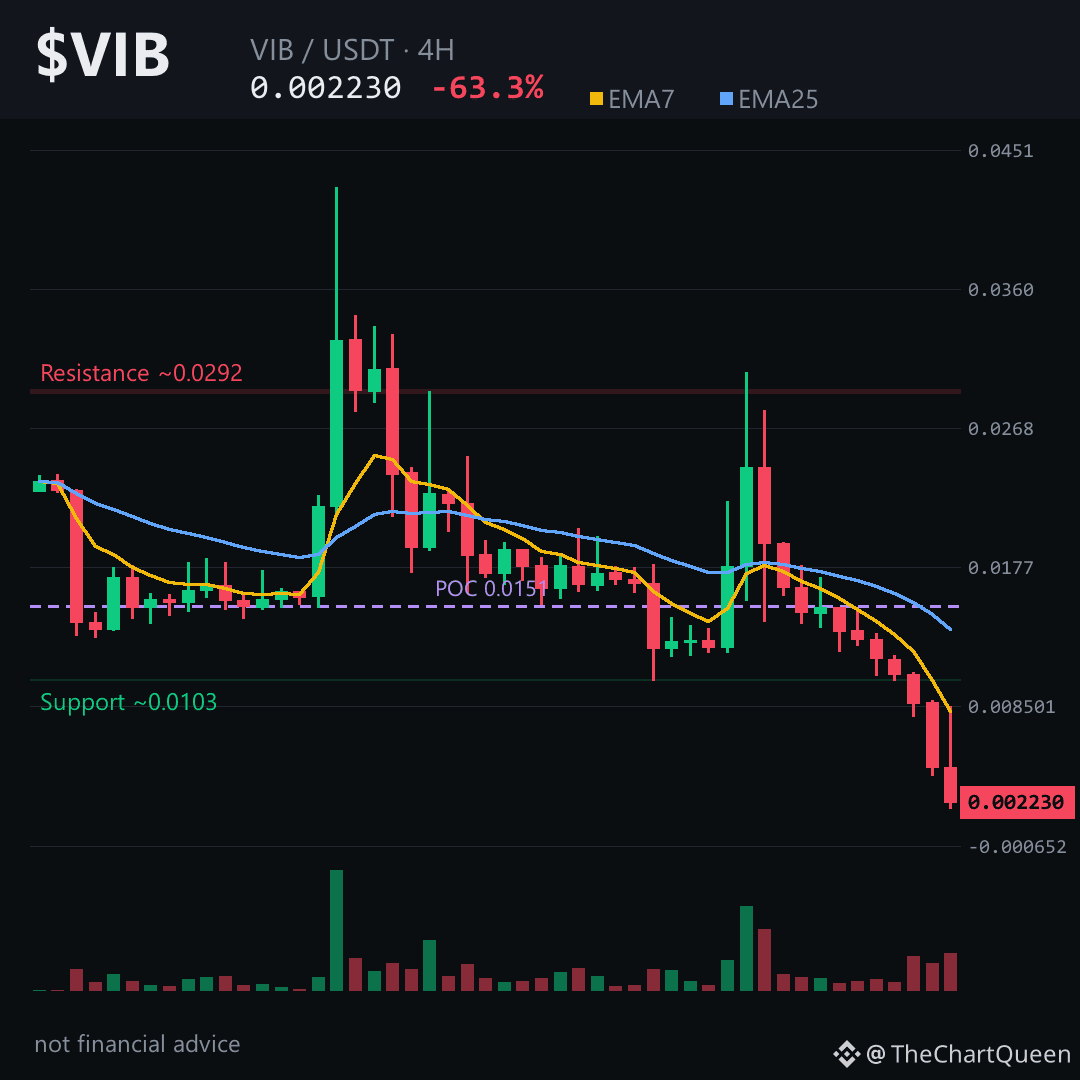
A 63% drop in a single day. The question you're secretly asking: is this the bottom, or just the middle of the fall?
Here's what the chart is actually whispering — and it's not a pretty story.
**The Read**
$VIB didn't just dip. It collapsed. The 4-hour candles show eleven of the last twelve printing red, with the final two each losing roughly half their value. That's not normal selling. That's a market structure reset — the kind that leaves a giant unfilled gap behind (an FVG, a price zone where trading was so violent it skipped clean through).
The Relative Strength Index sits near 28 — deeply oversold. But oversold doesn't mean bounce. It means momentum is exhausted in one direction, and the market needs to pause before deciding its next move.
The moving averages tell the same story. The short-term average is far below the long-term one on every timeframe. That's a textbook downtrend — the kind beginners should not try to catch with a falling knife.
**The Levels That Matter**
Price is hovering near the 0.0022 area, and the next logical floor sits around 0.0020. If that zone breaks, the next support doesn't appear until much lower — around 0.0014 on the weekly chart.
The invalidation level for the bearish view is around 0.0024. If $VIB can climb back above that on a 4-hour close, the immediate downside pressure weakens. Until then, every bounce is suspect.
Tap $VIB to pull up the chart and see that unfilled gap for yourself — it sits between 0.0089 and 0.0102, a void that often acts like a magnet before the next leg.
**My Read**
This is a coin in freefall with no futures market to anchor it — zero open interest means no leveraged players to squeeze, just spot sellers. The risk isn't missing the bounce; it's catching a dead cat.
I'll be watching whether that 0.0020 zone holds or folds — follow along and I'll share what the next structure shift reveals.
Which level are you trusting more right now on VIB? 👇
#VIB #Crypto #BinanceSquare
Not financial advice. DYOR.
Here's what the chart is actually whispering — and it's not a pretty story.
**The Read**
$VIB didn't just dip. It collapsed. The 4-hour candles show eleven of the last twelve printing red, with the final two each losing roughly half their value. That's not normal selling. That's a market structure reset — the kind that leaves a giant unfilled gap behind (an FVG, a price zone where trading was so violent it skipped clean through).
The Relative Strength Index sits near 28 — deeply oversold. But oversold doesn't mean bounce. It means momentum is exhausted in one direction, and the market needs to pause before deciding its next move.
The moving averages tell the same story. The short-term average is far below the long-term one on every timeframe. That's a textbook downtrend — the kind beginners should not try to catch with a falling knife.
**The Levels That Matter**
Price is hovering near the 0.0022 area, and the next logical floor sits around 0.0020. If that zone breaks, the next support doesn't appear until much lower — around 0.0014 on the weekly chart.
The invalidation level for the bearish view is around 0.0024. If $VIB can climb back above that on a 4-hour close, the immediate downside pressure weakens. Until then, every bounce is suspect.
Tap $VIB to pull up the chart and see that unfilled gap for yourself — it sits between 0.0089 and 0.0102, a void that often acts like a magnet before the next leg.
**My Read**
This is a coin in freefall with no futures market to anchor it — zero open interest means no leveraged players to squeeze, just spot sellers. The risk isn't missing the bounce; it's catching a dead cat.
I'll be watching whether that 0.0020 zone holds or folds — follow along and I'll share what the next structure shift reveals.
Which level are you trusting more right now on VIB? 👇
#VIB #Crypto #BinanceSquare
Not financial advice. DYOR.