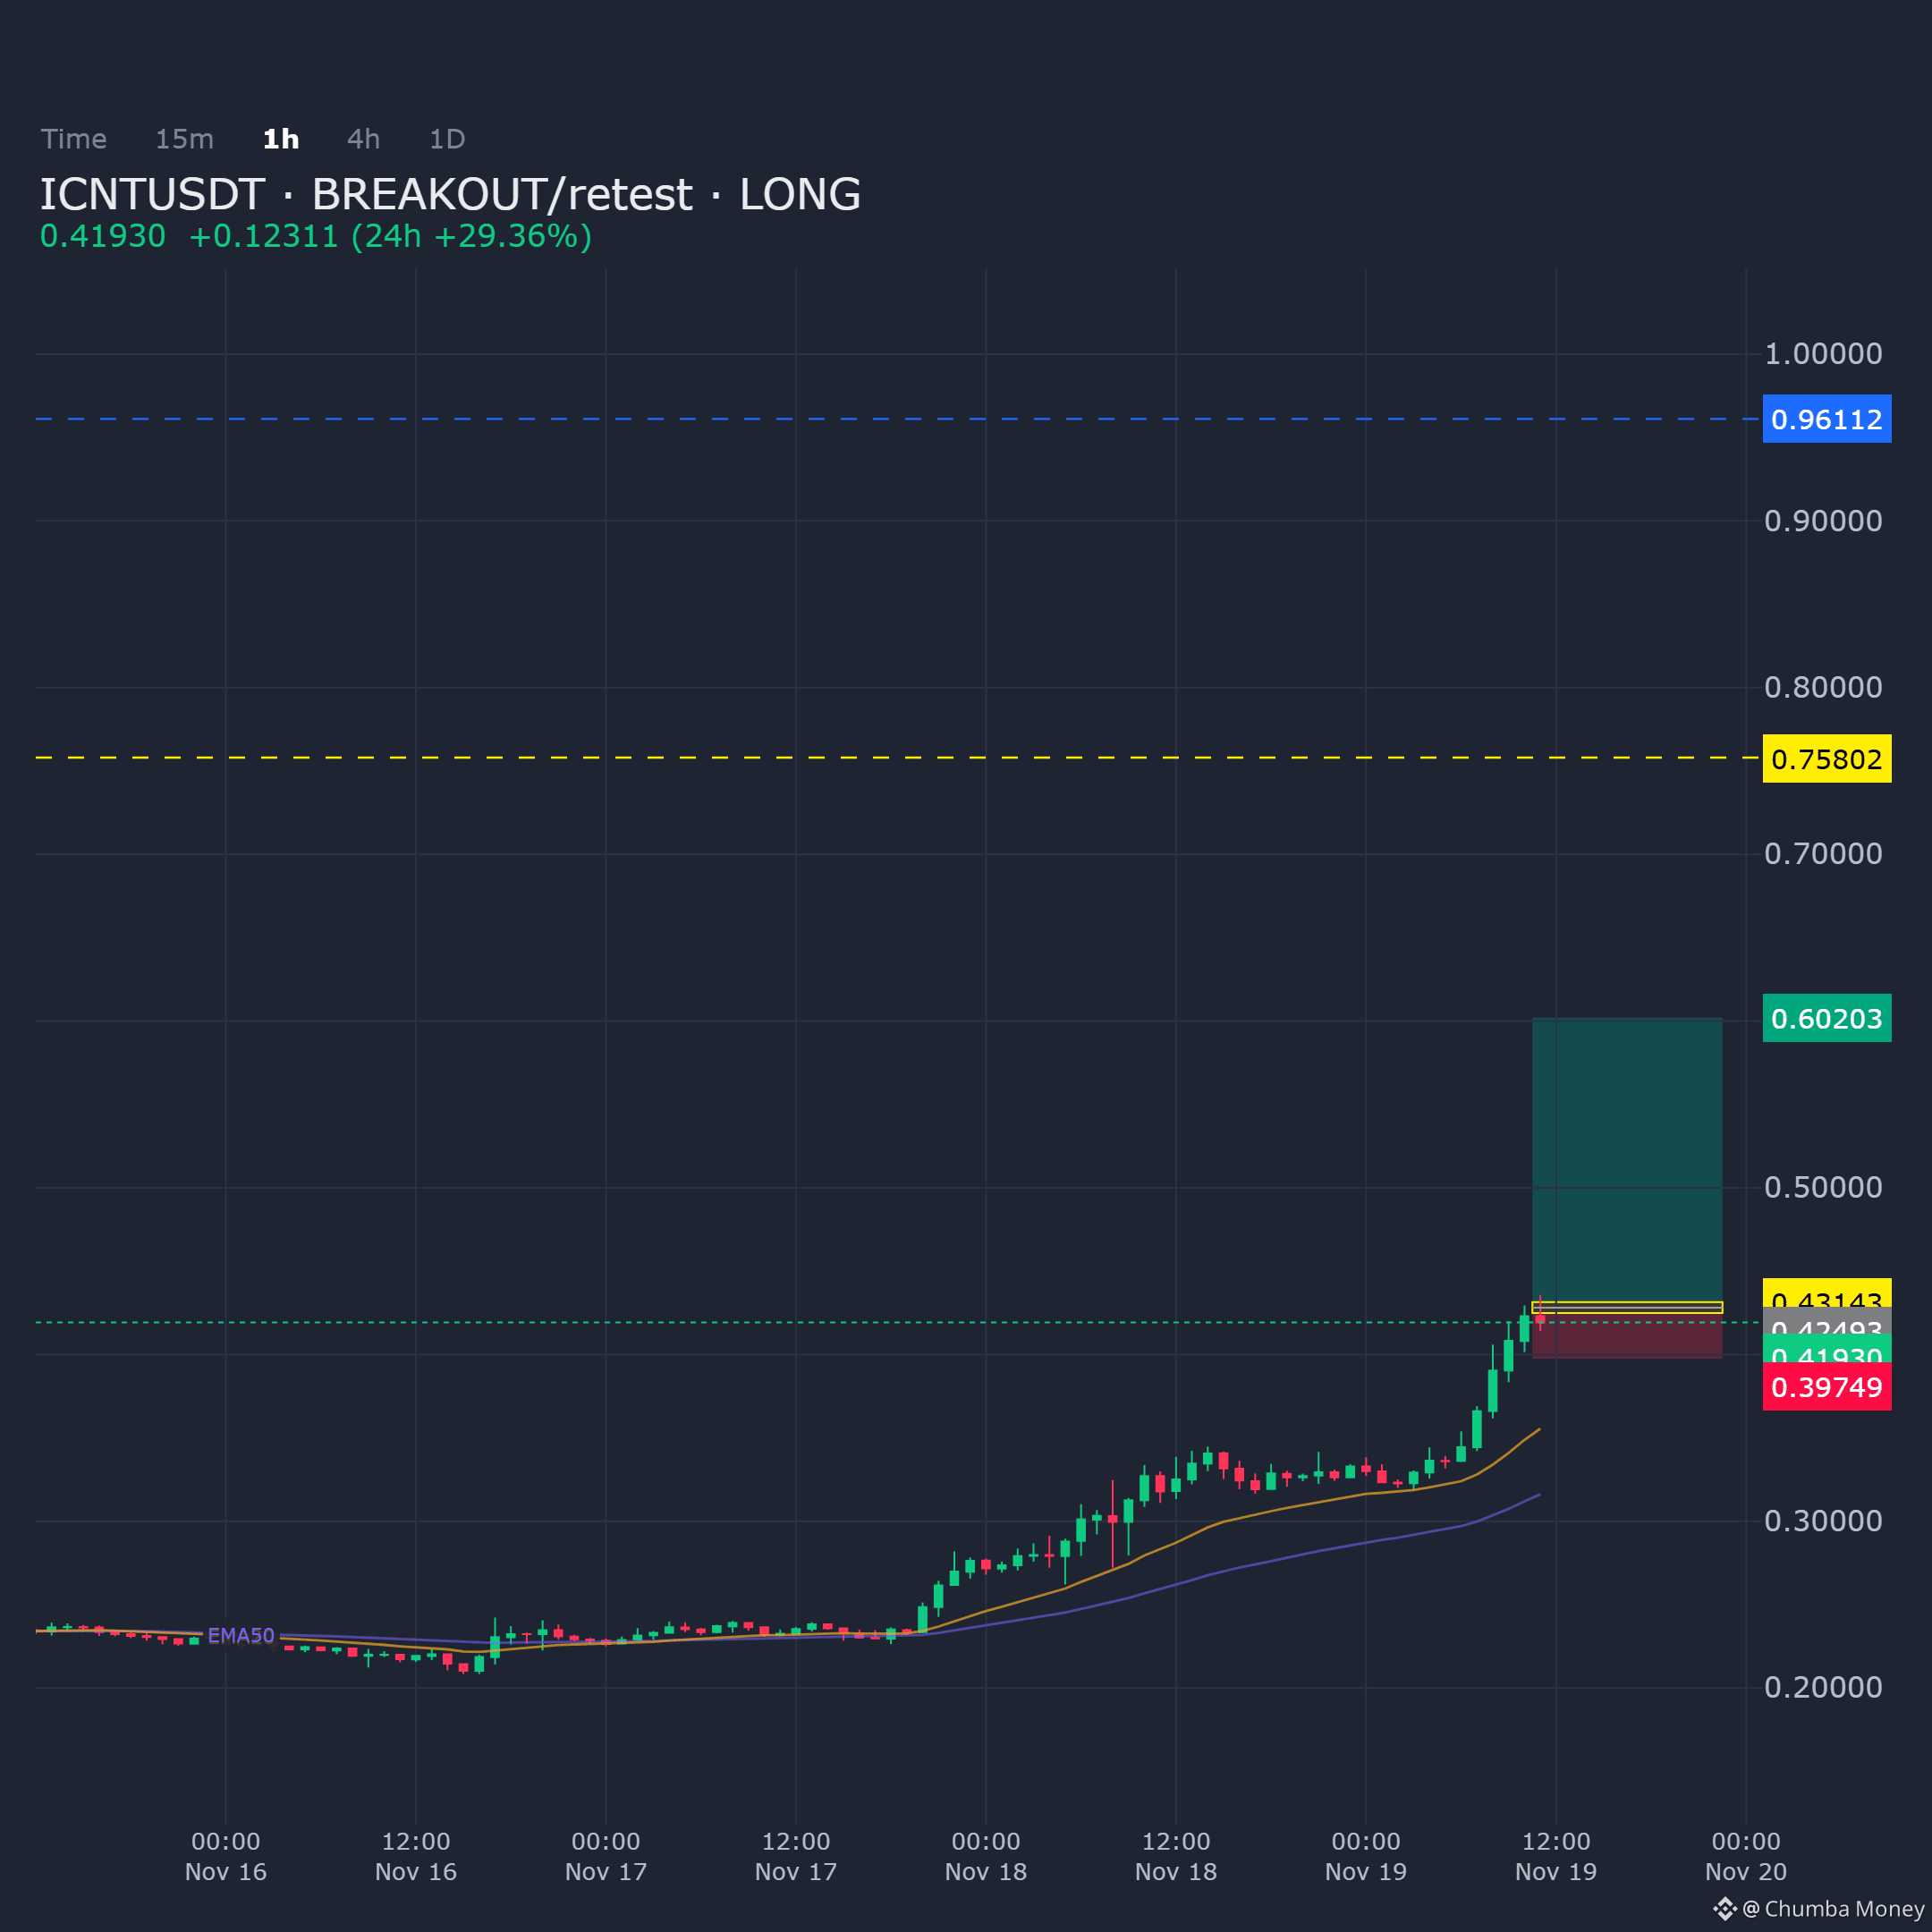

ICNTUSDT on the 1H chart shows price retracing into a defined demand zone following a breakout. The long bias remains intact provided this area continues to hold support.
Entry: 0.424932 - 0.431431
Targets: TP1: 0.602035, TP2: 0.758016, TP3: 0.961116
Stop Loss: 0.397493
$ICNT
Entry: 0.424932 - 0.431431
Targets: TP1: 0.602035, TP2: 0.758016, TP3: 0.961116
Stop Loss: 0.397493
$ICNT