
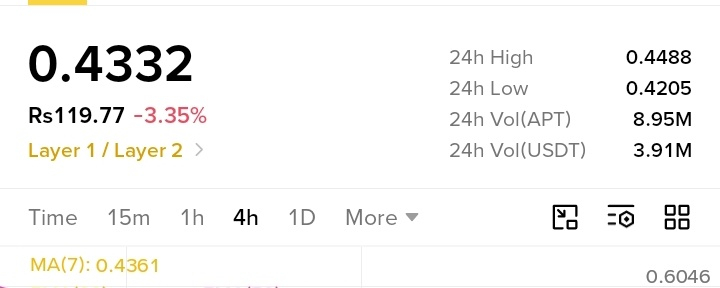

Aptos (APT) is showing signs of a possible short-term recovery, but the overall 4-hour chart still reflects a bearish market structure.
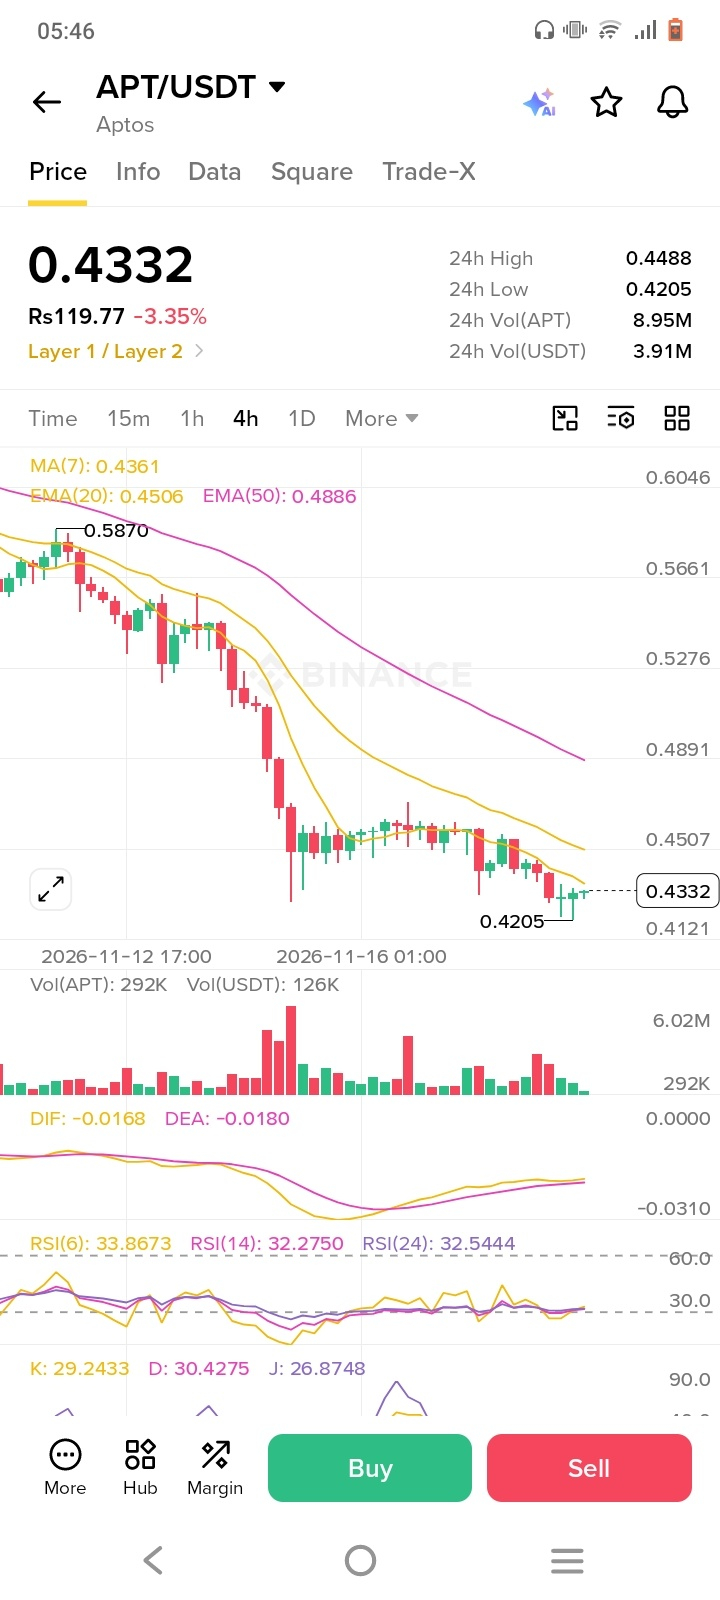
At the time of this chart snapshot, APT is trading around $0.4332, down approximately 3.35%. The price recently tested the $0.4205 support area, where buyers started showing some interest.
What Does the Technical Picture Tell Us?
The moving averages remain a concern. APT is trading below the 20 EMA ($0.4506) and 50 EMA ($0.4886), suggesting that sellers still have control of the broader trend.
The RSI is hovering around 32, indicating weak momentum and potentially oversold conditions. Meanwhile, the MACD remains below zero, although its lines are beginning to converge, which could signal that selling pressure is slowing.
Important Levels to Watch:
- Support: $0.4205
- First resistance: $0.4507
- Major resistance: $0.4886
My Market View
I don't think a small bounce is enough to confirm a trend reversal. A stronger move above $0.4507, supported by increasing volume, would make the recovery more convincing.
For now, protecting capital and waiting for confirmation seems more reasonable than chasing an entry.
Discussion: Do you think APT can recover toward $0.45, or will sellers push it below $0.42?