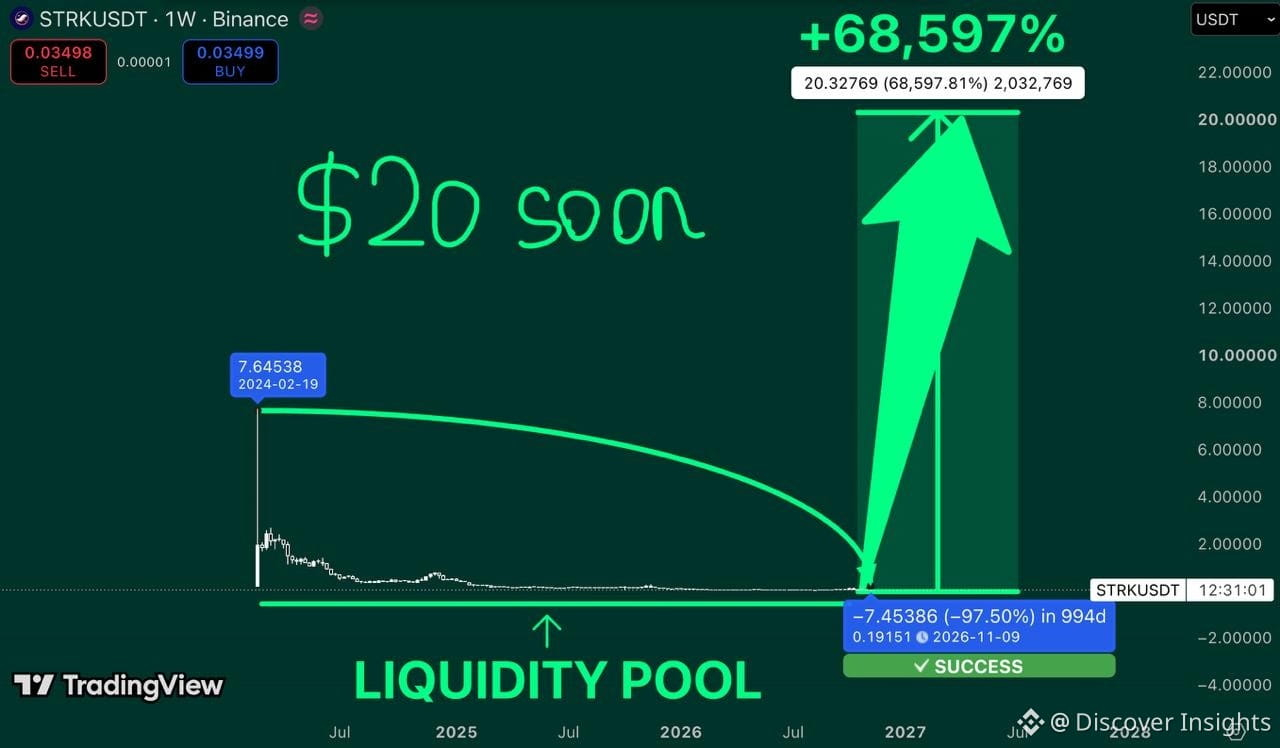
$STRK is trading around $0.035.
And this weekly chart is showing one of the most extreme setups in the crypto market.
Look at the bigger picture.
In February 2024, STRK reached $7.64.
What followed was a devastating collapse.
Lower highs. Failed recoveries. Years of relentless selling pressure.
Now price is trading more than 99% below that peak.
But here's what caught my attention.
STRK is approaching a major historical liquidity zone after an extended period of declining prices.
Could this be the beginning of a massive reversal?
Possibly. But buyers still need to prove themselves.
Here's my roadmap.
$0.10 — First recovery checkpoint.
$0.50 — Important resistance.
$1.00 — Psychological milestone.
$2.00 — Major structural target.
$7.64 — Previous historical high.
$20 — Extreme bull scenario.
The chart illustrates a speculative 68,597% projection from its marked reference point.
But a massive correction doesn't automatically mean the bottom is in.
I want to see $STRK establish higher lows, reclaim resistance, and show sustained buying volume before considering a genuine reversal.
The $20 target is an extremely aggressive scenario, not a prediction.
Still, after such a prolonged decline, any meaningful shift in market structure would be worth watching.
Sometimes the biggest reversals begin when almost everyone has stopped paying attention.
#CryptoSelloffTriggersMultipleWhaleLiquidations
$STRK
And this weekly chart is showing one of the most extreme setups in the crypto market.
Look at the bigger picture.
In February 2024, STRK reached $7.64.
What followed was a devastating collapse.
Lower highs. Failed recoveries. Years of relentless selling pressure.
Now price is trading more than 99% below that peak.
But here's what caught my attention.
STRK is approaching a major historical liquidity zone after an extended period of declining prices.
Could this be the beginning of a massive reversal?
Possibly. But buyers still need to prove themselves.
Here's my roadmap.
$0.10 — First recovery checkpoint.
$0.50 — Important resistance.
$1.00 — Psychological milestone.
$2.00 — Major structural target.
$7.64 — Previous historical high.
$20 — Extreme bull scenario.
The chart illustrates a speculative 68,597% projection from its marked reference point.
But a massive correction doesn't automatically mean the bottom is in.
I want to see $STRK establish higher lows, reclaim resistance, and show sustained buying volume before considering a genuine reversal.
The $20 target is an extremely aggressive scenario, not a prediction.
Still, after such a prolonged decline, any meaningful shift in market structure would be worth watching.
Sometimes the biggest reversals begin when almost everyone has stopped paying attention.
#CryptoSelloffTriggersMultipleWhaleLiquidations
$STRK